| Param | Original file | Final file |
|---|---|---|
| Filename | modeM0/AS1A12_095T01_9000005450_39242cztM0_level2.fits | modeM0/AS1A12_095T01_9000005450_39242cztM0_level2_quad_clean.evt |
| Size (bytes) | 919,457,280 | 140,016,960 |
| Size | 876.9 MB | 133.5 MB |
| Events in quadrant A | 5,715,096 | 1,043,636 |
| Events in quadrant B | 4,709,312 | 1,082,468 |
| Events in quadrant C | 4,416,454 | 1,030,325 |
| Events in quadrant D | 18,493,705 | 454,644 |
| Mode M9 | |||
|---|---|---|---|
| Quadrant | BADHDUFLAG | Total packets | Discarded packets |
| A | 0 | 34 | 0 |
| B | 0 | 34 | 0 |
| C | 0 | 34 | 0 |
| D | 0 | 34 | 0 |
| Mode M0 | |||
|---|---|---|---|
| Quadrant | BADHDUFLAG | Total packets | Discarded packets |
| A | 0 | 22694 | 5 |
| B | 0 | 20027 | 3 |
| C | 0 | 18819 | 3 |
| D | 0 | 61112 | 3 |
| Mode SS | |||
|---|---|---|---|
| Quadrant | BADHDUFLAG | Total packets | Discarded packets |
| A | 0 | 188 | 0 |
| B | 0 | 188 | 0 |
| C | 0 | 188 | 0 |
| D | 0 | 188 | 0 |
| Quadrant | Total seconds | Saturated seconds | Saturation percentage |
|---|---|---|---|
| A | 9044 | 328 | 3.626714% |
| B | 9044 | 155 | 1.713843% |
| C | 9044 | 5 | 0.055285% |
| D | 9044 | 5313 | 58.746130% |
Noise dominated data is calculated using 1-second bins in cleaned event files. If a bin has >2000 counts, and if more than 50% of those come from <1% of pixels, then it is considered to be noise-dominated and hence unusable.
| Quadrant | # 1 sec bins | Bins with >0 counts | Bins with >2000 counts | High rate bins dominated by noise | Noise dominated (total time) | Noise dominated (detector-on time) | Marked lightcurve |
|---|---|---|---|---|---|---|---|
| A | 24223 | 9047 | 212 | 212 | 0.88% | 2.34% | 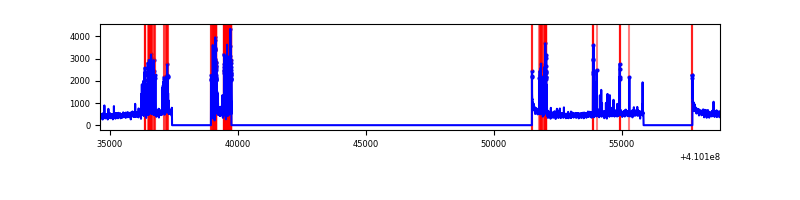 |
| B | 24223 | 9047 | 111 | 111 | 0.46% | 1.23% | 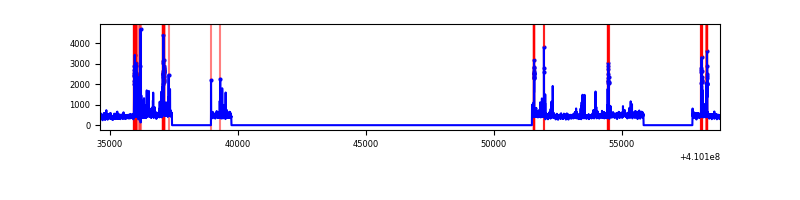 |
| C | 24223 | 9047 | 2 | 2 | 0.01% | 0.02% | 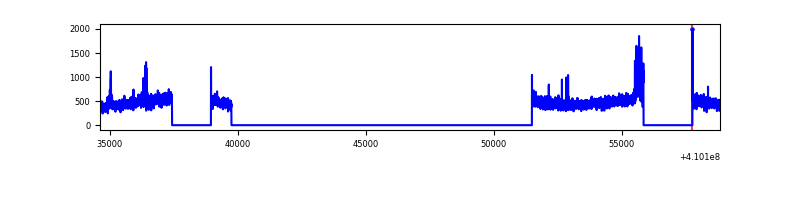 |
| D | 24223 | 9047 | 4810 | 4810 | 19.86% | 53.17% | 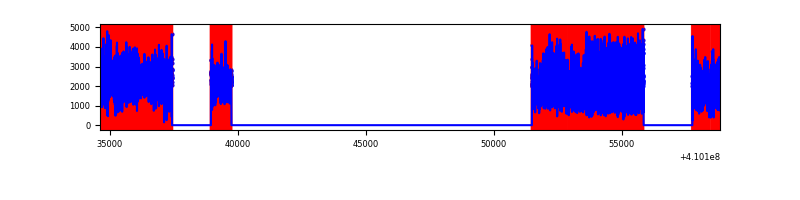 |
Top three noisy pixels from each quadrant. If the there are fewer than three noisy pixels in the level2.evt file, extra rows are filled as -1
| Pixel properties | Quadrant properties | ||||||
|---|---|---|---|---|---|---|---|
| Quadrant | DetID | PixID | Counts | Sigma | Mean | Median | Sigma |
| A | 13 | 248 | 1087648 | 5374.83 | 1013 | 995 | 202.2 |
| A | 10 | 83 | 686370 | 3390.02 | 1013 | 995 | 202.2 |
| A | 10 | 255 | 24623 | 116.87 | 1013 | 995 | 202.2 |
| B | 5 | 172 | 502400 | 2657.39 | 1005 | 978 | 188.7 |
| B | 5 | 255 | 90367 | 473.74 | 1005 | 978 | 188.7 |
| B | 0 | 190 | 65344 | 341.12 | 1005 | 978 | 188.7 |
| C | 15 | 214 | 377466 | 1643.77 | 986 | 991 | 229.0 |
| C | 9 | 187 | 142446 | 617.62 | 986 | 991 | 229.0 |
| C | 3 | 233 | 27563 | 116.02 | 986 | 991 | 229.0 |
| D | 12 | 235 | 14921967 | 84719.37 | 733 | 710 | 176.1 |
| D | 12 | 227 | 184615 | 1044.17 | 733 | 710 | 176.1 |
| D | 2 | 249 | 175763 | 993.91 | 733 | 710 | 176.1 |
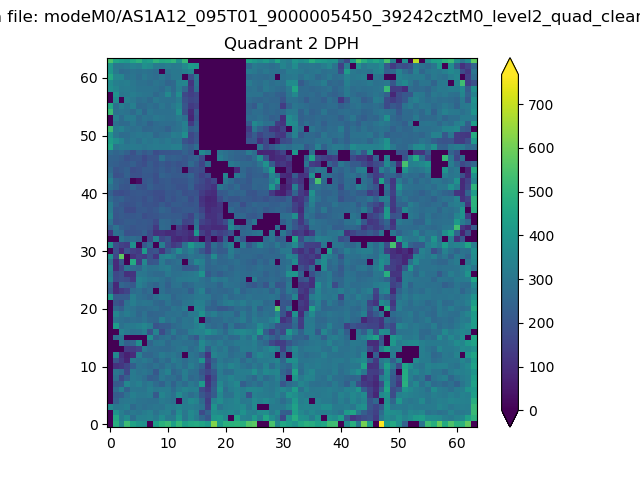
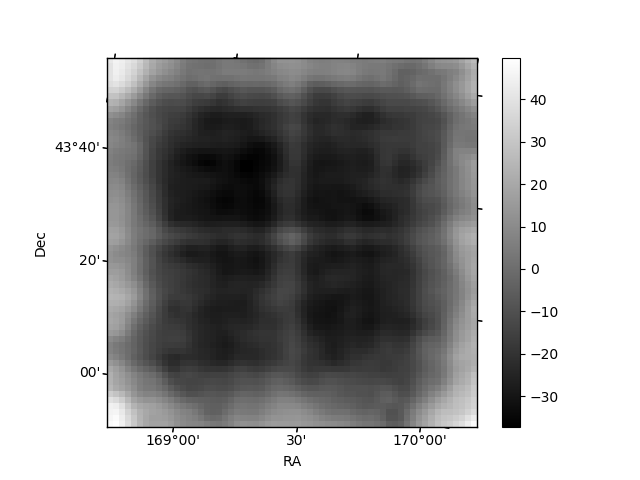
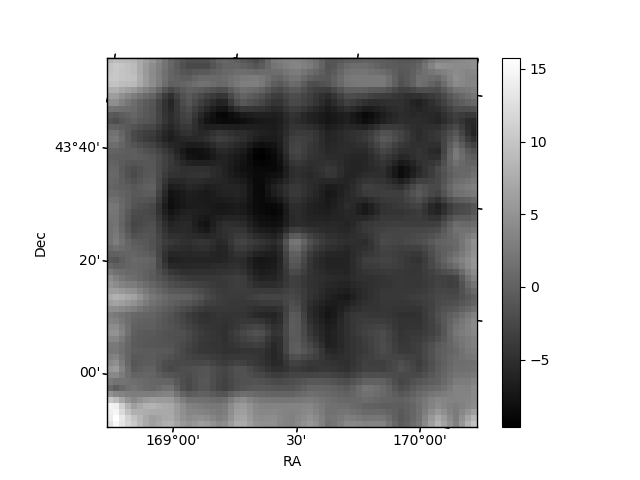
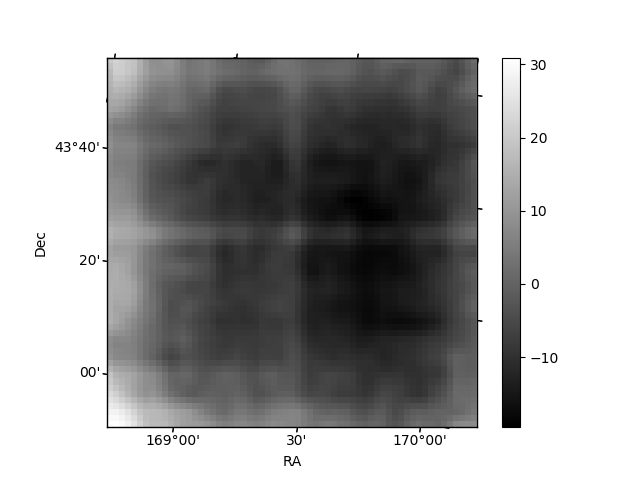
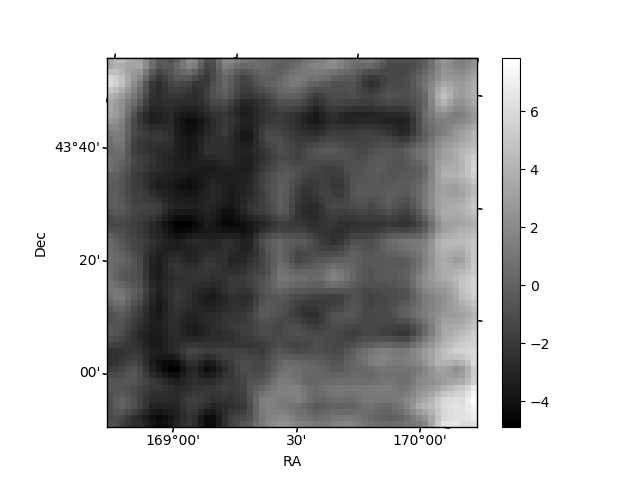
Histogram calculated using DETX and DETY for each event in the final _common_clean file
| Quadrant A | 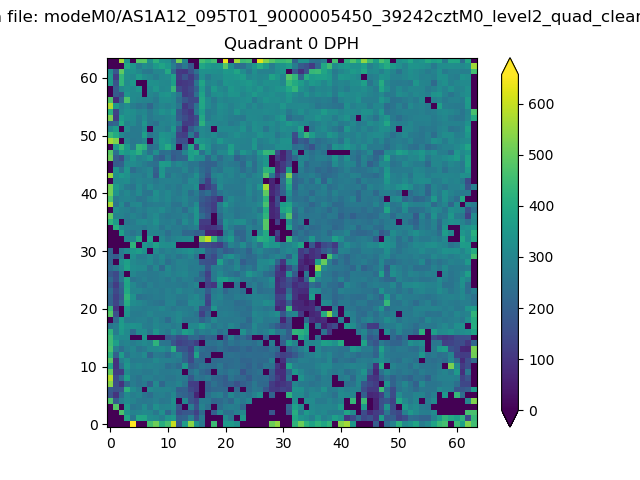 |
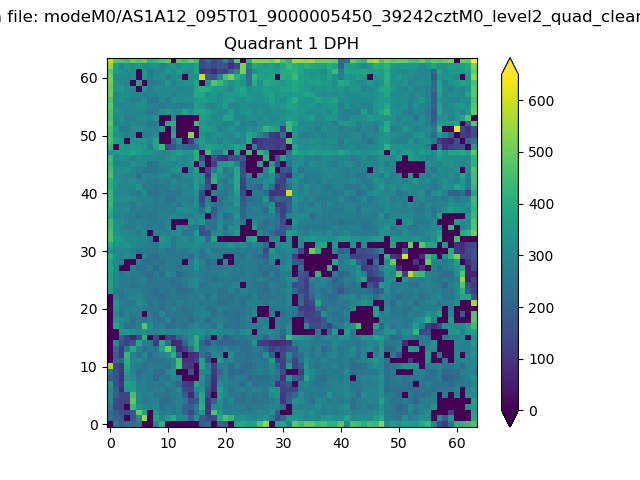 |
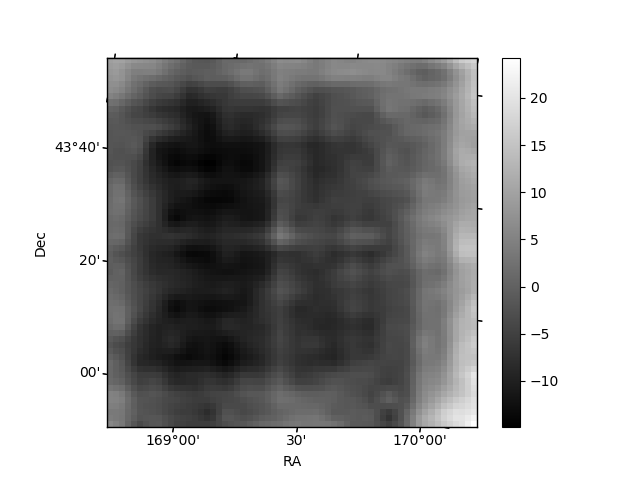
Quadrant B |
|---|---|---|---|
| Quadrant D | 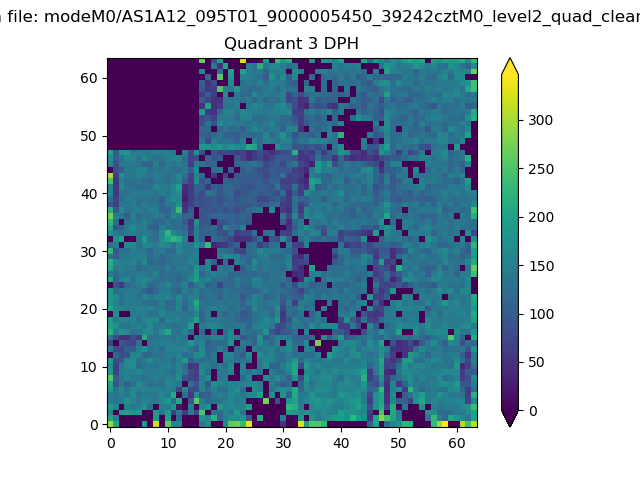 |
 |
Quadrant C |
| Plot type | Count rate plots | Images |
|---|---|---|
| Comparison with Poisson distribution Blue bars denote a histogram of data divided into 1 sec bins. Red curve is a Poisson curve with rate = median count rate of data. |
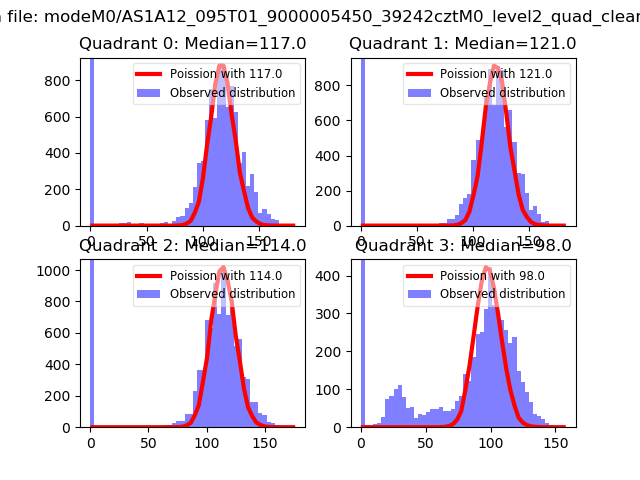 |
 |
| Quadrant-wise count rates Data is divided into 100 sec bins |
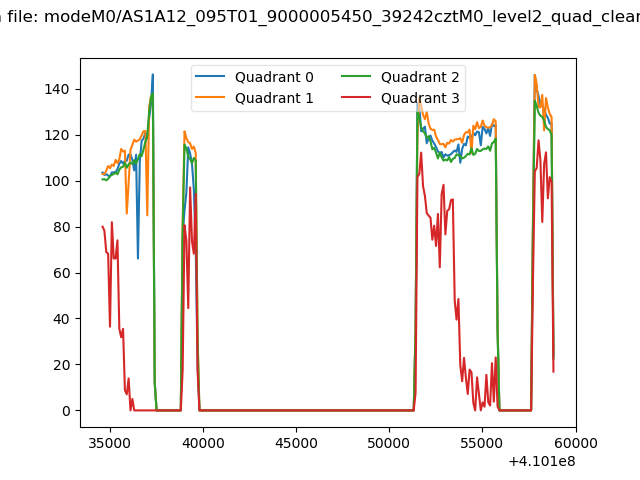 |
|
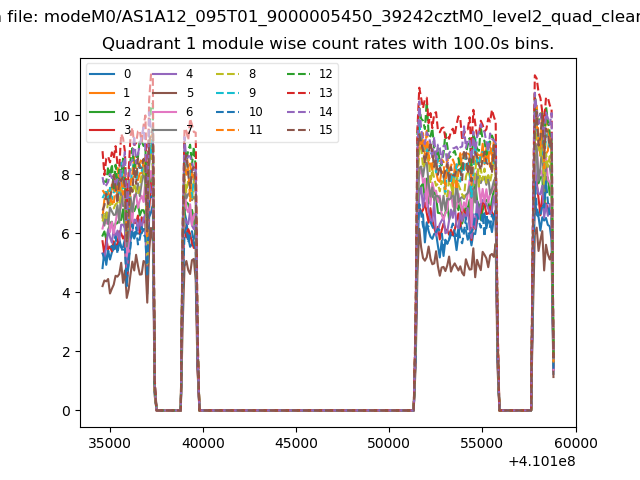
| Module-wise count rates for Quadrant A Data is divided into 100 sec bins |
 |
 |
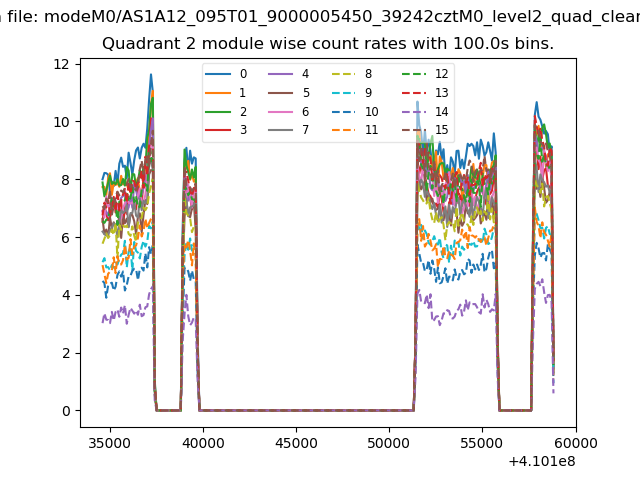
| Module-wise count rates for Quadrant B Data is divided into 100 sec bins |
 |
 |
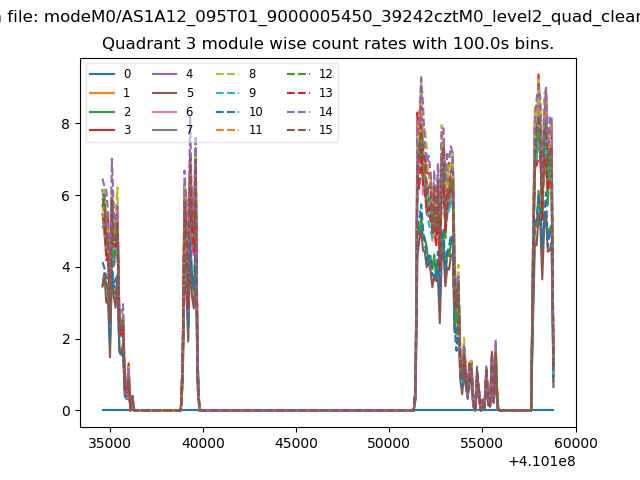
| Module-wise count rates for Quadrant C Data is divided into 100 sec bins |
 |
 |
| Module-wise count rates for Quadrant D Data is divided into 100 sec bins |
 |
 |
| Parameter | Plot |
|---|---|
| CZT HV Monitor | 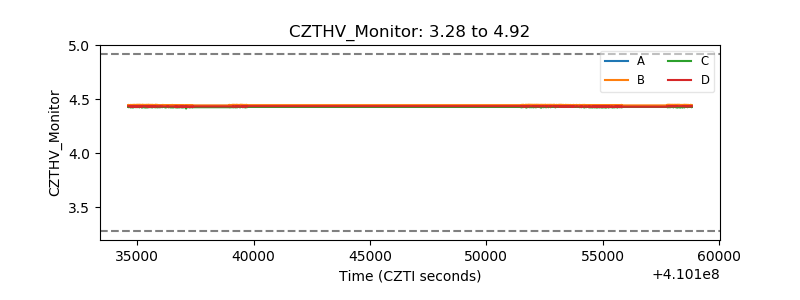 |
| D_VDD | 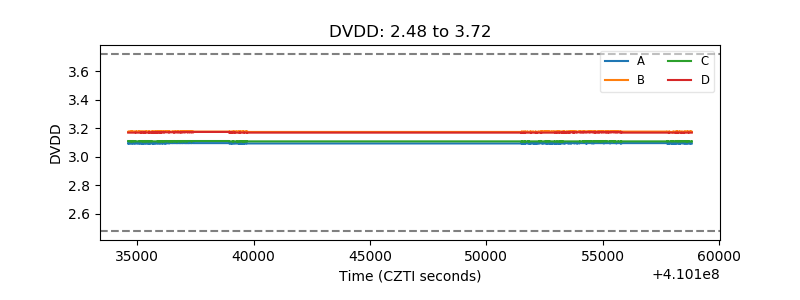 |
| Temperature 1 | 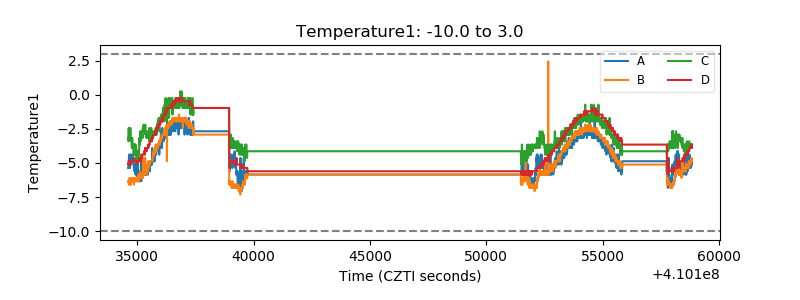 |
| Veto HV Monitor | 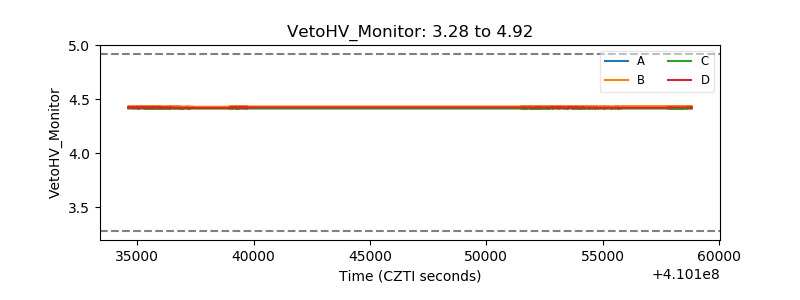 |
| Veto LLD | 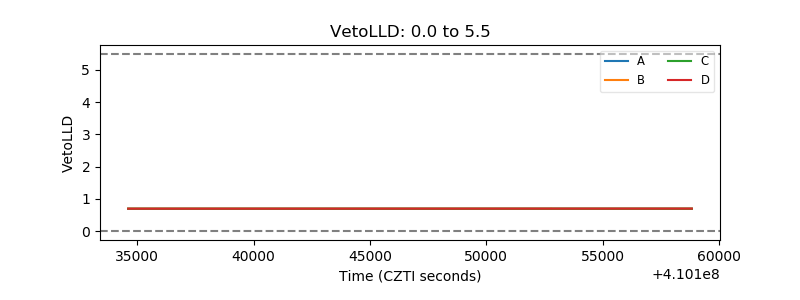 |
| Alpha Counter | 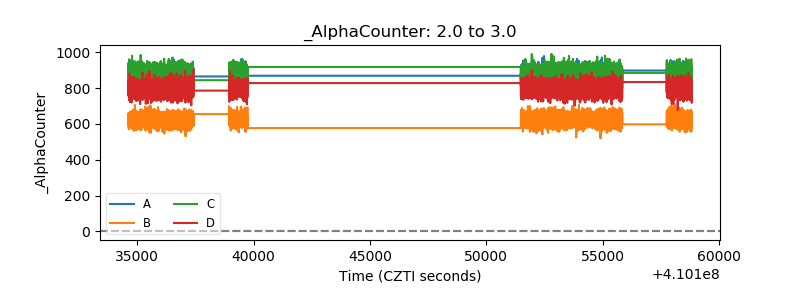 |
| _CPM_Rate | 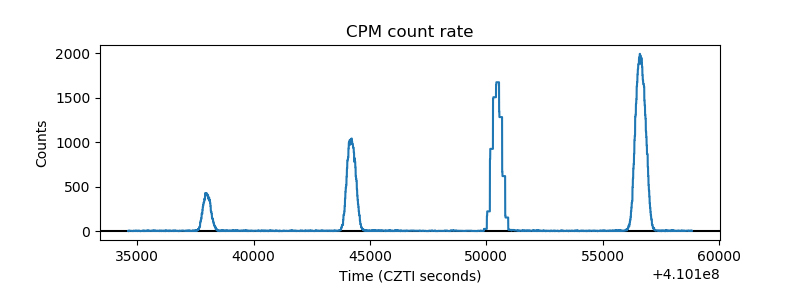 |
| CZT Counter | 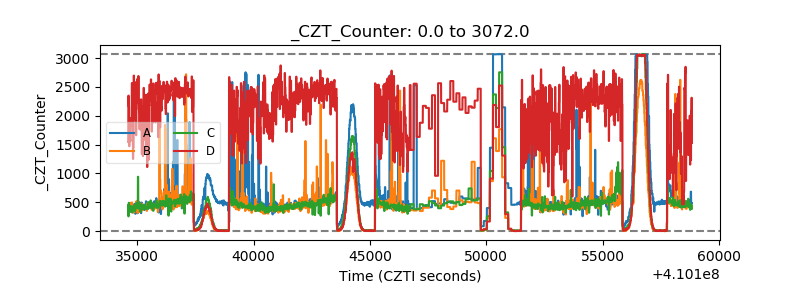 |
| +2.5 Volts monitor | 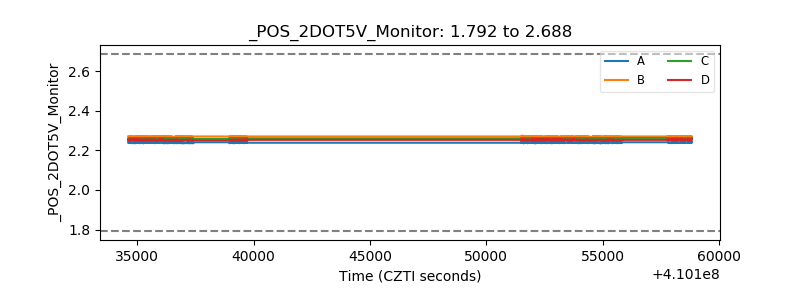 |
| +5 Volts monitor | 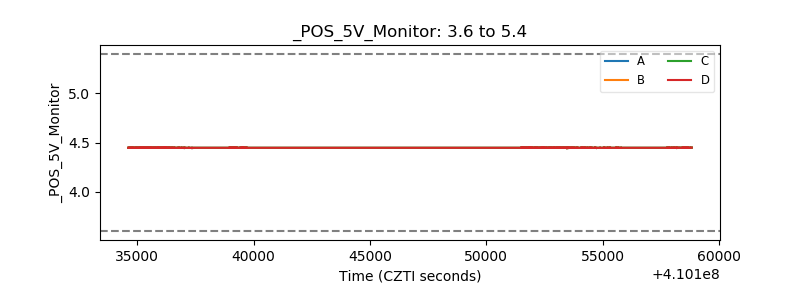 |
| _ROLL_ROT | 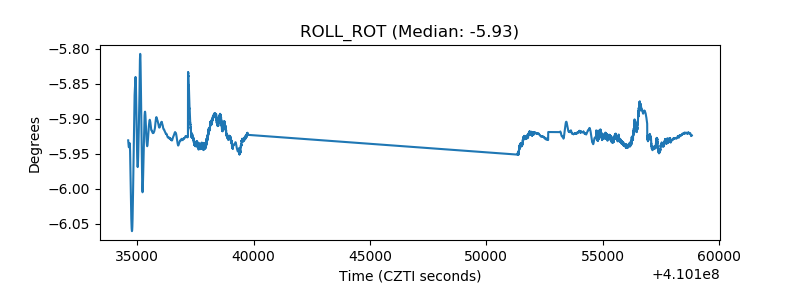 |
| _Roll_DEC | 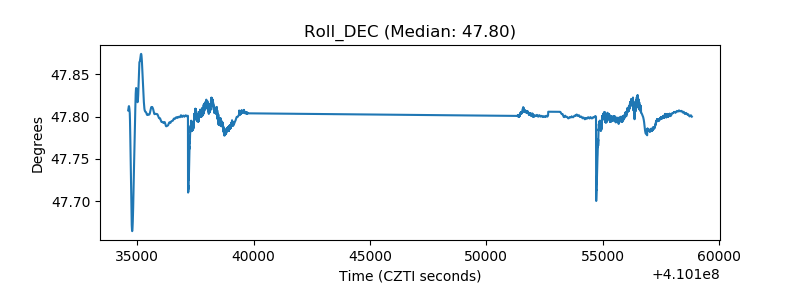 |
| _Roll_RA | 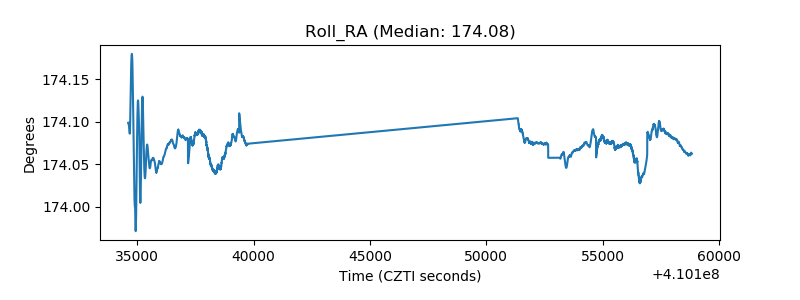 |
| Veto Counter | 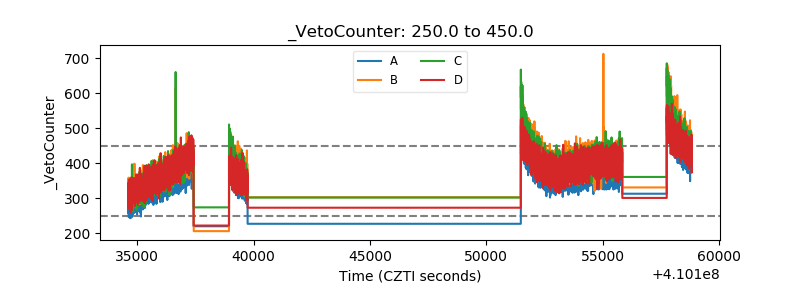 |