| Param | Original file | Final file |
|---|---|---|
| Filename | modeM0/AS1A12_095T01_9000005450_39244cztM0_level2.fits | modeM0/AS1A12_095T01_9000005450_39244cztM0_level2_quad_clean.evt |
| Size (bytes) | 1,759,046,400 | 283,622,400 |
| Size | 1.6 GB | 270.5 MB |
| Events in quadrant A | 9,963,344 | 2,147,045 |
| Events in quadrant B | 10,590,255 | 2,127,393 |
| Events in quadrant C | 8,619,523 | 2,042,919 |
| Events in quadrant D | 34,562,440 | 1,040,324 |
| Mode M9 | |||
|---|---|---|---|
| Quadrant | BADHDUFLAG | Total packets | Discarded packets |
| A | 0 | 79 | 0 |
| B | 0 | 79 | 0 |
| C | 0 | 79 | 0 |
| D | 0 | 79 | 0 |
| Mode M0 | |||
|---|---|---|---|
| Quadrant | BADHDUFLAG | Total packets | Discarded packets |
| A | 0 | 40048 | 5 |
| B | 0 | 43069 | 4 |
| C | 0 | 36475 | 4 |
| D | 0 | 114931 | 4 |
| Mode SS | |||
|---|---|---|---|
| Quadrant | BADHDUFLAG | Total packets | Discarded packets |
| A | 0 | 364 | 0 |
| B | 0 | 364 | 0 |
| C | 0 | 364 | 0 |
| D | 0 | 364 | 0 |
| Quadrant | Total seconds | Saturated seconds | Saturation percentage |
|---|---|---|---|
| A | 17840 | 138 | 0.773543% |
| B | 17840 | 705 | 3.951794% |
| C | 17840 | 15 | 0.084081% |
| D | 17840 | 9520 | 53.363229% |
Noise dominated data is calculated using 1-second bins in cleaned event files. If a bin has >2000 counts, and if more than 50% of those come from <1% of pixels, then it is considered to be noise-dominated and hence unusable.
| Quadrant | # 1 sec bins | Bins with >0 counts | Bins with >2000 counts | High rate bins dominated by noise | Noise dominated (total time) | Noise dominated (detector-on time) | Marked lightcurve |
|---|---|---|---|---|---|---|---|
| A | 25702 | 17844 | 110 | 110 | 0.43% | 0.62% | 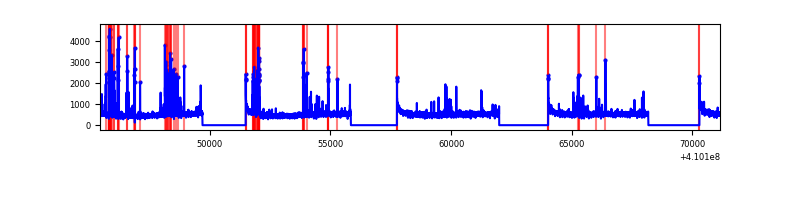 |
| B | 25702 | 17844 | 523 | 523 | 2.03% | 2.93% | 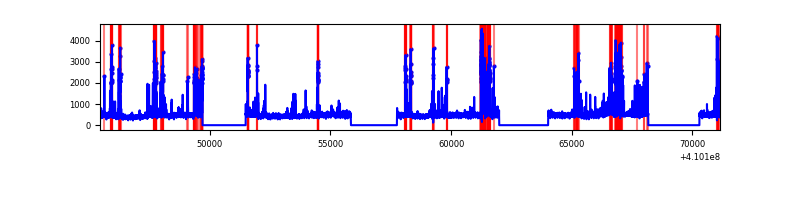 |
| C | 25702 | 17844 | 5 | 5 | 0.02% | 0.03% | 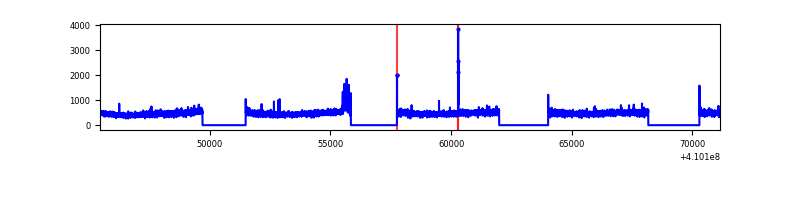 |
| D | 25702 | 17841 | 8082 | 8082 | 31.45% | 45.30% | 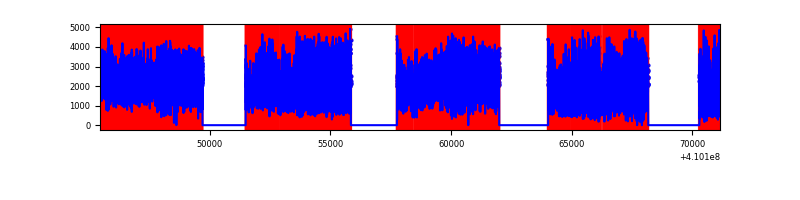 |
Top three noisy pixels from each quadrant. If the there are fewer than three noisy pixels in the level2.evt file, extra rows are filled as -1
| Pixel properties | Quadrant properties | ||||||
|---|---|---|---|---|---|---|---|
| Quadrant | DetID | PixID | Counts | Sigma | Mean | Median | Sigma |
| A | 10 | 83 | 1243113 | 3047.33 | 2056 | 2023 | 407.3 |
| A | 13 | 248 | 721428 | 1766.4 | 2056 | 2023 | 407.3 |
| A | 10 | 255 | 53954 | 127.51 | 2056 | 2023 | 407.3 |
| B | 5 | 172 | 1647483 | 4440.77 | 1988 | 1939 | 370.6 |
| B | 5 | 255 | 792420 | 2133.24 | 1988 | 1939 | 370.6 |
| B | 0 | 190 | 187281 | 500.18 | 1988 | 1939 | 370.6 |
| C | 15 | 214 | 734589 | 1612.22 | 1975 | 1986 | 454.4 |
| C | 9 | 187 | 132248 | 286.66 | 1975 | 1986 | 454.4 |
| C | 3 | 233 | 22221 | 44.53 | 1975 | 1986 | 454.4 |
| D | 12 | 235 | 26939473 | 73441.75 | 1526 | 1479 | 366.8 |
| D | 2 | 249 | 737564 | 2006.81 | 1526 | 1479 | 366.8 |
| D | 5 | 222 | 362147 | 983.3 | 1526 | 1479 | 366.8 |
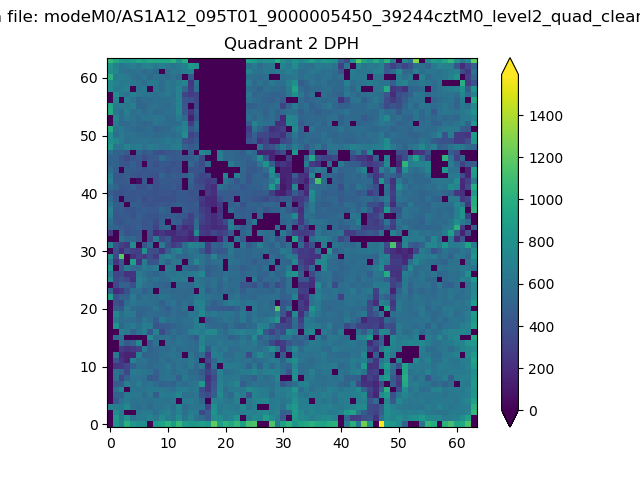
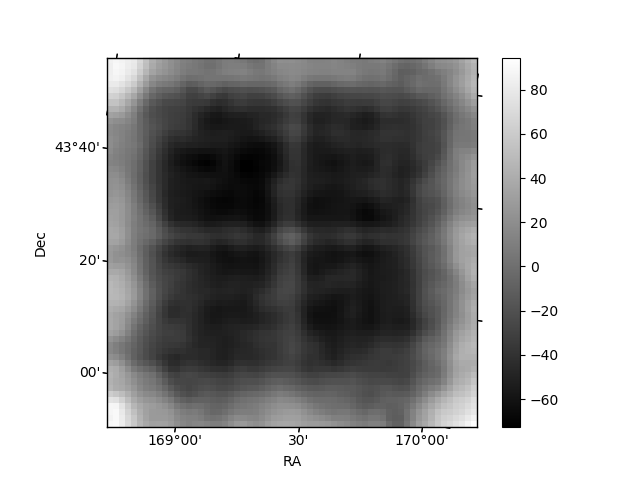
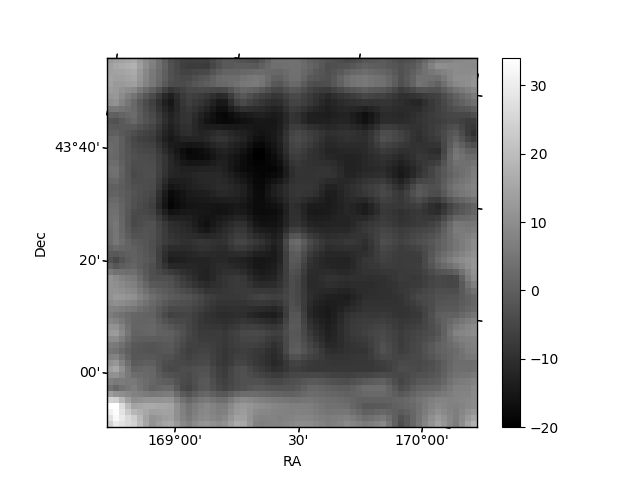
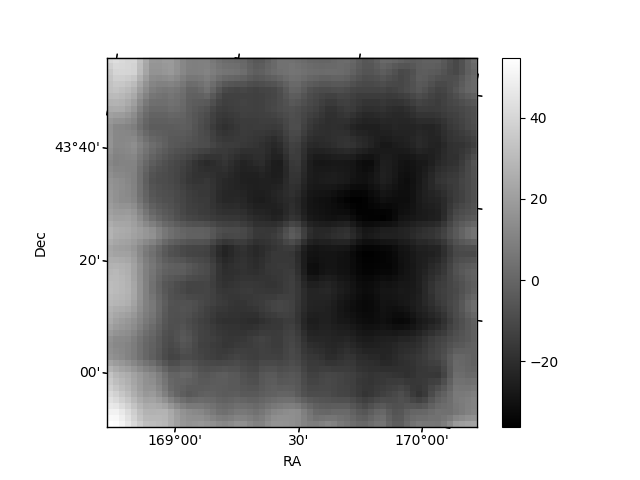
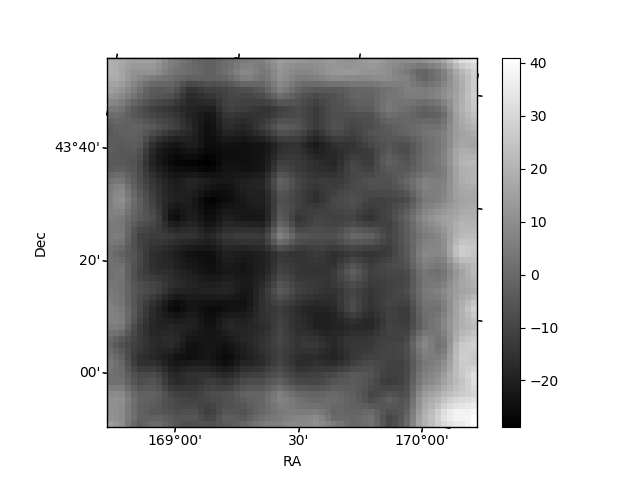
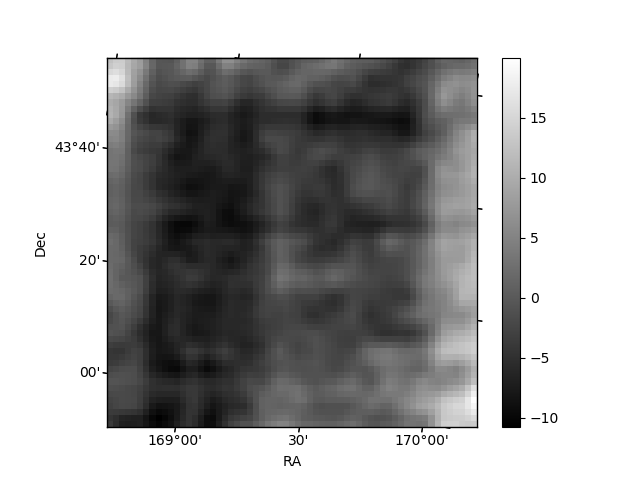
Histogram calculated using DETX and DETY for each event in the final _common_clean file
| Quadrant A | 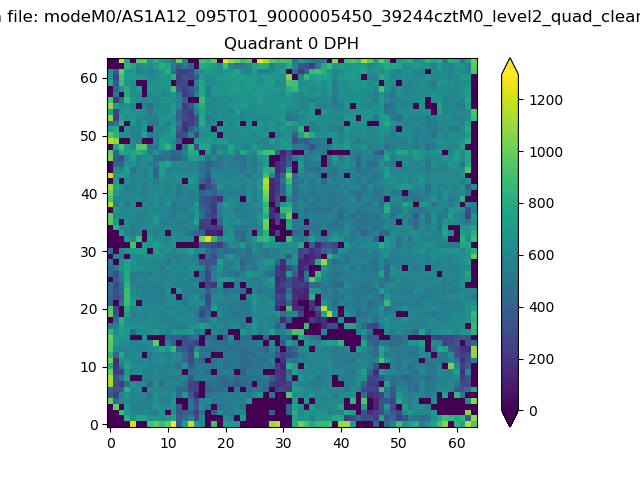 |
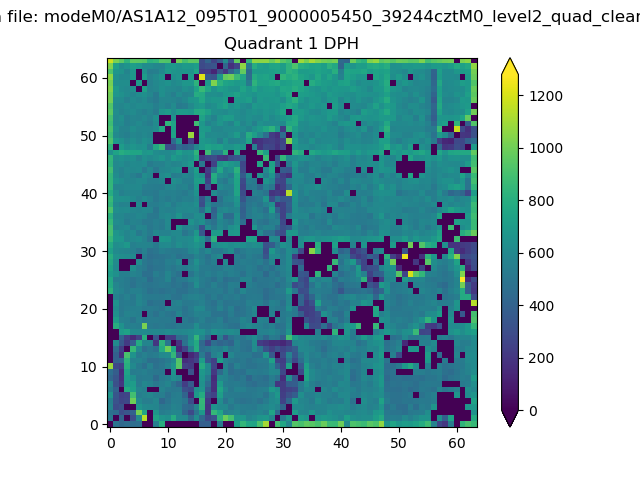 |
Quadrant B |
|---|---|---|---|
| Quadrant D | 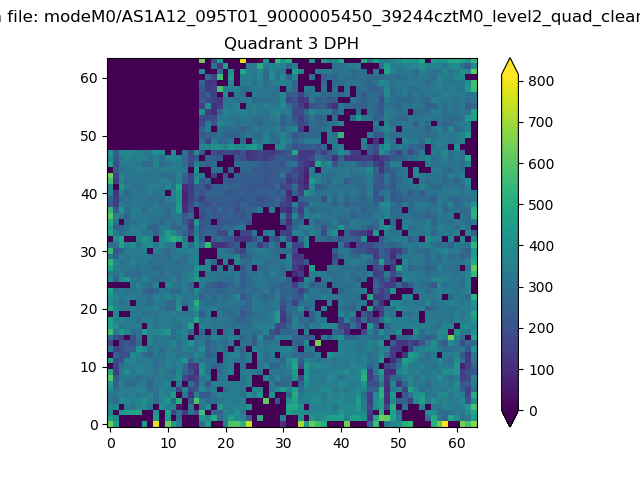 |
 |
Quadrant C |
| Plot type | Count rate plots | Images |
|---|---|---|
| Comparison with Poisson distribution Blue bars denote a histogram of data divided into 1 sec bins. Red curve is a Poisson curve with rate = median count rate of data. |
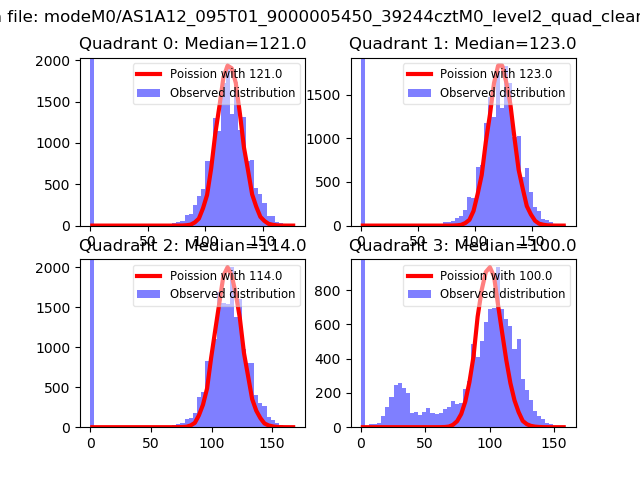 |
 |
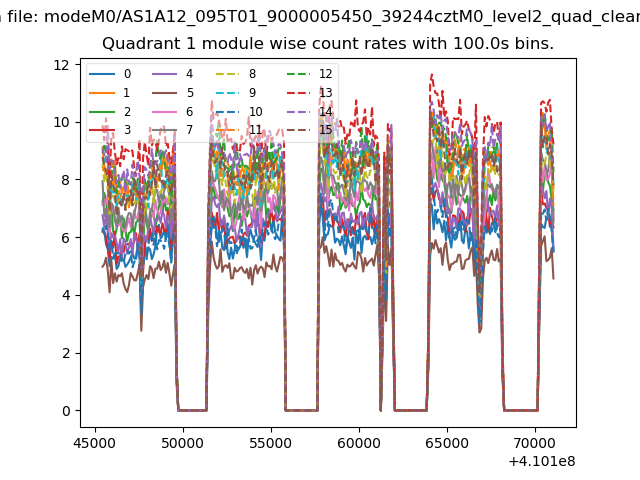
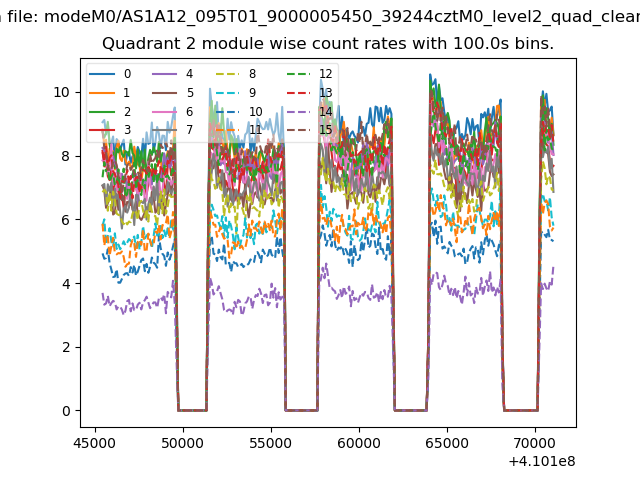
| Quadrant-wise count rates Data is divided into 100 sec bins |
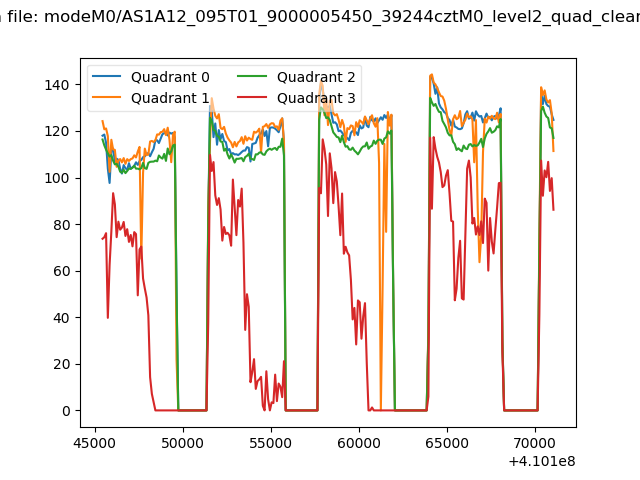 |
|
| Module-wise count rates for Quadrant A Data is divided into 100 sec bins |
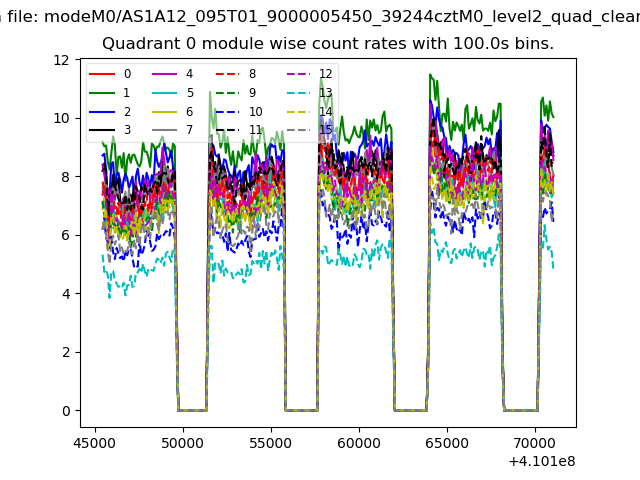 |
 |
| Module-wise count rates for Quadrant B Data is divided into 100 sec bins |
 |
 |
| Module-wise count rates for Quadrant C Data is divided into 100 sec bins |
 |
 |
| Module-wise count rates for Quadrant D Data is divided into 100 sec bins |
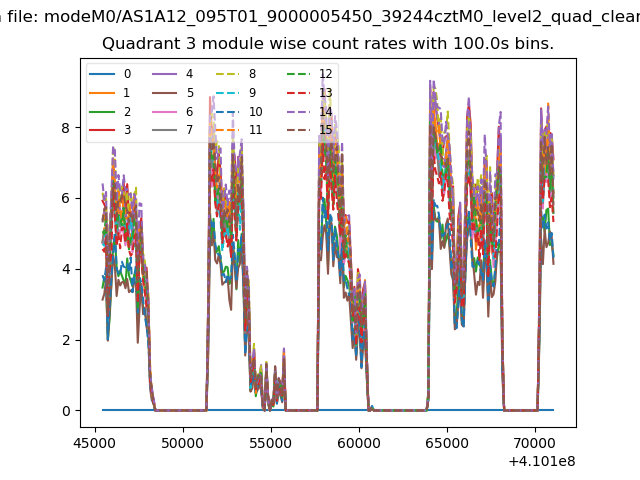 |
 |
| Parameter | Plot |
|---|---|
| CZT HV Monitor | 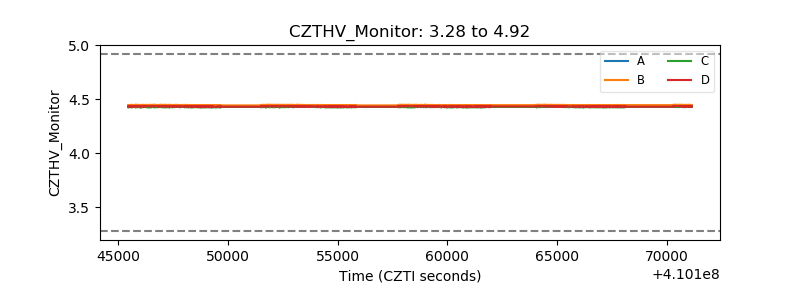 |
| D_VDD | 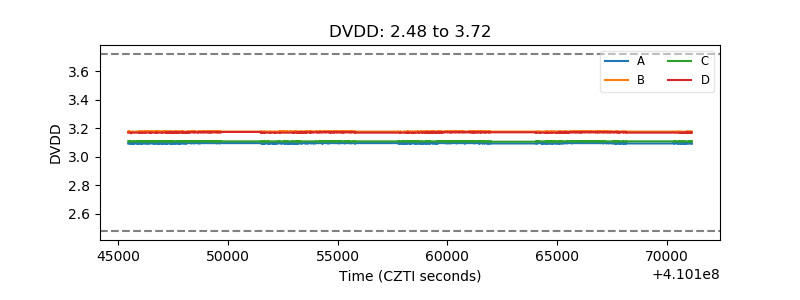 |
| Temperature 1 | 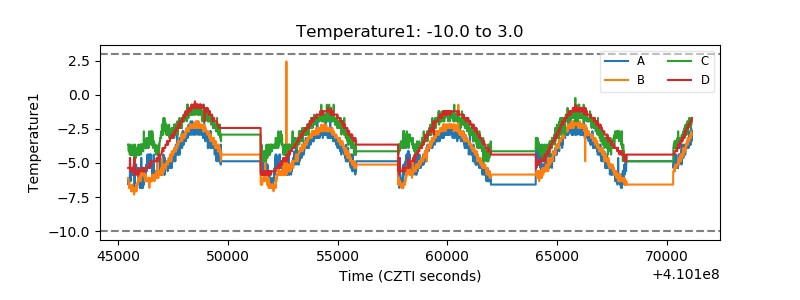 |
| Veto HV Monitor | 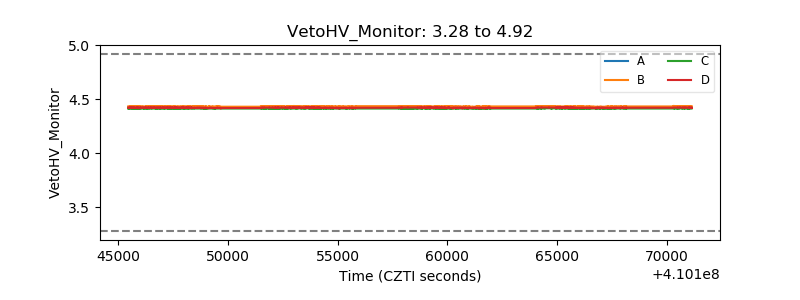 |
| Veto LLD | 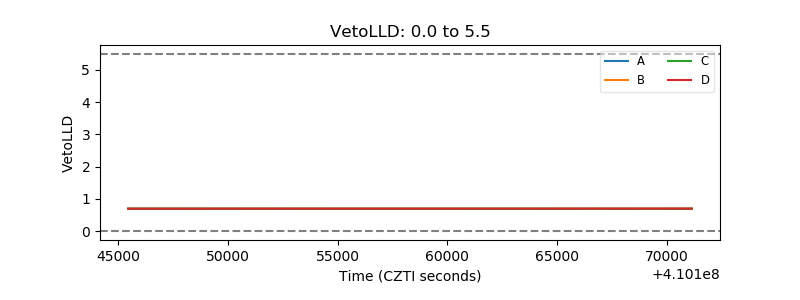 |
| Alpha Counter | 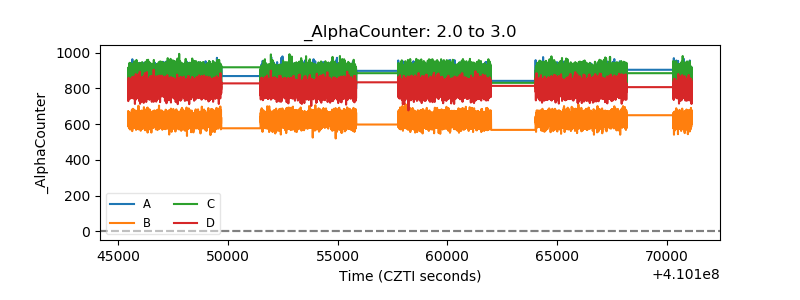 |
| _CPM_Rate | 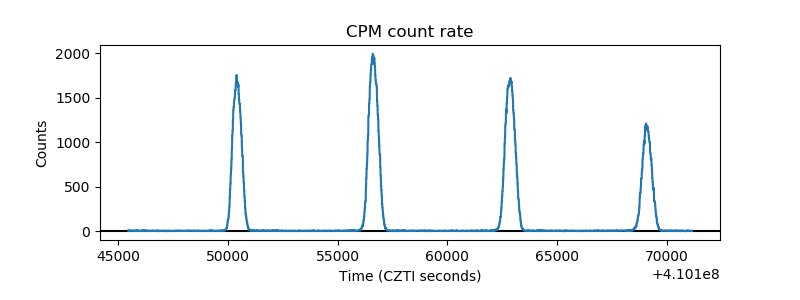 |
| CZT Counter | 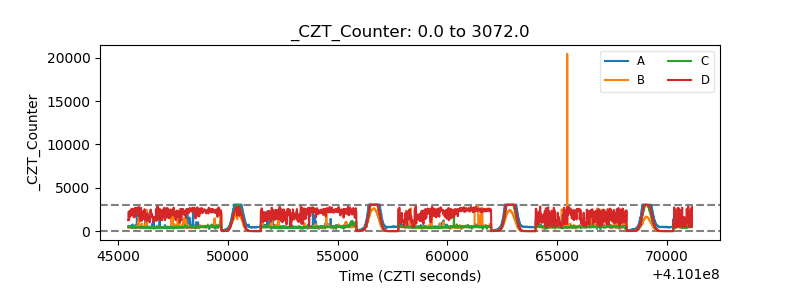 |
| +2.5 Volts monitor | 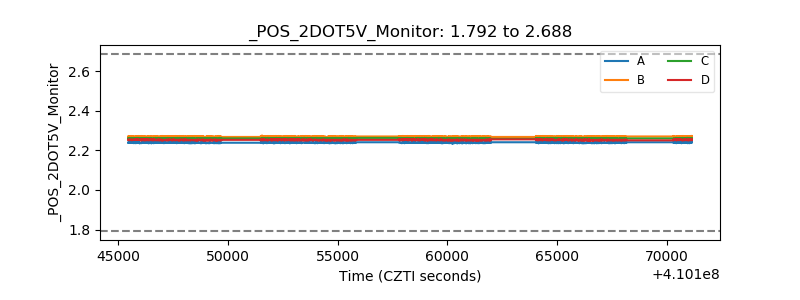 |
| +5 Volts monitor | 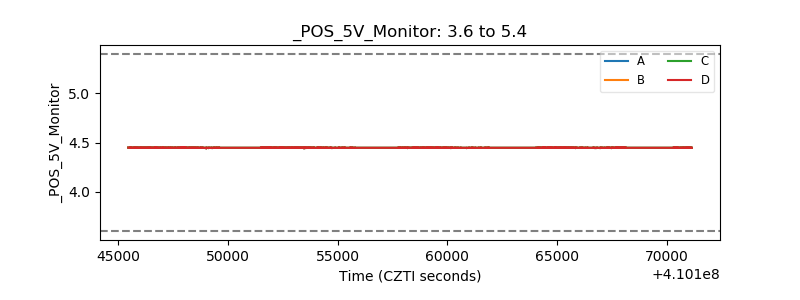 |
| _ROLL_ROT | 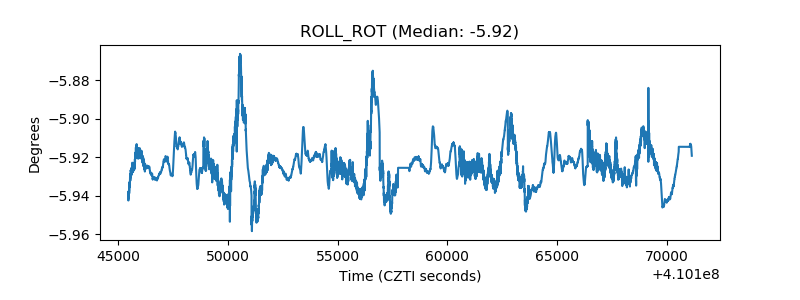 |
| _Roll_DEC | 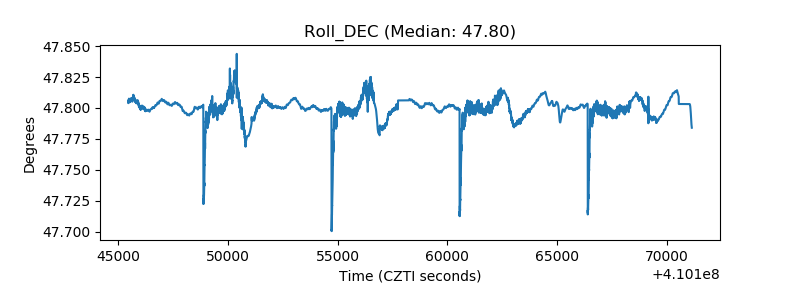 |
| _Roll_RA | 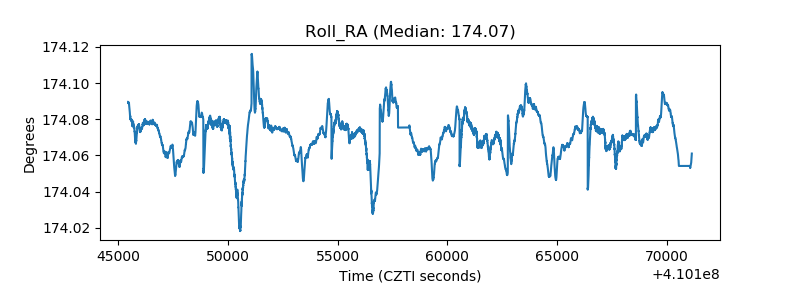 |
| Veto Counter | 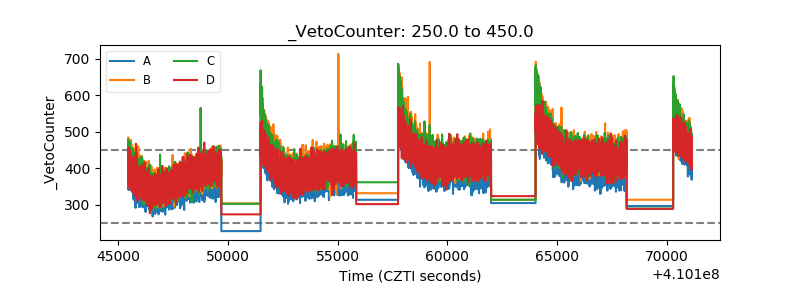 |