| Param | Original file | Final file |
|---|---|---|
| Filename | modeM0/AS1A12_095T01_9000005450_39245cztM0_level2.fits | modeM0/AS1A12_095T01_9000005450_39245cztM0_level2_quad_clean.evt |
| Size (bytes) | 433,319,040 | 82,368,000 |
| Size | 413.2 MB | 78.6 MB |
| Events in quadrant A | 2,664,332 | 603,601 |
| Events in quadrant B | 3,348,545 | 566,624 |
| Events in quadrant C | 2,344,903 | 568,048 |
| Events in quadrant D | 7,311,339 | 421,257 |
| Mode M9 | |||
|---|---|---|---|
| Quadrant | BADHDUFLAG | Total packets | Discarded packets |
| A | 0 | 22 | 0 |
| B | 0 | 22 | 0 |
| C | 0 | 22 | 0 |
| D | 0 | 22 | 0 |
| Mode M0 | |||
|---|---|---|---|
| Quadrant | BADHDUFLAG | Total packets | Discarded packets |
| A | 0 | 10627 | 2 |
| B | 0 | 12901 | 1 |
| C | 0 | 9678 | 1 |
| D | 0 | 25050 | 1 |
| Mode SS | |||
|---|---|---|---|
| Quadrant | BADHDUFLAG | Total packets | Discarded packets |
| A | 0 | 96 | 0 |
| B | 0 | 96 | 0 |
| C | 0 | 96 | 0 |
| D | 0 | 96 | 0 |
| Quadrant | Total seconds | Saturated seconds | Saturation percentage |
|---|---|---|---|
| A | 4768 | 15 | 0.314597% |
| B | 4768 | 387 | 8.116611% |
| C | 4768 | 6 | 0.125839% |
| D | 4768 | 1441 | 30.222315% |
Noise dominated data is calculated using 1-second bins in cleaned event files. If a bin has >2000 counts, and if more than 50% of those come from <1% of pixels, then it is considered to be noise-dominated and hence unusable.
| Quadrant | # 1 sec bins | Bins with >0 counts | Bins with >2000 counts | High rate bins dominated by noise | Noise dominated (total time) | Noise dominated (detector-on time) | Marked lightcurve |
|---|---|---|---|---|---|---|---|
| A | 6921 | 4769 | 9 | 9 | 0.13% | 0.19% | 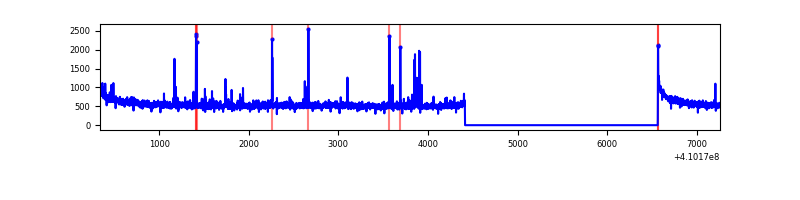 |
| B | 6921 | 4769 | 250 | 250 | 3.61% | 5.24% | 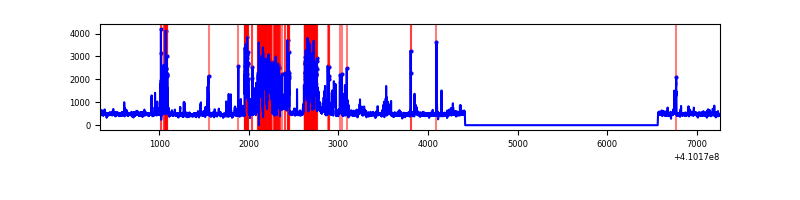 |
| C | 6921 | 4769 | 2 | 2 | 0.03% | 0.04% | 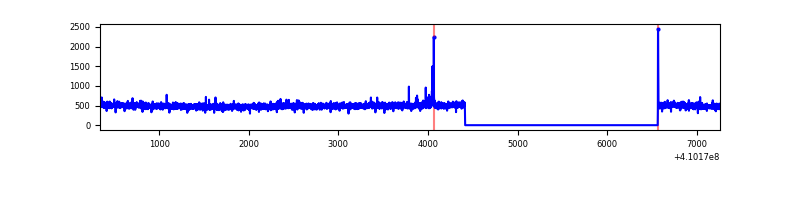 |
| D | 6921 | 4768 | 1230 | 1230 | 17.77% | 25.80% | 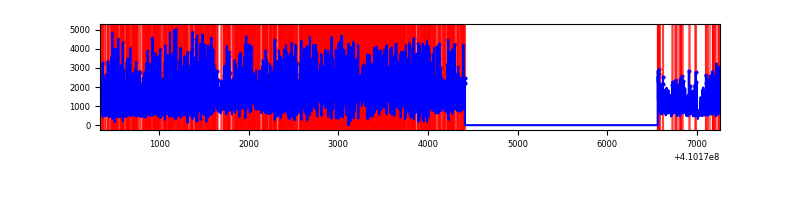 |
Top three noisy pixels from each quadrant. If the there are fewer than three noisy pixels in the level2.evt file, extra rows are filled as -1
| Pixel properties | Quadrant properties | ||||||
|---|---|---|---|---|---|---|---|
| Quadrant | DetID | PixID | Counts | Sigma | Mean | Median | Sigma |
| A | 10 | 83 | 381151 | 3334.32 | 568 | 558 | 114.1 |
| A | 13 | 248 | 65935 | 572.76 | 568 | 558 | 114.1 |
| A | 10 | 255 | 22988 | 196.51 | 568 | 558 | 114.1 |
| B | 5 | 172 | 988983 | 9905.03 | 532 | 517 | 99.8 |
| B | 5 | 184 | 137080 | 1368.44 | 532 | 517 | 99.8 |
| B | 5 | 255 | 64945 | 645.61 | 532 | 517 | 99.8 |
| C | 15 | 214 | 203518 | 1624.02 | 540 | 543 | 125.0 |
| C | 9 | 187 | 25075 | 196.28 | 540 | 543 | 125.0 |
| C | 0 | 10 | 7028 | 51.89 | 540 | 543 | 125.0 |
| D | 12 | 235 | 5101555 | 43452.89 | 484 | 471 | 117.4 |
| D | 2 | 249 | 95259 | 807.44 | 484 | 471 | 117.4 |
| D | 12 | 227 | 83376 | 706.21 | 484 | 471 | 117.4 |
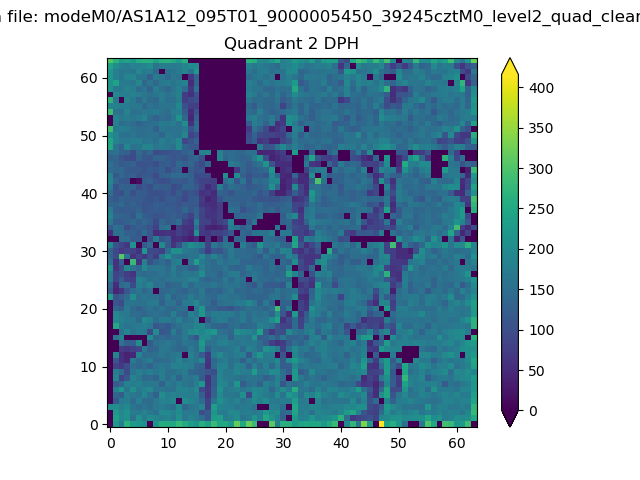
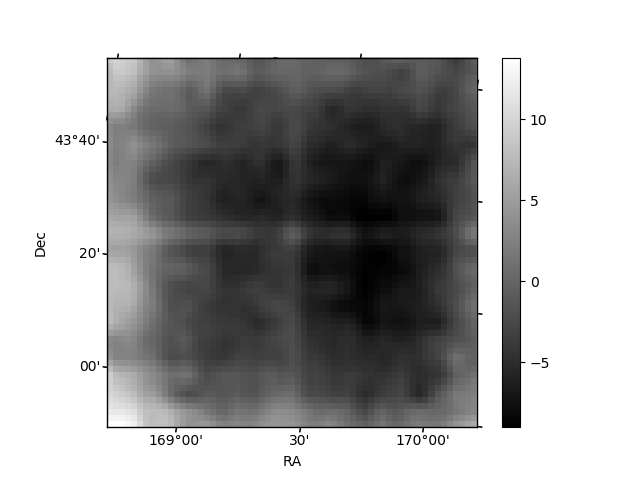
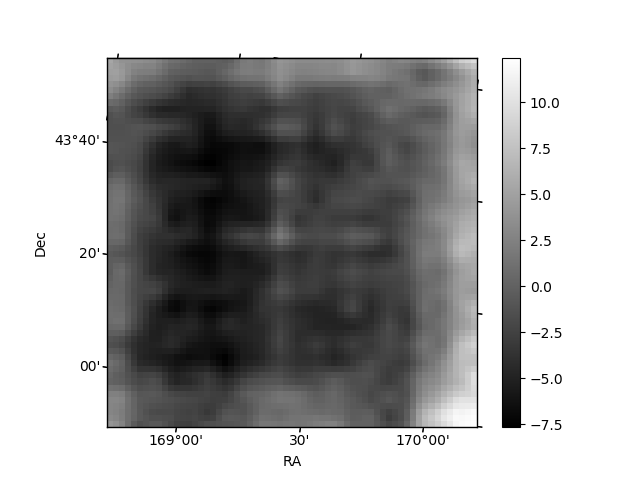
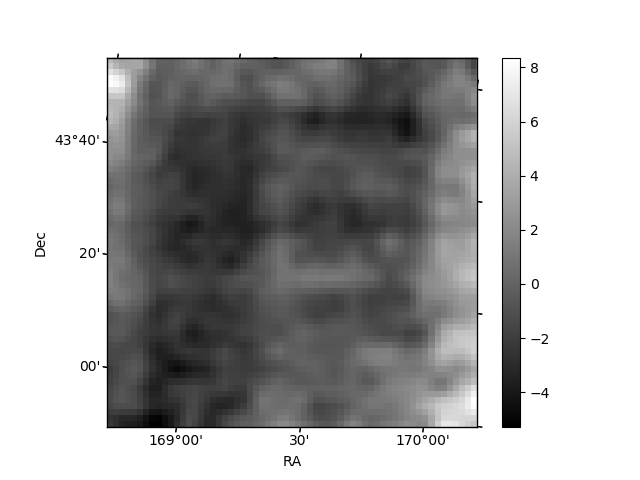
Histogram calculated using DETX and DETY for each event in the final _common_clean file
| Quadrant A | 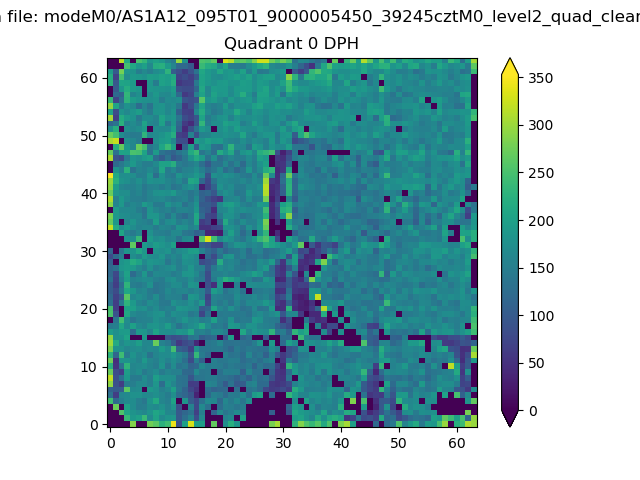 |
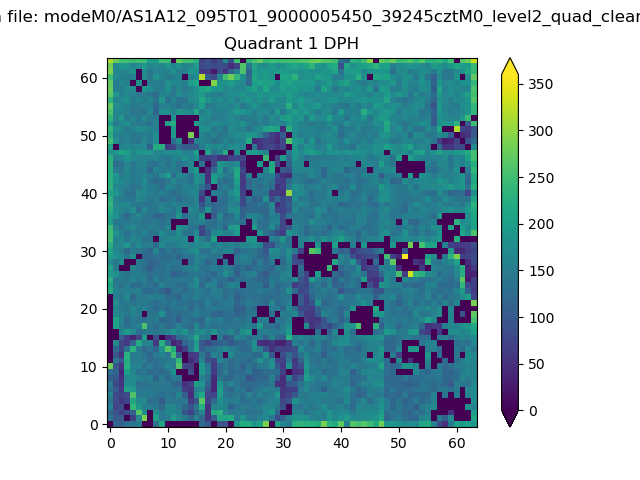 |
Quadrant B |
|---|---|---|---|
| Quadrant D | 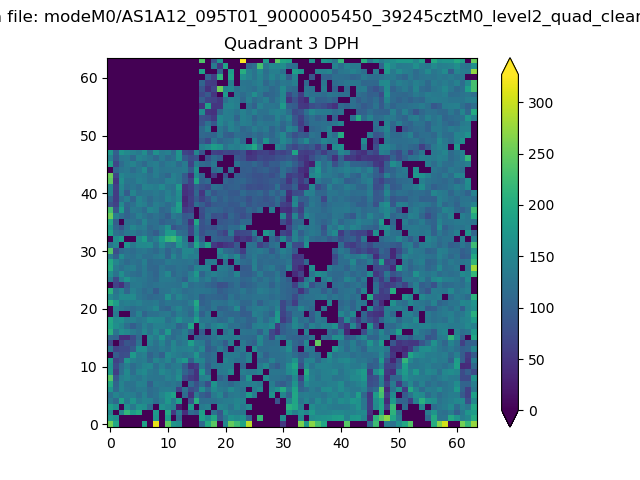 |
 |
Quadrant C |
| Plot type | Count rate plots | Images |
|---|---|---|
| Comparison with Poisson distribution Blue bars denote a histogram of data divided into 1 sec bins. Red curve is a Poisson curve with rate = median count rate of data. |
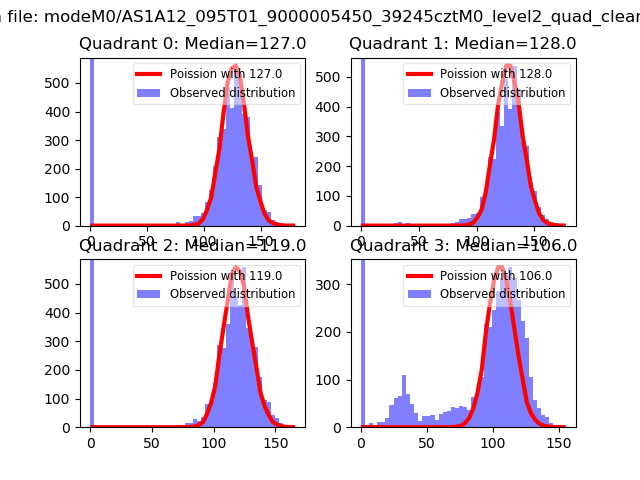 |
 |
| Quadrant-wise count rates Data is divided into 100 sec bins |
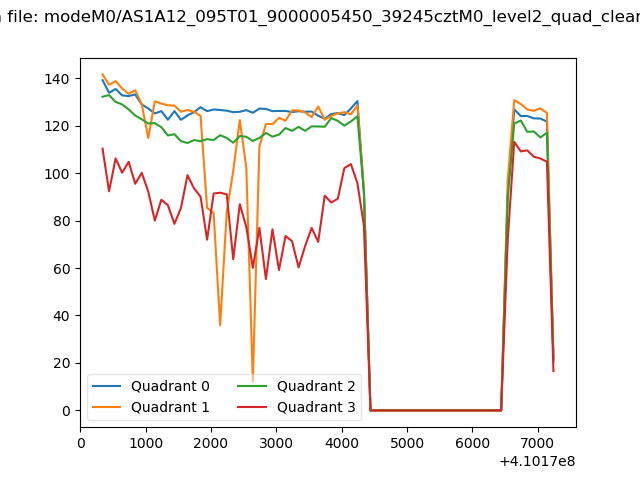 |
|
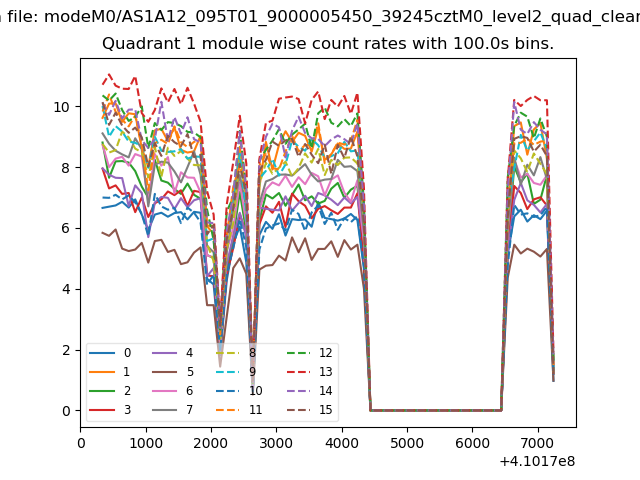
| Module-wise count rates for Quadrant A Data is divided into 100 sec bins |
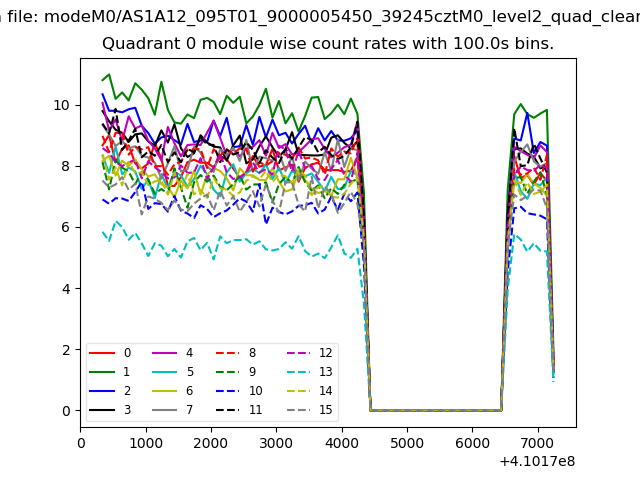 |
 |
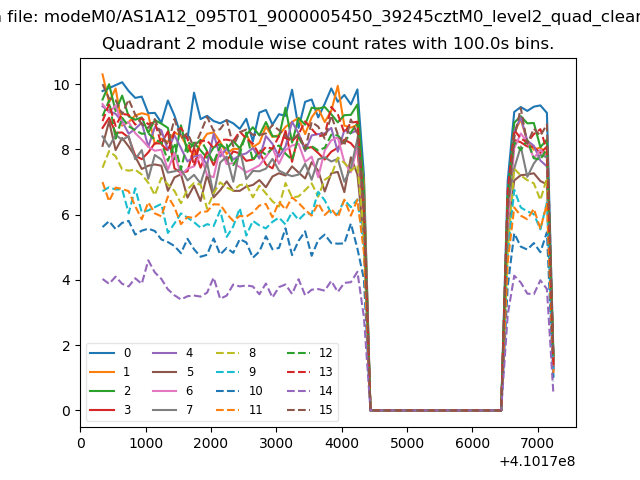
| Module-wise count rates for Quadrant B Data is divided into 100 sec bins |
 |
 |
| Module-wise count rates for Quadrant C Data is divided into 100 sec bins |
 |
 |
| Module-wise count rates for Quadrant D Data is divided into 100 sec bins |
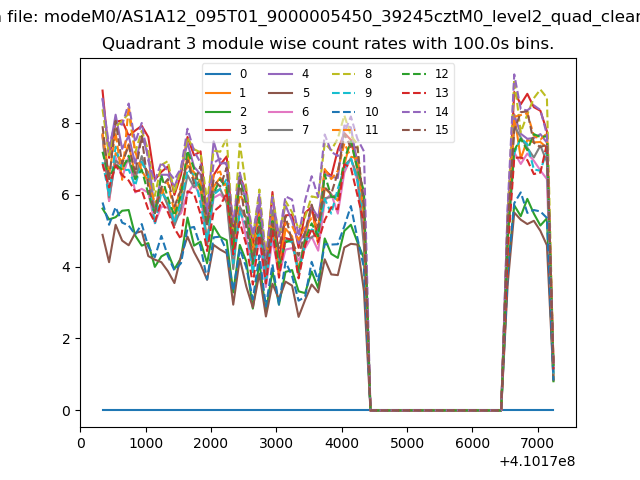 |
 |
| Parameter | Plot |
|---|---|
| CZT HV Monitor | 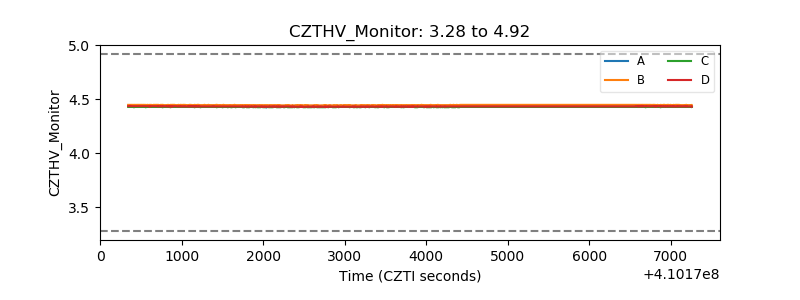 |
| D_VDD | 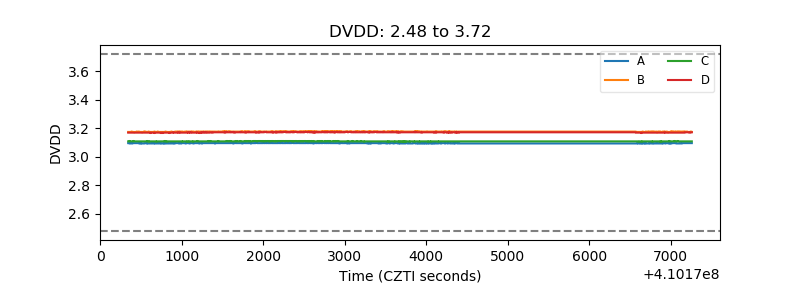 |
| Temperature 1 | 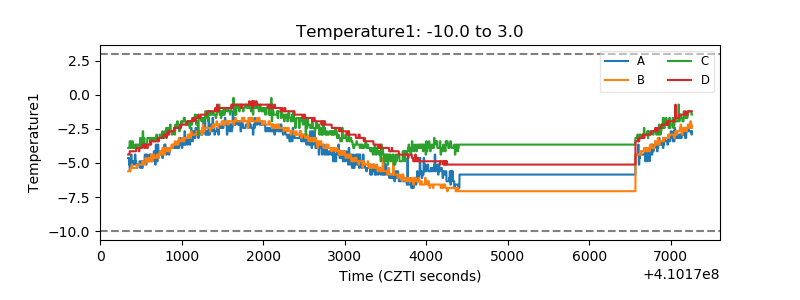 |
| Veto HV Monitor | 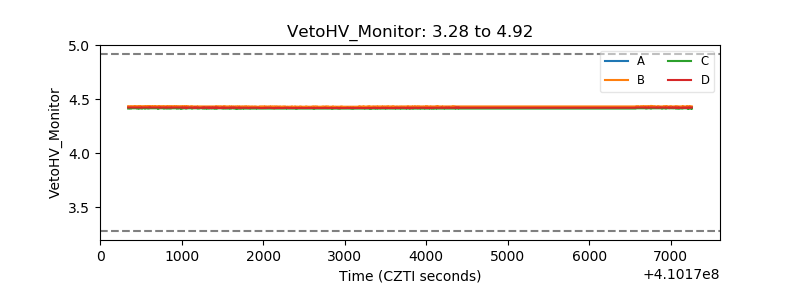 |
| Veto LLD | 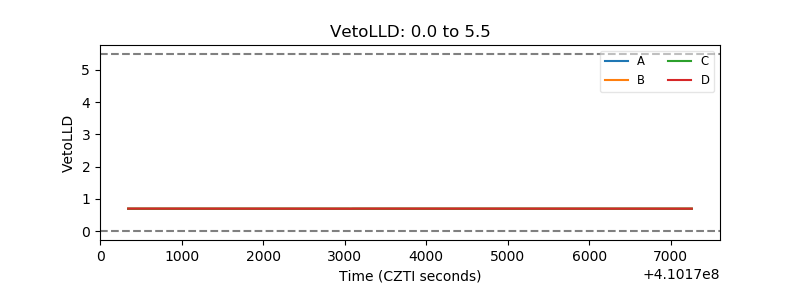 |
| Alpha Counter | 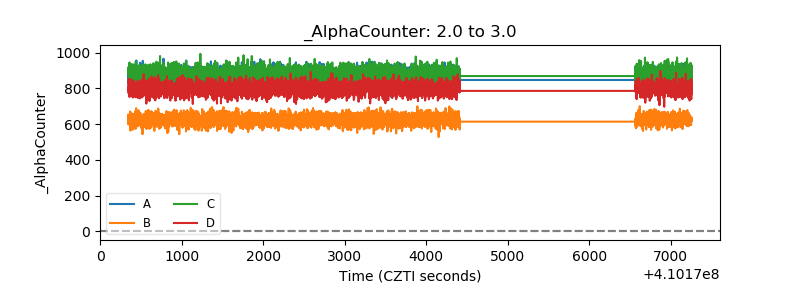 |
| _CPM_Rate |  |
| CZT Counter | 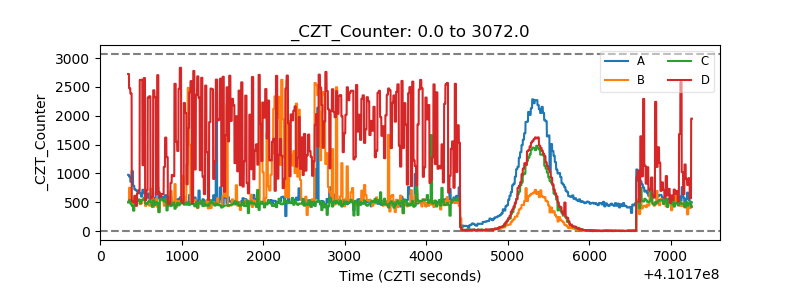 |
| +2.5 Volts monitor | 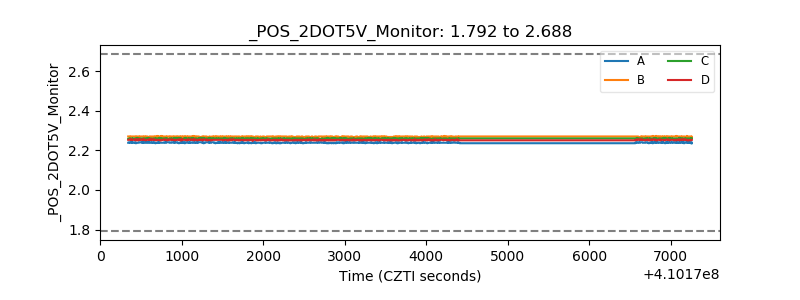 |
| +5 Volts monitor | 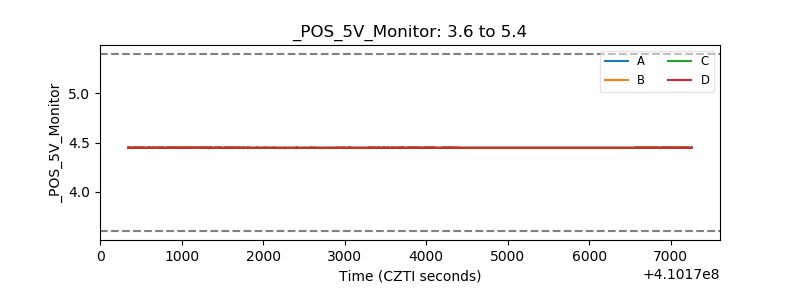 |
| _ROLL_ROT | 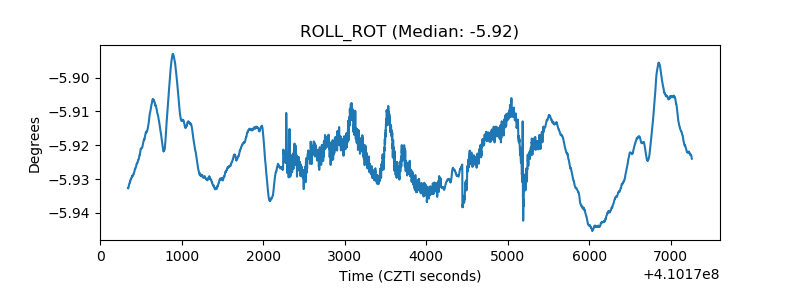 |
| _Roll_DEC | 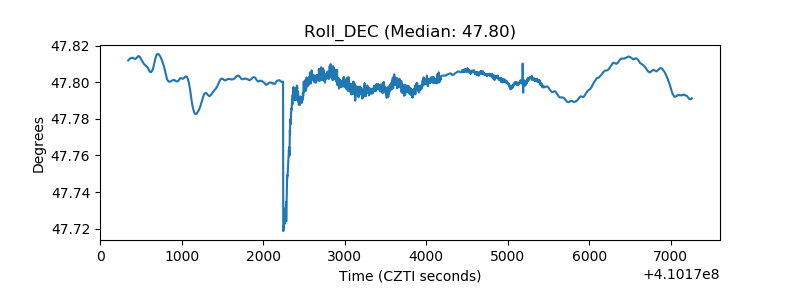 |
| _Roll_RA |  |
| Veto Counter | 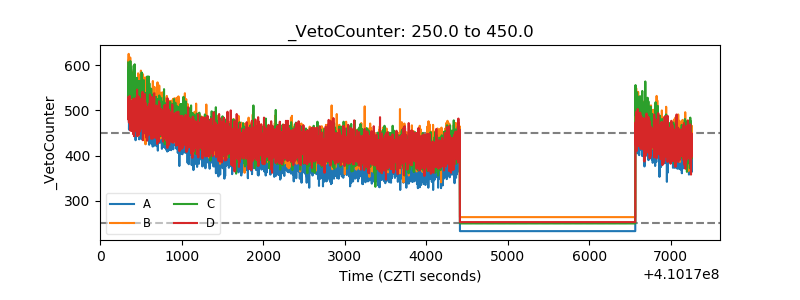 |