| Param | Original file | Final file |
|---|---|---|
| Filename | modeM0/AS1A12_095T01_9000005450_39246cztM0_level2.fits | modeM0/AS1A12_095T01_9000005450_39246cztM0_level2_quad_clean.evt |
| Size (bytes) | 446,492,160 | 80,138,880 |
| Size | 425.8 MB | 76.4 MB |
| Events in quadrant A | 2,858,881 | 584,980 |
| Events in quadrant B | 2,740,313 | 587,245 |
| Events in quadrant C | 2,334,049 | 553,458 |
| Events in quadrant D | 8,213,967 | 357,751 |
| Mode M9 | |||
|---|---|---|---|
| Quadrant | BADHDUFLAG | Total packets | Discarded packets |
| A | 0 | 28 | 0 |
| B | 0 | 28 | 0 |
| C | 0 | 28 | 0 |
| D | 0 | 29 | 0 |
| Mode M0 | |||
|---|---|---|---|
| Quadrant | BADHDUFLAG | Total packets | Discarded packets |
| A | 0 | 11424 | 3 |
| B | 0 | 11246 | 2 |
| C | 0 | 9859 | 2 |
| D | 0 | 27819 | 2 |
| Mode SS | |||
|---|---|---|---|
| Quadrant | BADHDUFLAG | Total packets | Discarded packets |
| A | 0 | 100 | 0 |
| B | 0 | 100 | 0 |
| C | 0 | 100 | 0 |
| D | 0 | 100 | 0 |
| Quadrant | Total seconds | Saturated seconds | Saturation percentage |
|---|---|---|---|
| A | 4889 | 71 | 1.452240% |
| B | 4889 | 95 | 1.943138% |
| C | 4889 | 6 | 0.122724% |
| D | 4889 | 1978 | 40.458171% |
Noise dominated data is calculated using 1-second bins in cleaned event files. If a bin has >2000 counts, and if more than 50% of those come from <1% of pixels, then it is considered to be noise-dominated and hence unusable.
| Quadrant | # 1 sec bins | Bins with >0 counts | Bins with >2000 counts | High rate bins dominated by noise | Noise dominated (total time) | Noise dominated (detector-on time) | Marked lightcurve |
|---|---|---|---|---|---|---|---|
| A | 6952 | 4890 | 47 | 47 | 0.68% | 0.96% | 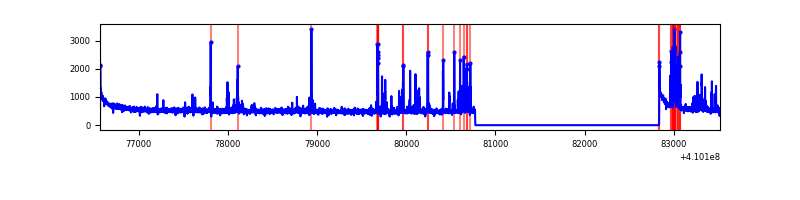 |
| B | 6952 | 4890 | 73 | 73 | 1.05% | 1.49% | 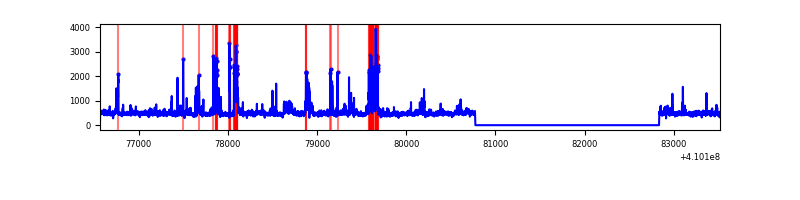 |
| C | 6952 | 4890 | 1 | 1 | 0.01% | 0.02% | 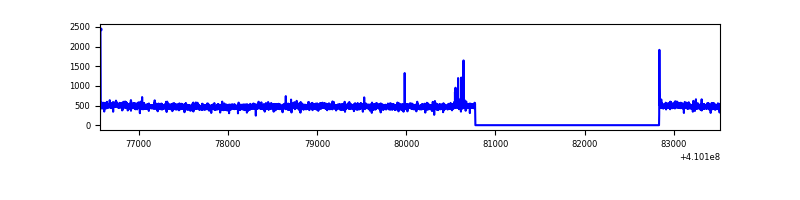 |
| D | 6952 | 4890 | 1601 | 1601 | 23.03% | 32.74% | 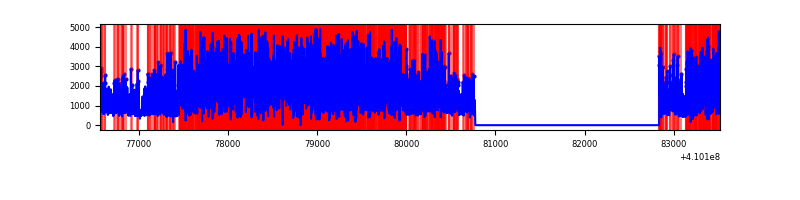 |
Top three noisy pixels from each quadrant. If the there are fewer than three noisy pixels in the level2.evt file, extra rows are filled as -1
| Pixel properties | Quadrant properties | ||||||
|---|---|---|---|---|---|---|---|
| Quadrant | DetID | PixID | Counts | Sigma | Mean | Median | Sigma |
| A | 10 | 83 | 407472 | 3624.39 | 558 | 547 | 112.3 |
| A | 13 | 248 | 272533 | 2422.52 | 558 | 547 | 112.3 |
| A | 15 | 174 | 16272 | 140.06 | 558 | 547 | 112.3 |
| B | 5 | 172 | 432654 | 4136.3 | 548 | 534 | 104.5 |
| B | 0 | 190 | 74349 | 706.56 | 548 | 534 | 104.5 |
| B | 5 | 255 | 49261 | 466.42 | 548 | 534 | 104.5 |
| C | 15 | 214 | 209934 | 1664.62 | 539 | 540 | 125.8 |
| C | 0 | 10 | 11828 | 89.73 | 539 | 540 | 125.8 |
| C | 15 | 159 | 10342 | 77.92 | 539 | 540 | 125.8 |
| D | 12 | 235 | 5951702 | 52900.83 | 458 | 446 | 112.5 |
| D | 5 | 222 | 162605 | 1441.43 | 458 | 446 | 112.5 |
| D | 12 | 233 | 81920 | 724.22 | 458 | 446 | 112.5 |
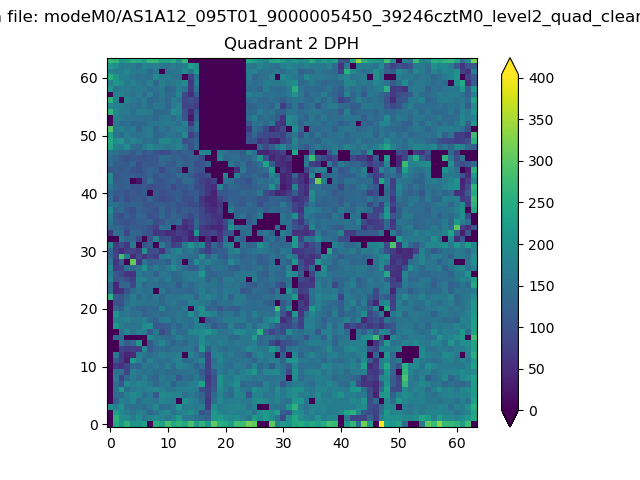
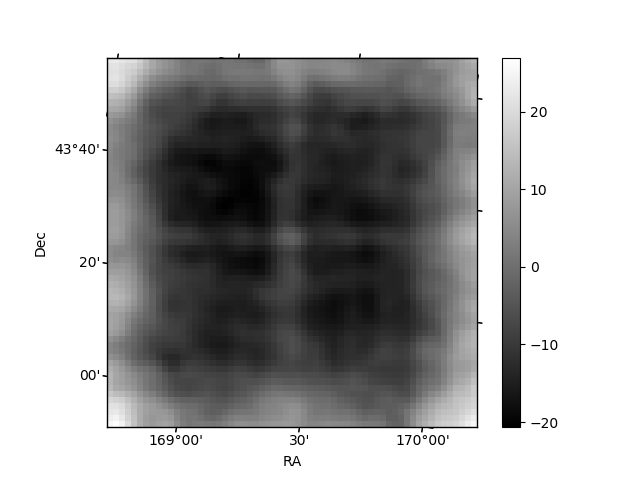
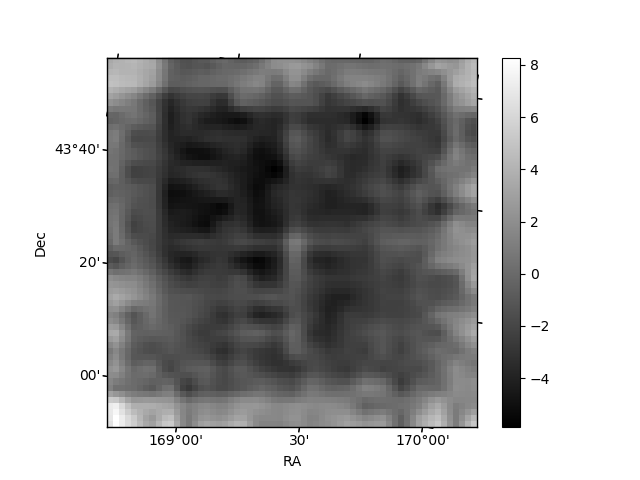
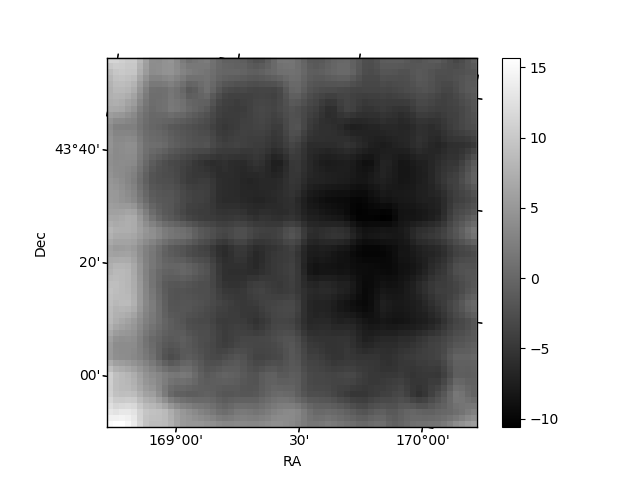
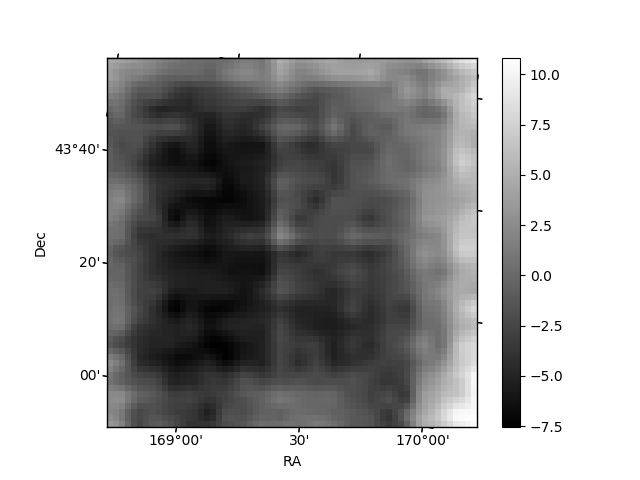
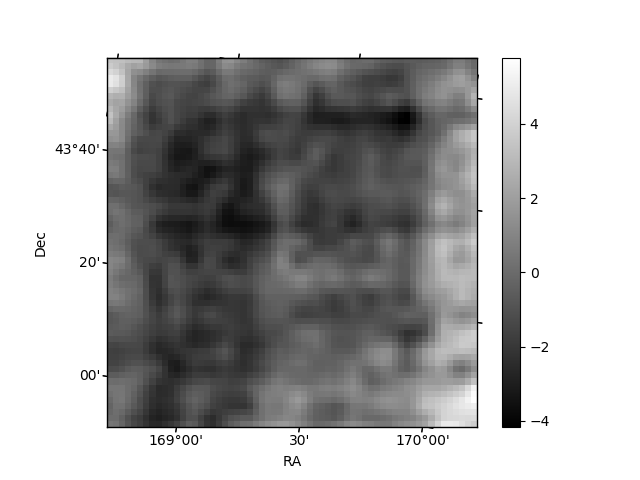
Histogram calculated using DETX and DETY for each event in the final _common_clean file
| Quadrant A | 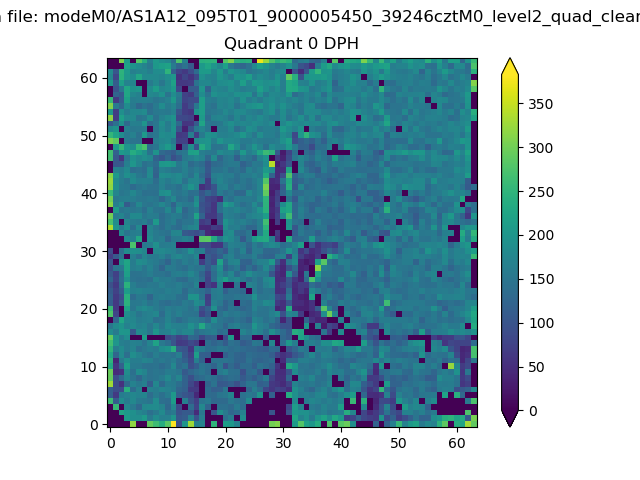 |
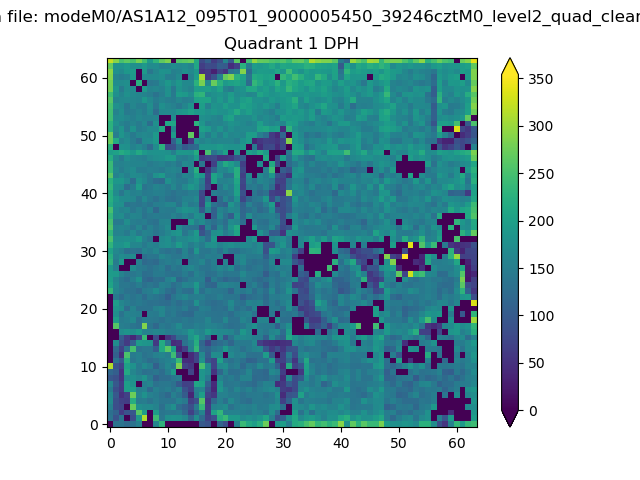 |
Quadrant B |
|---|---|---|---|
| Quadrant D | 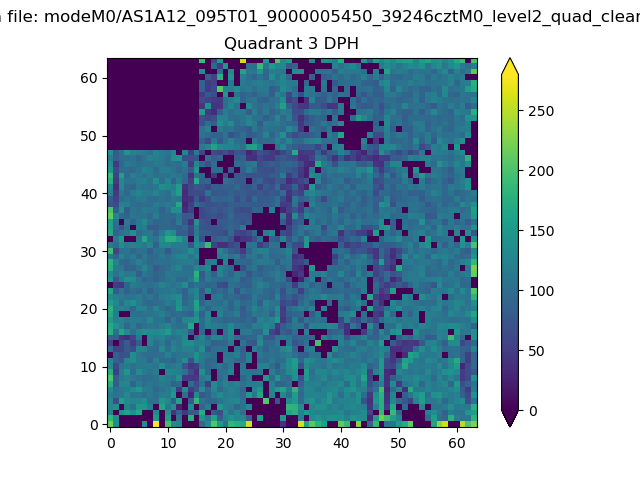 |
 |
Quadrant C |
| Plot type | Count rate plots | Images |
|---|---|---|
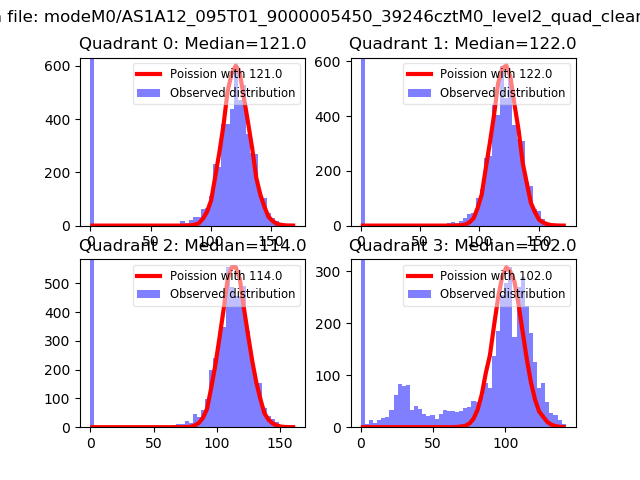
| Comparison with Poisson distribution Blue bars denote a histogram of data divided into 1 sec bins. Red curve is a Poisson curve with rate = median count rate of data. |
 |
 |
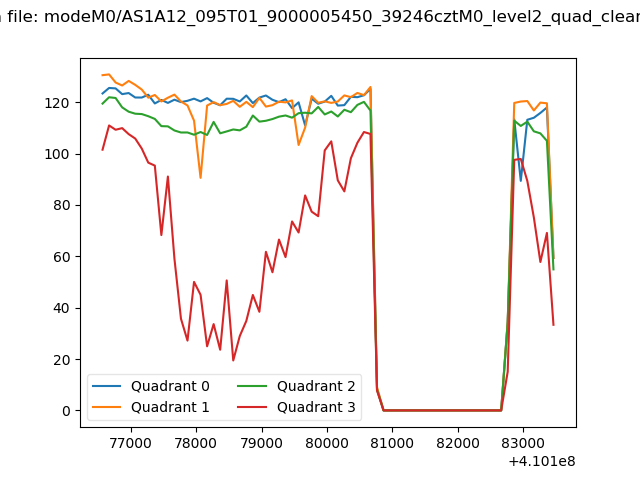
| Quadrant-wise count rates Data is divided into 100 sec bins |
 |
|
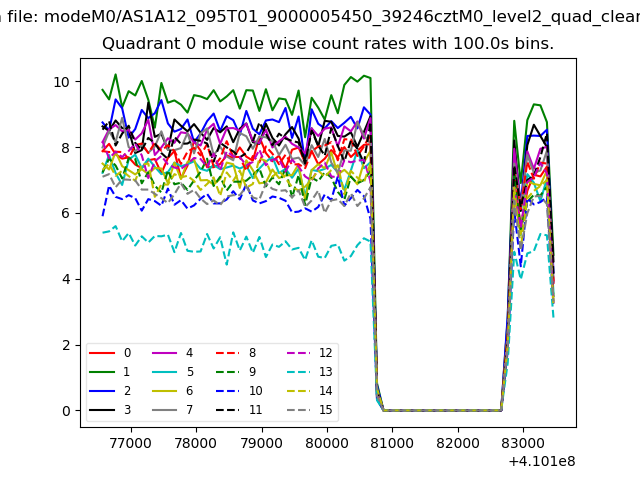
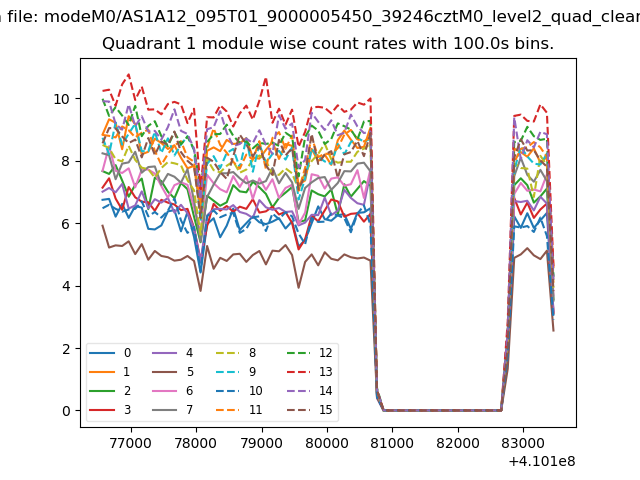
| Module-wise count rates for Quadrant A Data is divided into 100 sec bins |
 |
 |
| Module-wise count rates for Quadrant B Data is divided into 100 sec bins |
 |
 |
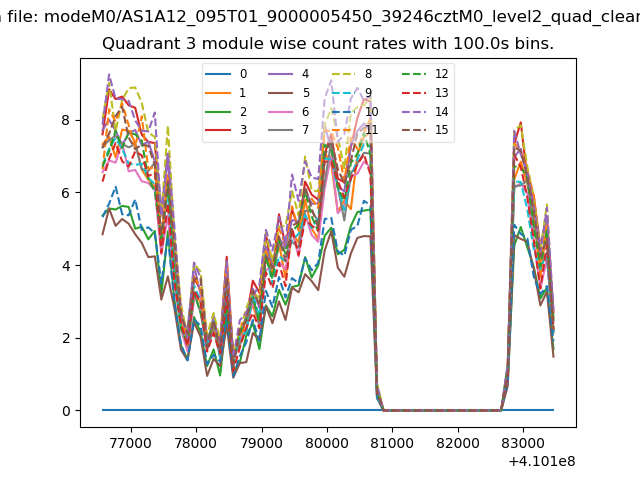
| Module-wise count rates for Quadrant C Data is divided into 100 sec bins |
 |
 |
| Module-wise count rates for Quadrant D Data is divided into 100 sec bins |
 |
 |
| Parameter | Plot |
|---|---|
| CZT HV Monitor |  |
| D_VDD |  |
| Temperature 1 | 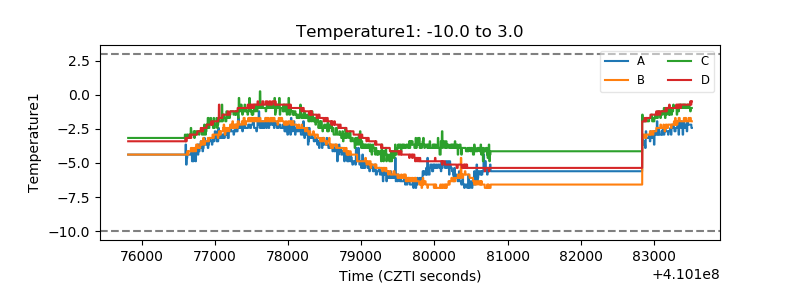 |
| Veto HV Monitor | 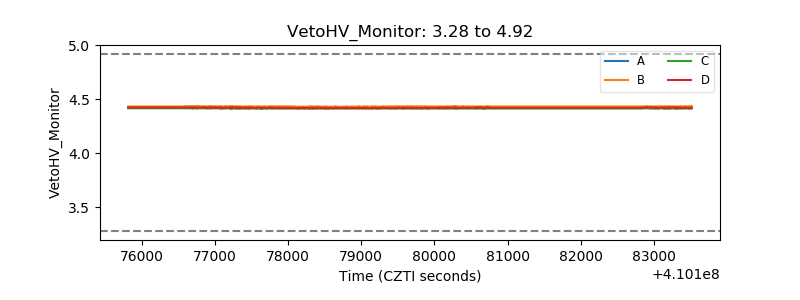 |
| Veto LLD | 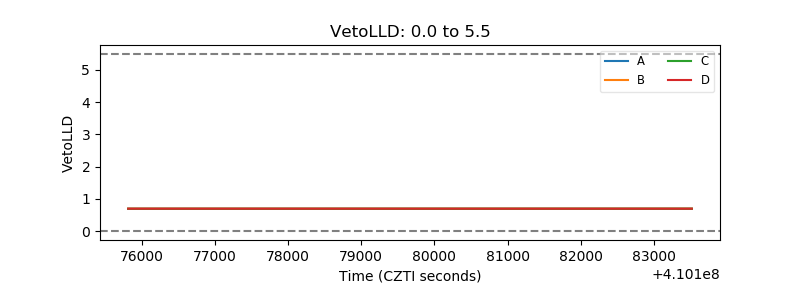 |
| Alpha Counter | 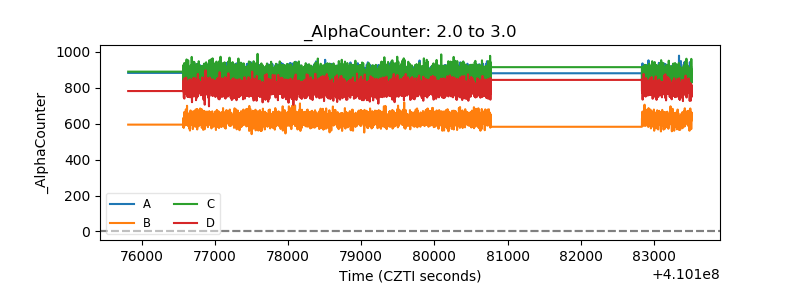 |
| _CPM_Rate | 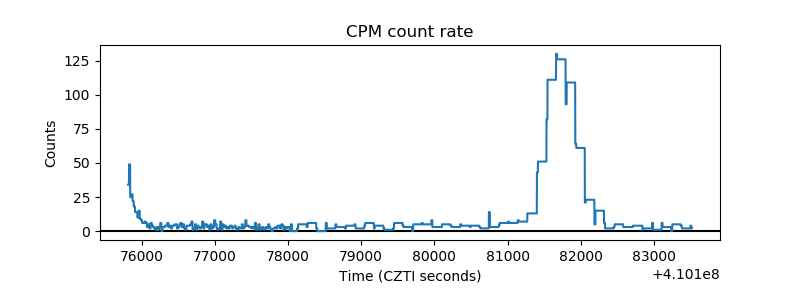 |
| CZT Counter | 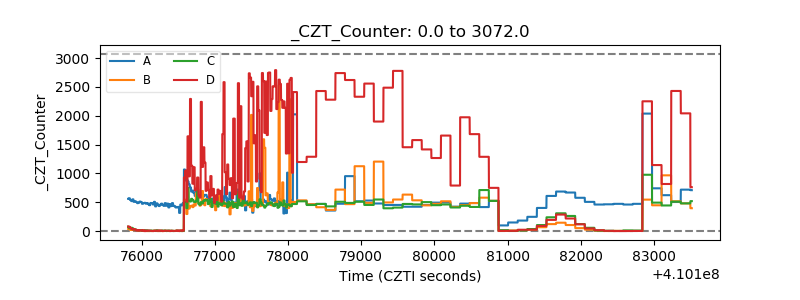 |
| +2.5 Volts monitor | 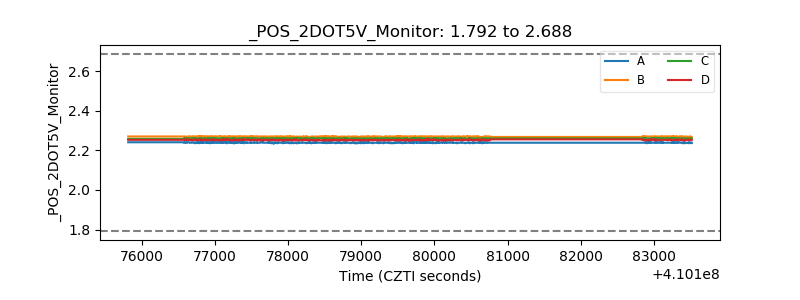 |
| +5 Volts monitor | 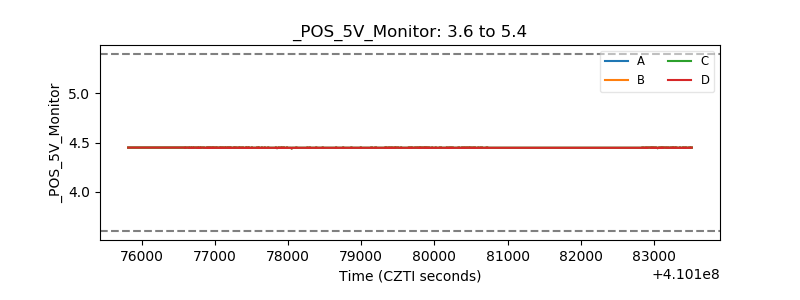 |
| _ROLL_ROT | 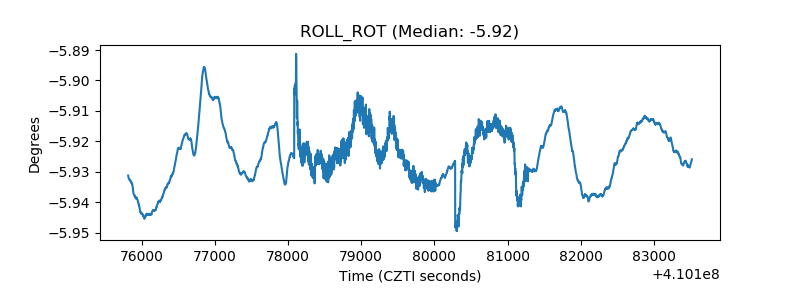 |
| _Roll_DEC | 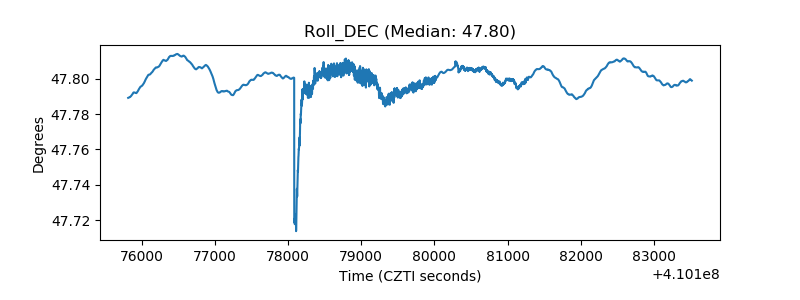 |
| _Roll_RA | 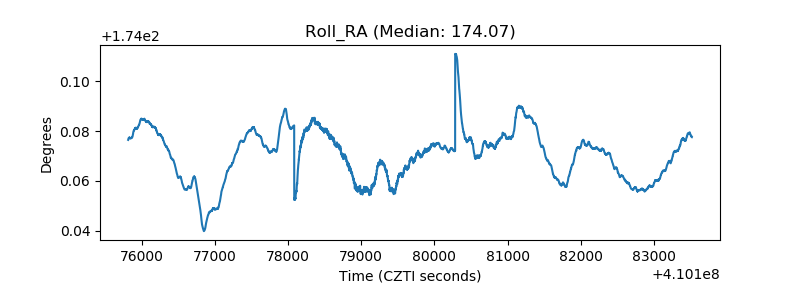 |
| Veto Counter | 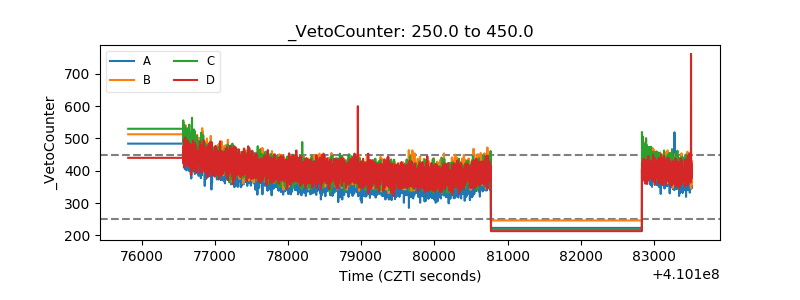 |