| Param | Original file | Final file |
|---|---|---|
| Filename | modeM0/AS1A12_095T01_9000005450_39247cztM0_level2.fits | modeM0/AS1A12_095T01_9000005450_39247cztM0_level2_quad_clean.evt |
| Size (bytes) | 279,725,760 | 50,535,360 |
| Size | 266.8 MB | 48.2 MB |
| Events in quadrant A | 1,869,396 | 361,844 |
| Events in quadrant B | 1,630,462 | 369,098 |
| Events in quadrant C | 1,486,643 | 345,015 |
| Events in quadrant D | 5,118,984 | 228,028 |
| Mode M9 | |||
|---|---|---|---|
| Quadrant | BADHDUFLAG | Total packets | Discarded packets |
| A | 0 | 5 | 0 |
| B | 0 | 5 | 0 |
| C | 0 | 5 | 0 |
| D | 0 | 6 | 0 |
| Mode M0 | |||
|---|---|---|---|
| Quadrant | BADHDUFLAG | Total packets | Discarded packets |
| A | 0 | 7532 | 1 |
| B | 0 | 6963 | 1 |
| C | 0 | 6395 | 1 |
| D | 0 | 17407 | 1 |
| Mode SS | |||
|---|---|---|---|
| Quadrant | BADHDUFLAG | Total packets | Discarded packets |
| A | 0 | 64 | 0 |
| B | 0 | 64 | 0 |
| C | 0 | 64 | 0 |
| D | 0 | 64 | 0 |
| Quadrant | Total seconds | Saturated seconds | Saturation percentage |
|---|---|---|---|
| A | 3180 | 73 | 2.295597% |
| B | 3180 | 19 | 0.597484% |
| C | 3180 | 2 | 0.062893% |
| D | 3180 | 1245 | 39.150943% |
Noise dominated data is calculated using 1-second bins in cleaned event files. If a bin has >2000 counts, and if more than 50% of those come from <1% of pixels, then it is considered to be noise-dominated and hence unusable.
| Quadrant | # 1 sec bins | Bins with >0 counts | Bins with >2000 counts | High rate bins dominated by noise | Noise dominated (total time) | Noise dominated (detector-on time) | Marked lightcurve |
|---|---|---|---|---|---|---|---|
| A | 3180 | 3180 | 57 | 57 | 1.79% | 1.79% | 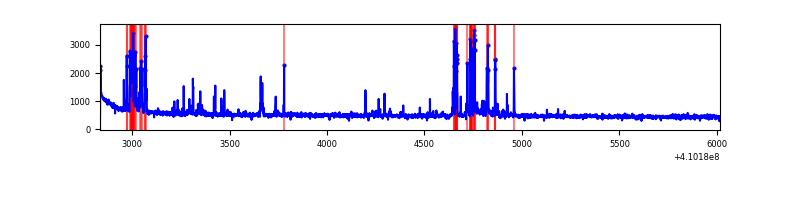 |
| B | 3180 | 3180 | 15 | 15 | 0.47% | 0.47% | 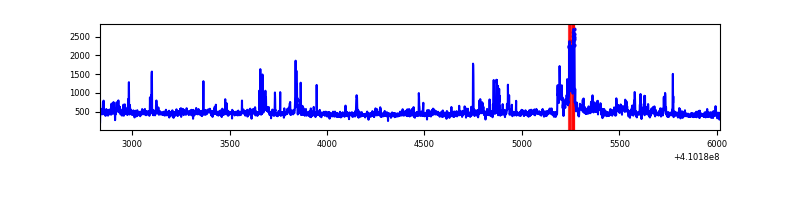 |
| C | 3180 | 3180 | 0 | 0 | 0.00% | 0.00% | 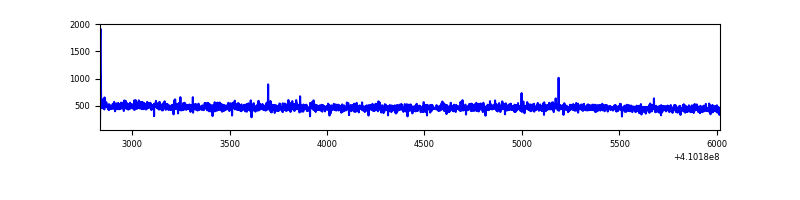 |
| D | 3180 | 3179 | 974 | 974 | 30.63% | 30.64% | 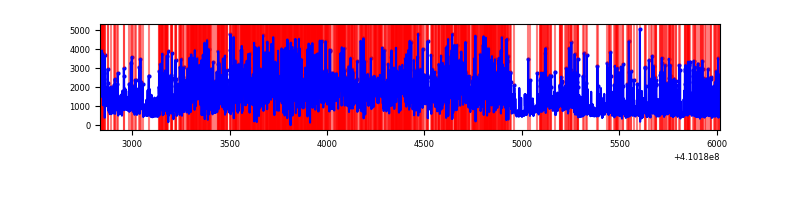 |
Top three noisy pixels from each quadrant. If the there are fewer than three noisy pixels in the level2.evt file, extra rows are filled as -1
| Pixel properties | Quadrant properties | ||||||
|---|---|---|---|---|---|---|---|
| Quadrant | DetID | PixID | Counts | Sigma | Mean | Median | Sigma |
| A | 13 | 248 | 267110 | 3677.92 | 349 | 342 | 72.5 |
| A | 10 | 83 | 246896 | 3399.23 | 349 | 342 | 72.5 |
| A | 13 | 254 | 4008 | 50.54 | 349 | 342 | 72.5 |
| B | 5 | 172 | 113623 | 1670.96 | 348 | 340 | 67.8 |
| B | 0 | 190 | 100892 | 1483.17 | 348 | 340 | 67.8 |
| B | 5 | 255 | 29950 | 436.76 | 348 | 340 | 67.8 |
| C | 15 | 214 | 142059 | 1751.23 | 343 | 343 | 80.9 |
| C | 0 | 10 | 5204 | 60.07 | 343 | 343 | 80.9 |
| C | 13 | 61 | 2370 | 25.05 | 343 | 343 | 80.9 |
| D | 12 | 235 | 3450706 | 47527.71 | 291 | 282 | 72.6 |
| D | 5 | 222 | 289746 | 3987.21 | 291 | 282 | 72.6 |
| D | 2 | 249 | 66456 | 911.51 | 291 | 282 | 72.6 |
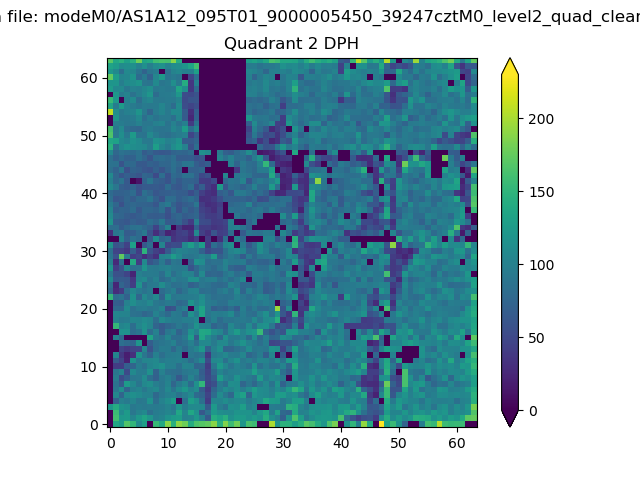
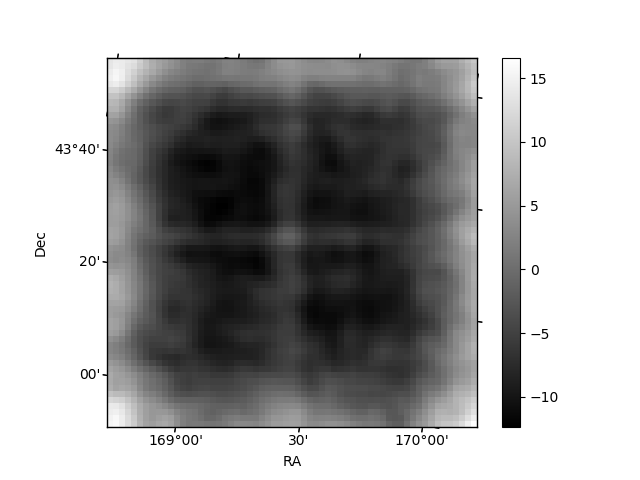
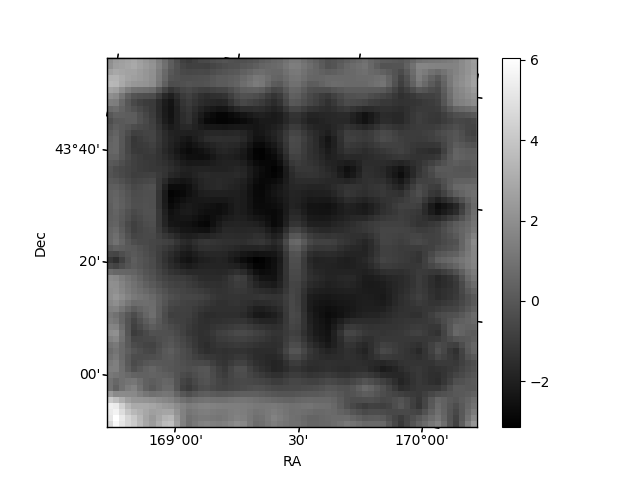
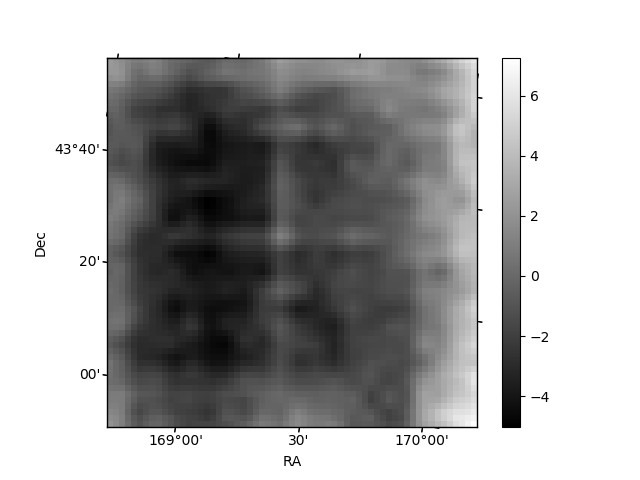
Histogram calculated using DETX and DETY for each event in the final _common_clean file
| Quadrant A | 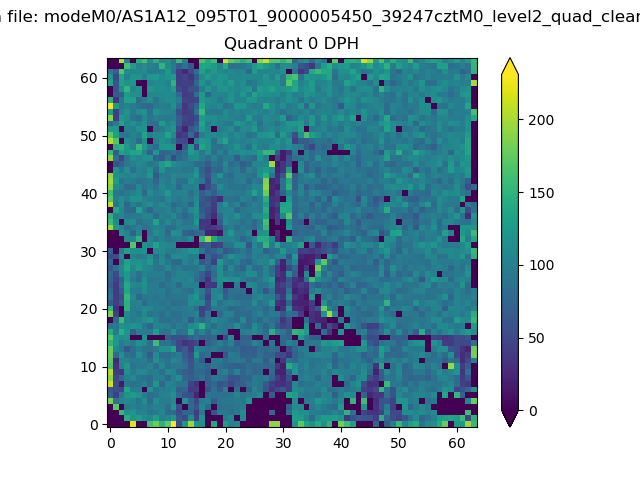 |
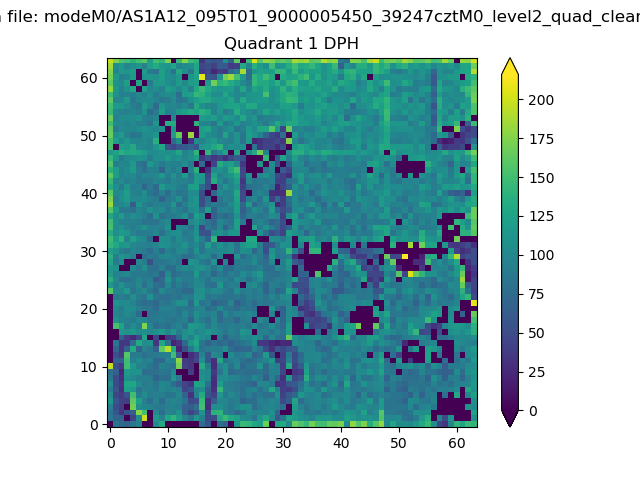 |
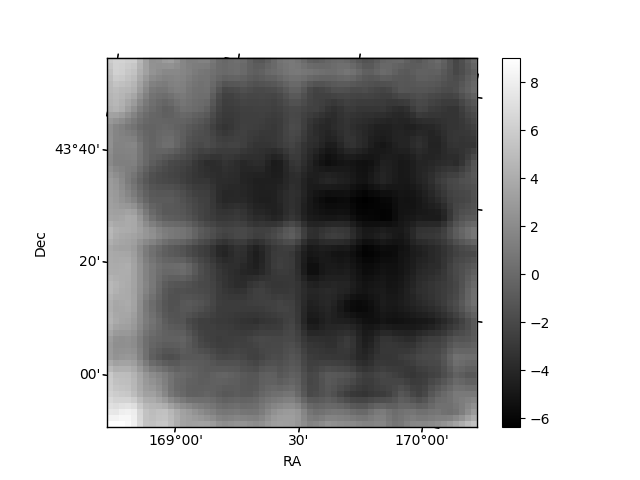
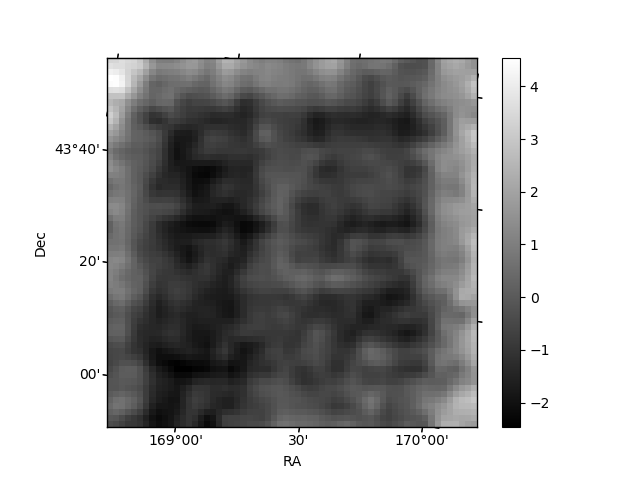
Quadrant B |
|---|---|---|---|
| Quadrant D | 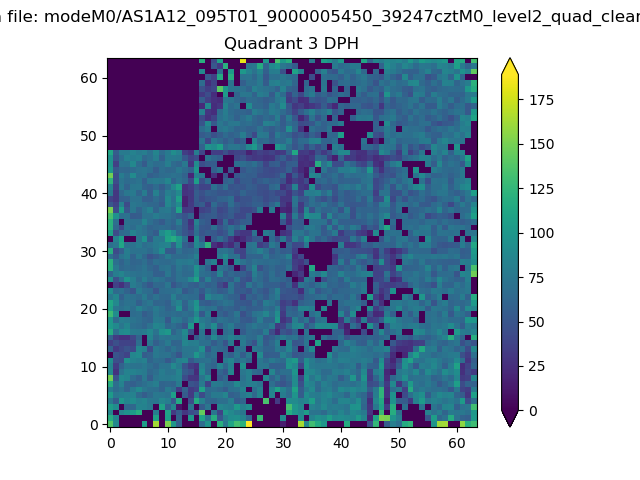 |
 |
Quadrant C |
| Plot type | Count rate plots | Images |
|---|---|---|
| Comparison with Poisson distribution Blue bars denote a histogram of data divided into 1 sec bins. Red curve is a Poisson curve with rate = median count rate of data. |
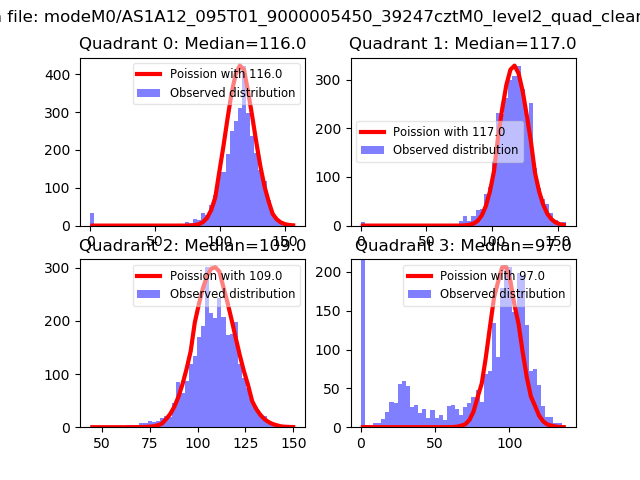 |
 |
| Quadrant-wise count rates Data is divided into 100 sec bins |
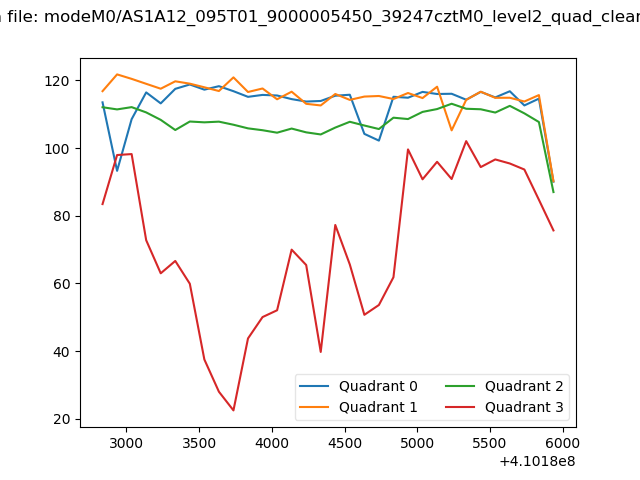 |
|
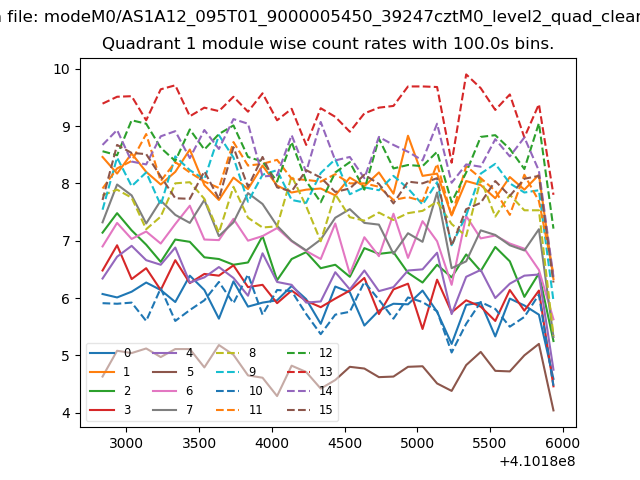
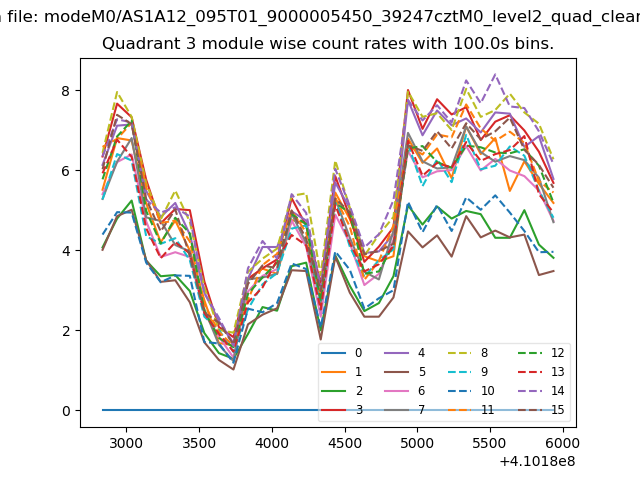
| Module-wise count rates for Quadrant A Data is divided into 100 sec bins |
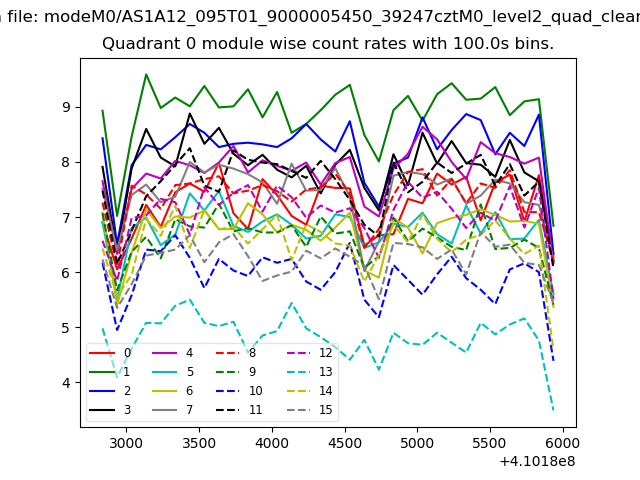 |
 |
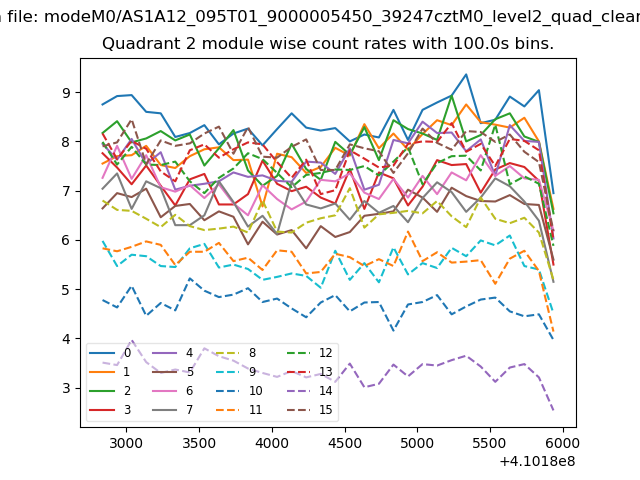
| Module-wise count rates for Quadrant B Data is divided into 100 sec bins |
 |
 |
| Module-wise count rates for Quadrant C Data is divided into 100 sec bins |
 |
 |
| Module-wise count rates for Quadrant D Data is divided into 100 sec bins |
 |
 |
| Parameter | Plot |
|---|---|
| CZT HV Monitor | 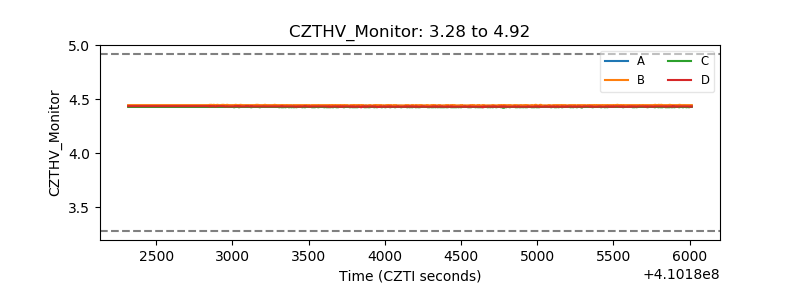 |
| D_VDD | 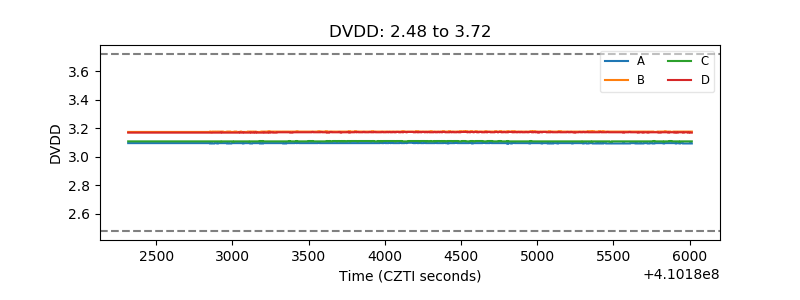 |
| Temperature 1 | 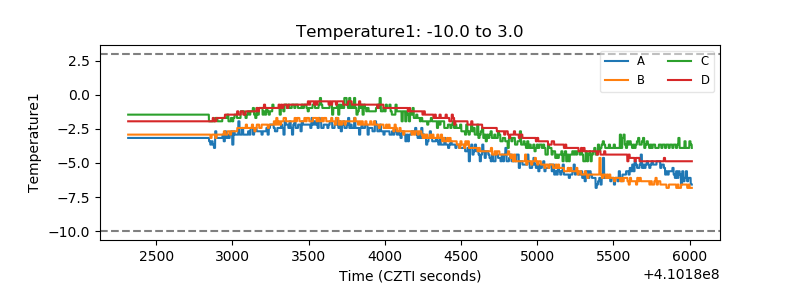 |
| Veto HV Monitor | 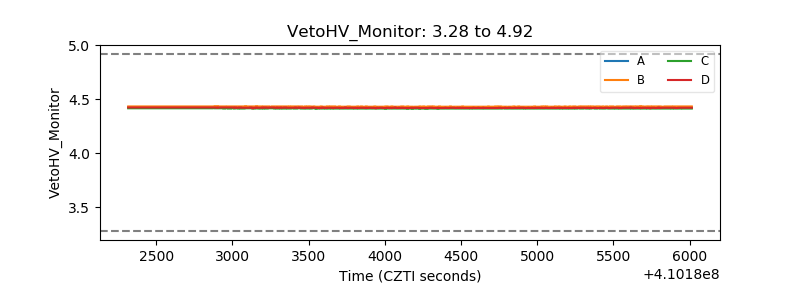 |
| Veto LLD | 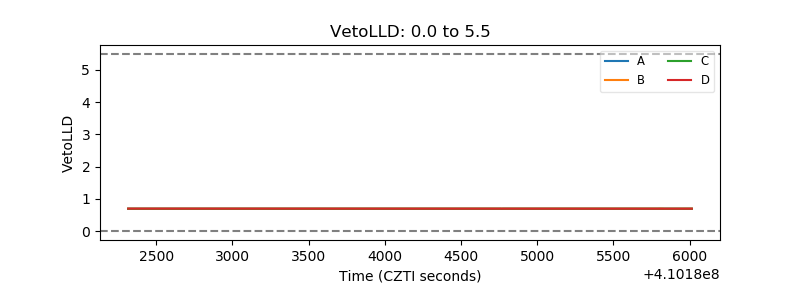 |
| Alpha Counter | 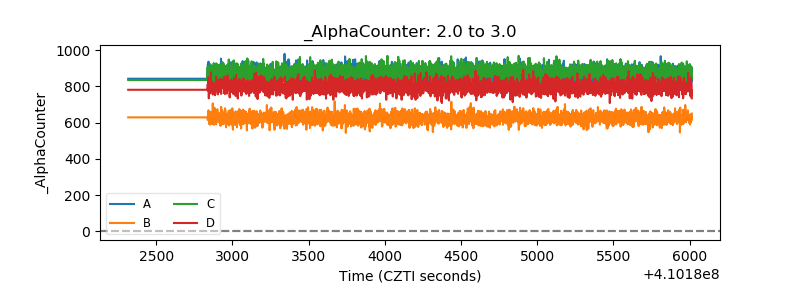 |
| _CPM_Rate | 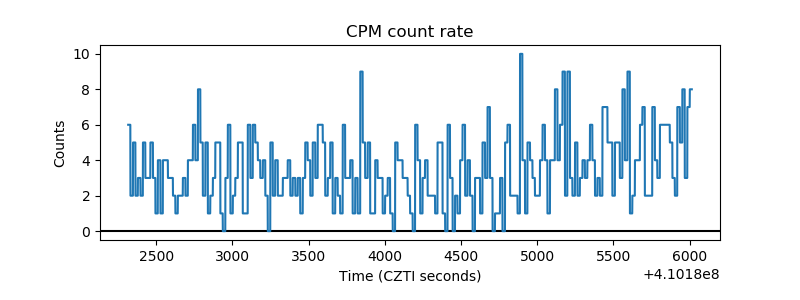 |
| CZT Counter | 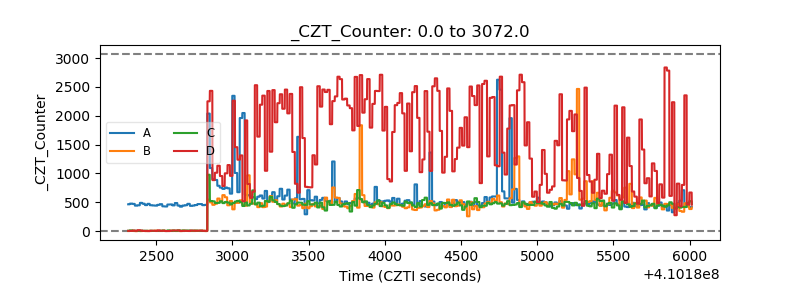 |
| +2.5 Volts monitor |  |
| +5 Volts monitor | 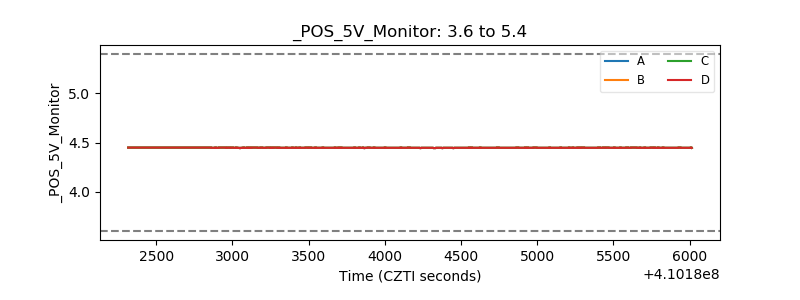 |
| _ROLL_ROT | 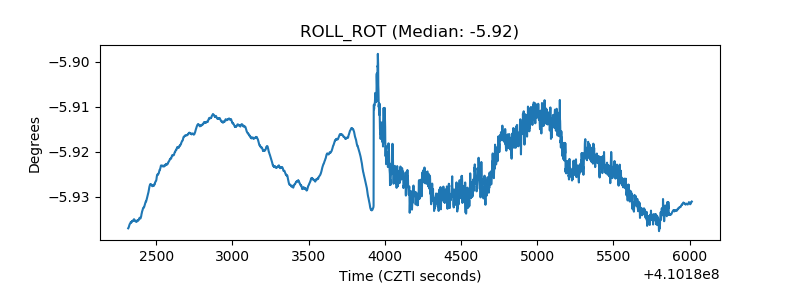 |
| _Roll_DEC | 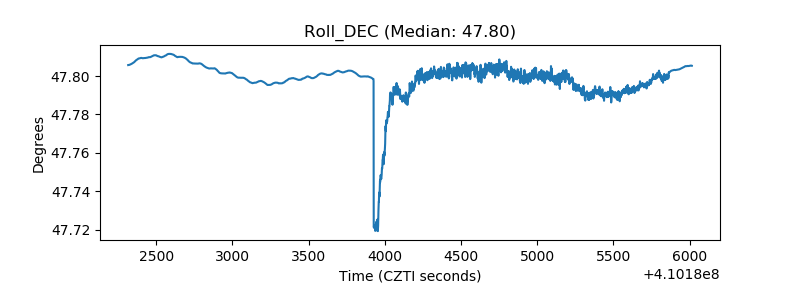 |
| _Roll_RA | 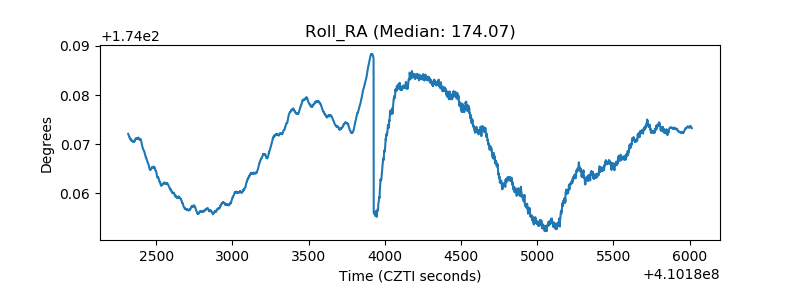 |
| Veto Counter | 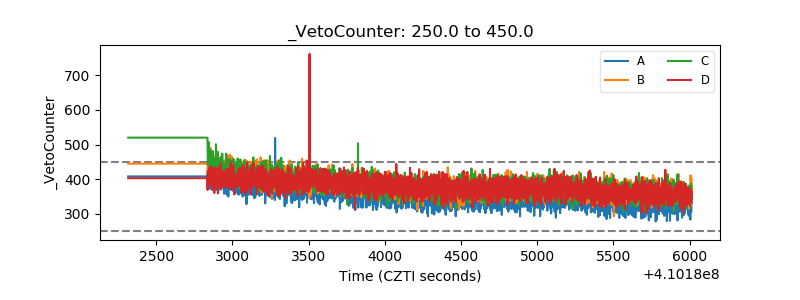 |