| Param | Original file | Final file |
|---|---|---|
| Filename | modeM0/AS1A12_095T01_9000005450_39249cztM0_level2.fits | modeM0/AS1A12_095T01_9000005450_39249cztM0_level2_quad_clean.evt |
| Size (bytes) | 652,803,840 | 116,686,080 |
| Size | 622.6 MB | 111.3 MB |
| Events in quadrant A | 4,070,829 | 853,901 |
| Events in quadrant B | 3,964,556 | 855,869 |
| Events in quadrant C | 3,410,449 | 806,235 |
| Events in quadrant D | 12,156,410 | 512,076 |
| Mode M9 | |||
|---|---|---|---|
| Quadrant | BADHDUFLAG | Total packets | Discarded packets |
| A | 0 | 21 | 0 |
| B | 0 | 21 | 0 |
| C | 0 | 21 | 0 |
| D | 0 | 21 | 0 |
| Mode M0 | |||
|---|---|---|---|
| Quadrant | BADHDUFLAG | Total packets | Discarded packets |
| A | 0 | 16441 | 1 |
| B | 0 | 16496 | 1 |
| C | 0 | 14569 | 1 |
| D | 0 | 41151 | 1 |
| Mode SS | |||
|---|---|---|---|
| Quadrant | BADHDUFLAG | Total packets | Discarded packets |
| A | 0 | 148 | 0 |
| B | 0 | 148 | 0 |
| C | 0 | 148 | 0 |
| D | 0 | 148 | 0 |
| Quadrant | Total seconds | Saturated seconds | Saturation percentage |
|---|---|---|---|
| A | 7248 | 100 | 1.379691% |
| B | 7248 | 112 | 1.545254% |
| C | 7248 | 4 | 0.055188% |
| D | 7248 | 2992 | 41.280353% |
Noise dominated data is calculated using 1-second bins in cleaned event files. If a bin has >2000 counts, and if more than 50% of those come from <1% of pixels, then it is considered to be noise-dominated and hence unusable.
| Quadrant | # 1 sec bins | Bins with >0 counts | Bins with >2000 counts | High rate bins dominated by noise | Noise dominated (total time) | Noise dominated (detector-on time) | Marked lightcurve |
|---|---|---|---|---|---|---|---|
| A | 9311 | 7249 | 77 | 77 | 0.83% | 1.06% | 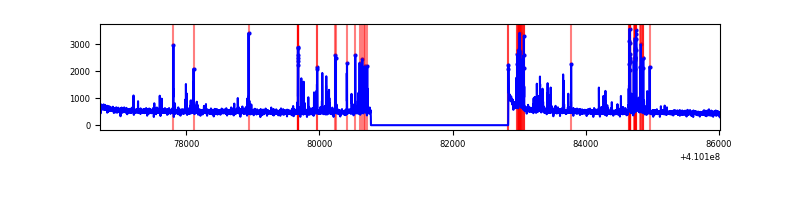 |
| B | 9311 | 7249 | 88 | 88 | 0.95% | 1.21% | 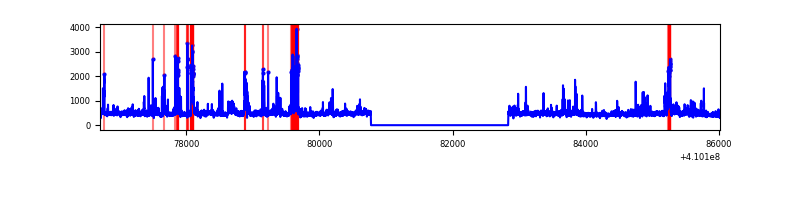 |
| C | 9311 | 7249 | 0 | 0 | 0.00% | 0.00% | 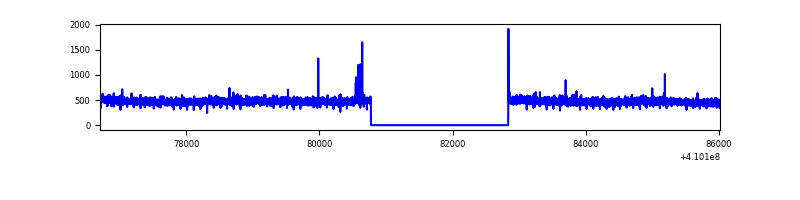 |
| D | 9311 | 7248 | 2393 | 2393 | 25.70% | 33.02% | 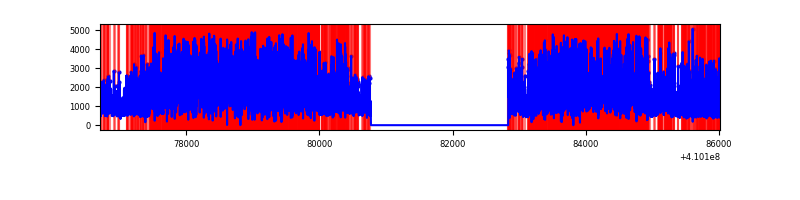 |
Top three noisy pixels from each quadrant. If the there are fewer than three noisy pixels in the level2.evt file, extra rows are filled as -1
| Pixel properties | Quadrant properties | ||||||
|---|---|---|---|---|---|---|---|
| Quadrant | DetID | PixID | Counts | Sigma | Mean | Median | Sigma |
| A | 10 | 83 | 487009 | 2970.01 | 812 | 797 | 163.7 |
| A | 13 | 248 | 425565 | 2594.68 | 812 | 797 | 163.7 |
| A | 15 | 174 | 16661 | 96.9 | 812 | 797 | 163.7 |
| B | 5 | 172 | 527335 | 3454.46 | 802 | 781 | 152.4 |
| B | 0 | 190 | 165202 | 1078.68 | 802 | 781 | 152.4 |
| B | 5 | 255 | 75694 | 491.47 | 802 | 781 | 152.4 |
| C | 15 | 214 | 309214 | 1674.81 | 791 | 794 | 184.2 |
| C | 15 | 159 | 10890 | 54.82 | 791 | 794 | 184.2 |
| C | 0 | 10 | 5707 | 26.68 | 791 | 794 | 184.2 |
| D | 12 | 235 | 8715998 | 53183.63 | 666 | 648 | 163.9 |
| D | 5 | 222 | 441528 | 2690.38 | 666 | 648 | 163.9 |
| D | 12 | 233 | 129110 | 783.91 | 666 | 648 | 163.9 |
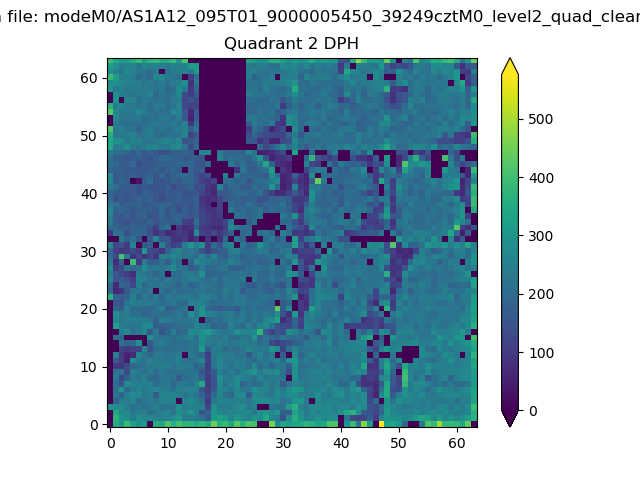
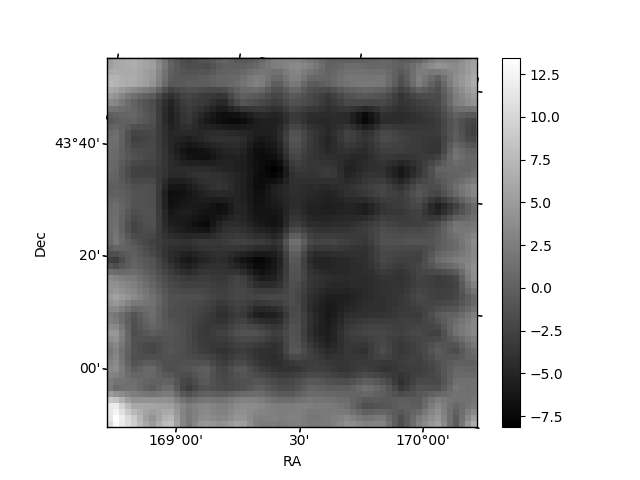
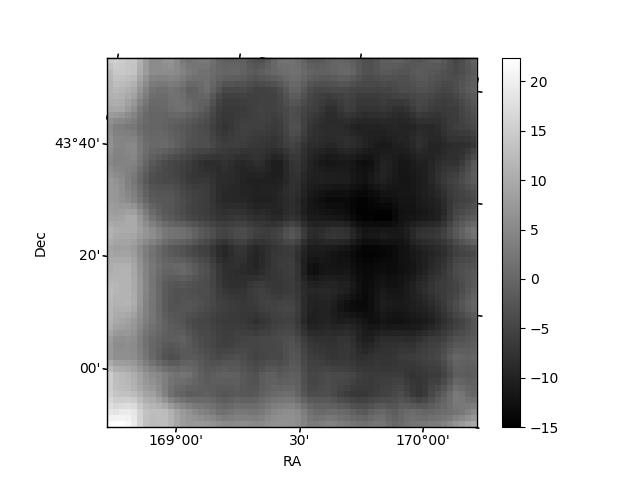
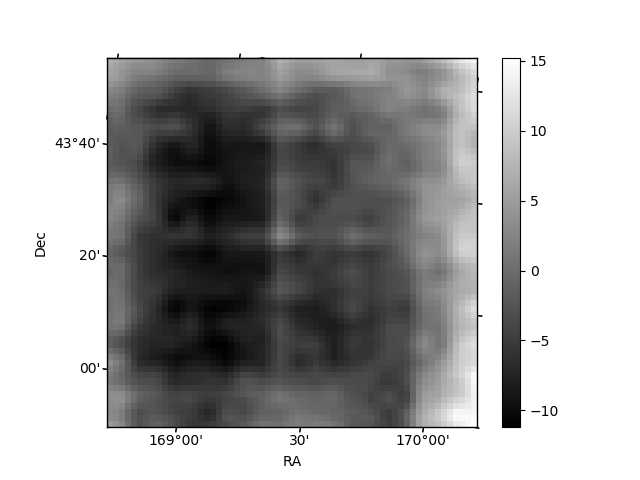
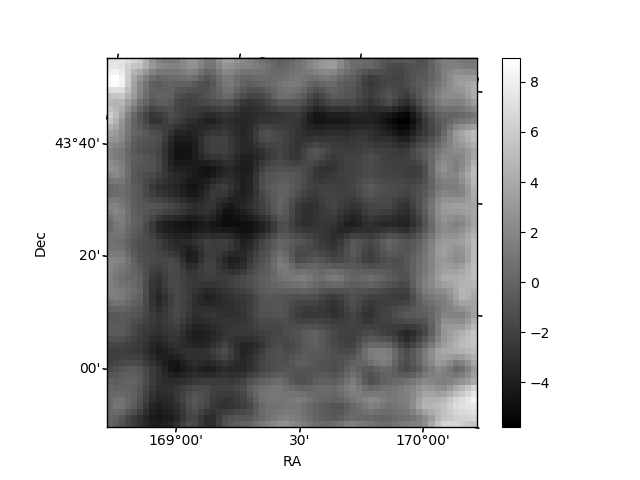
Histogram calculated using DETX and DETY for each event in the final _common_clean file
| Quadrant A | 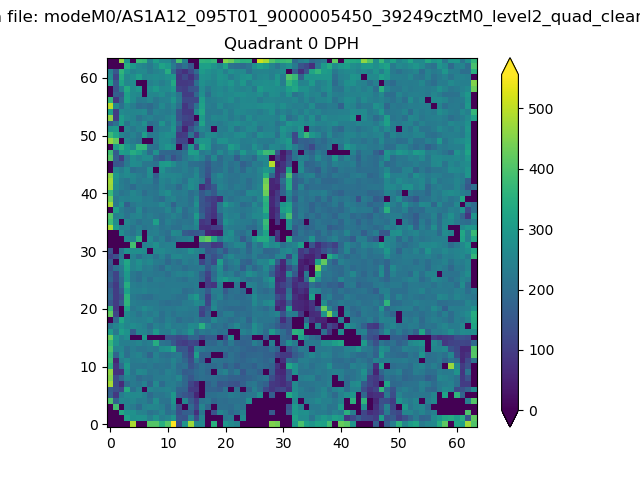 |
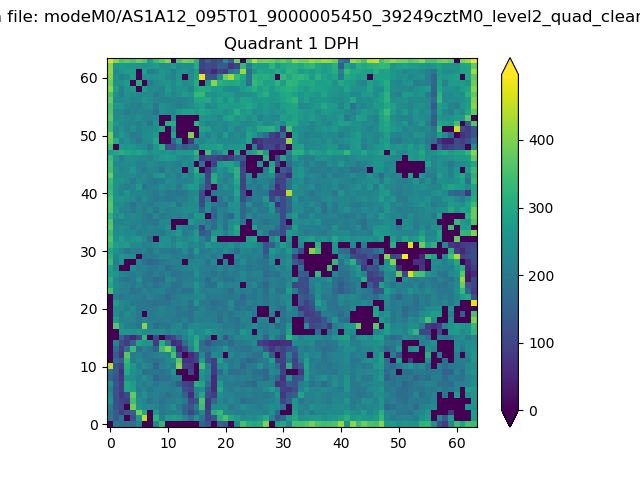 |
Quadrant B |
|---|---|---|---|
| Quadrant D | 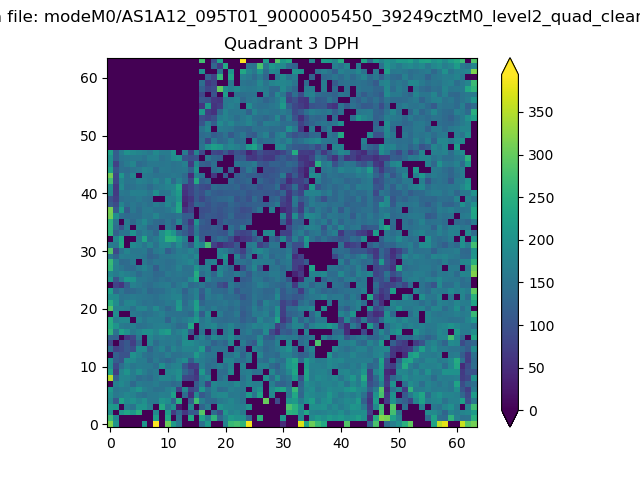 |
 |
Quadrant C |
| Plot type | Count rate plots | Images |
|---|---|---|
| Comparison with Poisson distribution Blue bars denote a histogram of data divided into 1 sec bins. Red curve is a Poisson curve with rate = median count rate of data. |
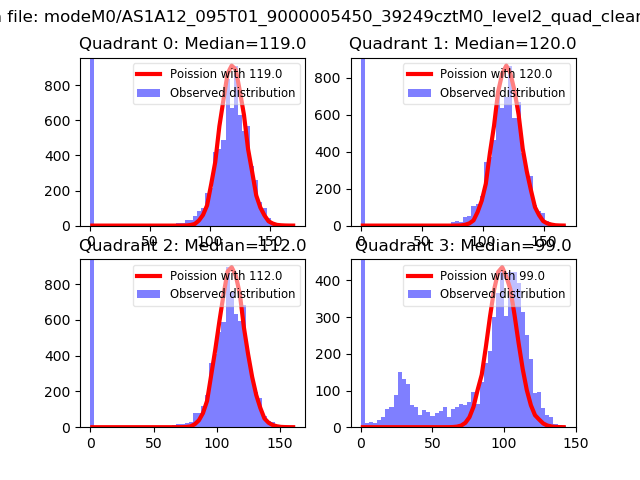 |
 |
| Quadrant-wise count rates Data is divided into 100 sec bins |
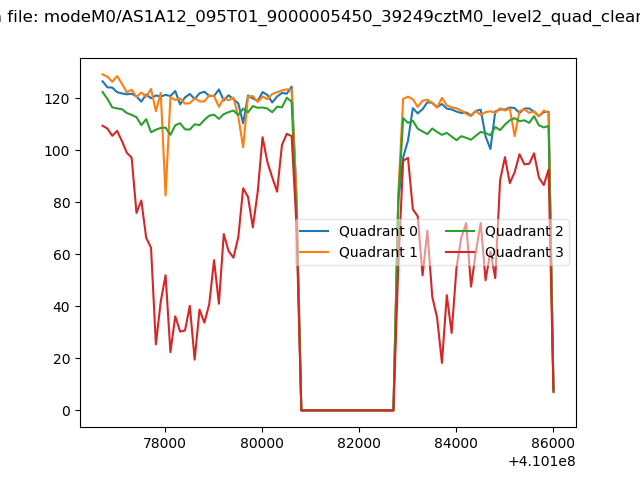 |
|
| Module-wise count rates for Quadrant A Data is divided into 100 sec bins |
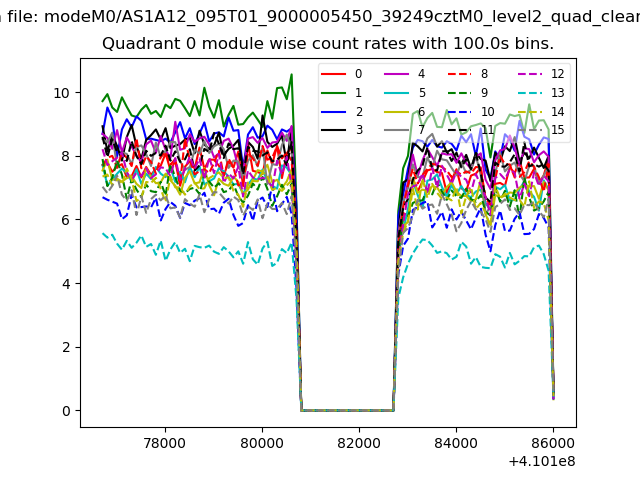 |
 |
| Module-wise count rates for Quadrant B Data is divided into 100 sec bins |
 |
 |
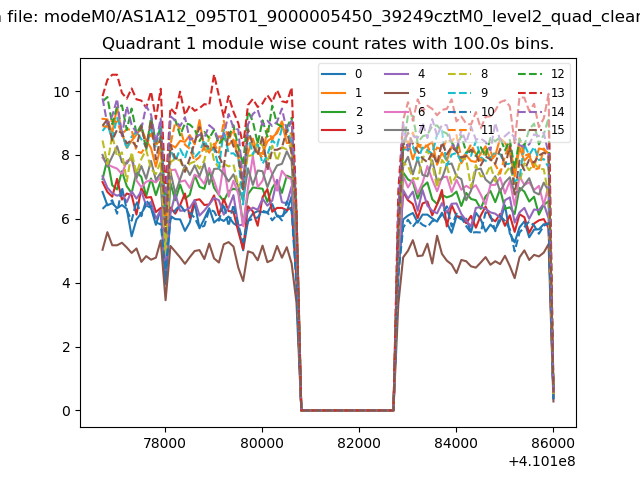
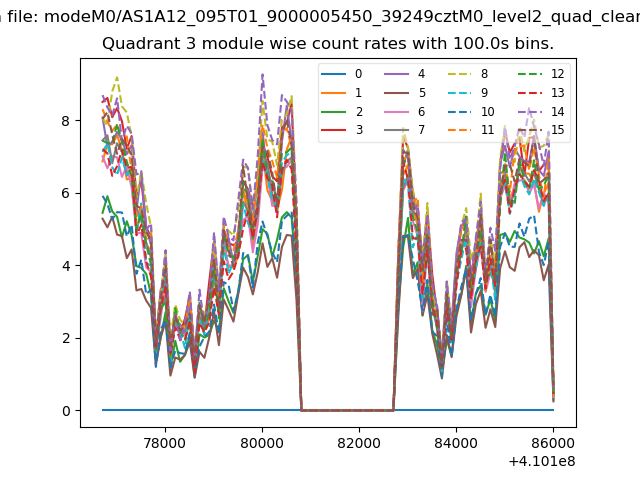
| Module-wise count rates for Quadrant C Data is divided into 100 sec bins |
 |
 |
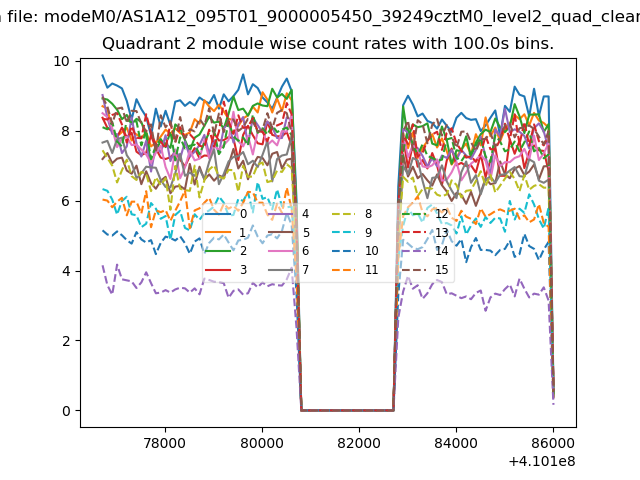
| Module-wise count rates for Quadrant D Data is divided into 100 sec bins |
 |
 |
| Parameter | Plot |
|---|---|
| CZT HV Monitor | 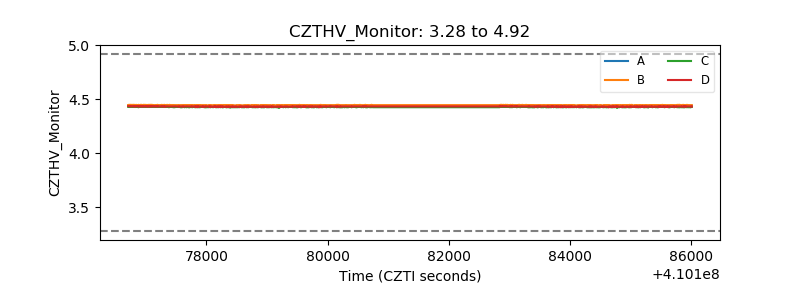 |
| D_VDD | 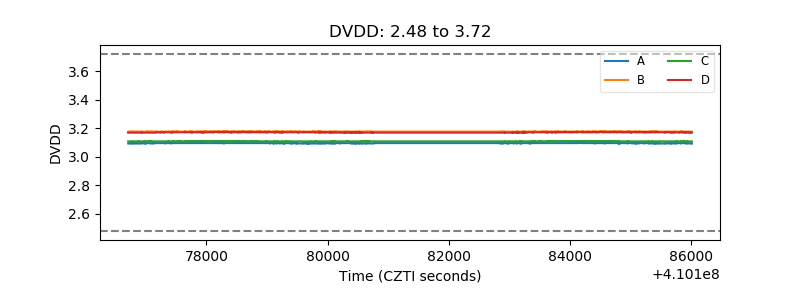 |
| Temperature 1 | 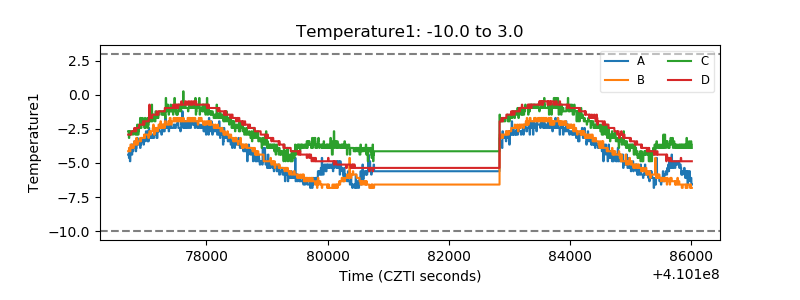 |
| Veto HV Monitor | 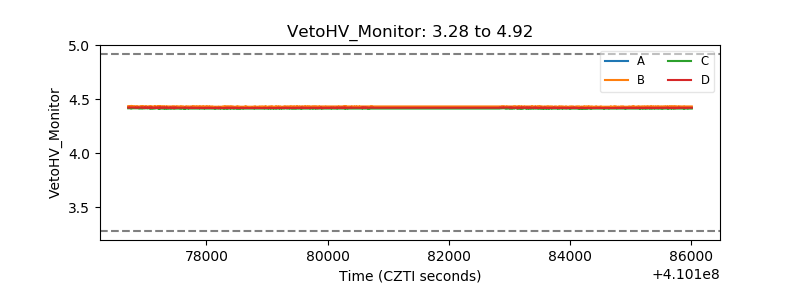 |
| Veto LLD | 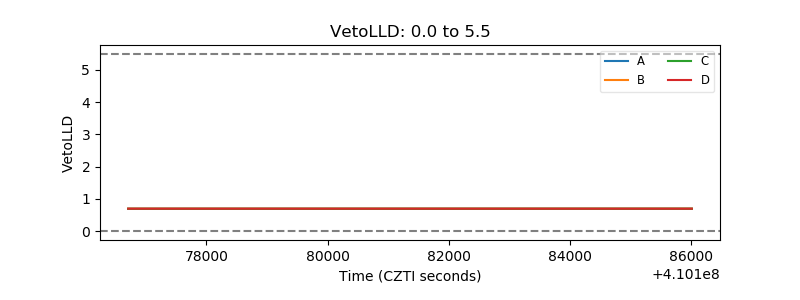 |
| Alpha Counter | 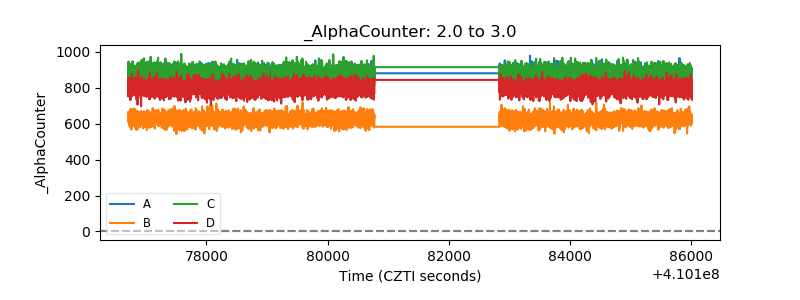 |
| _CPM_Rate | 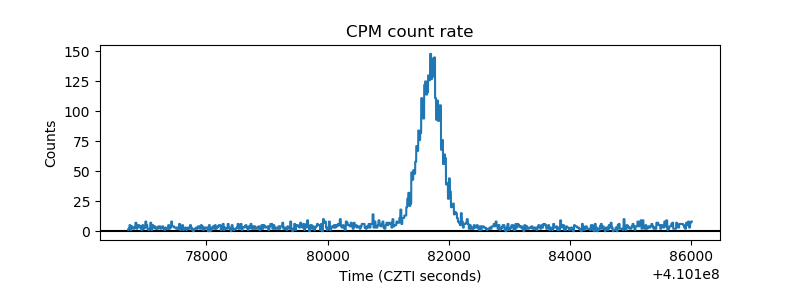 |
| CZT Counter |  |
| +2.5 Volts monitor | 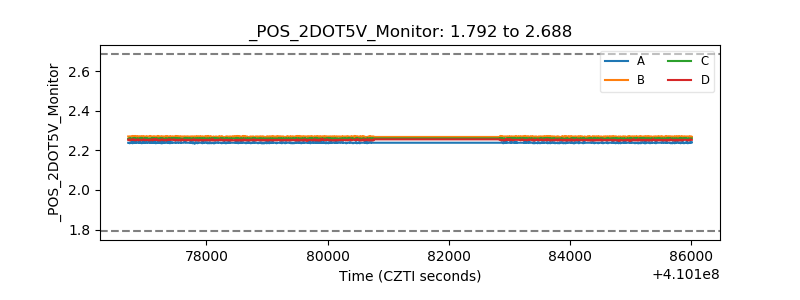 |
| +5 Volts monitor | 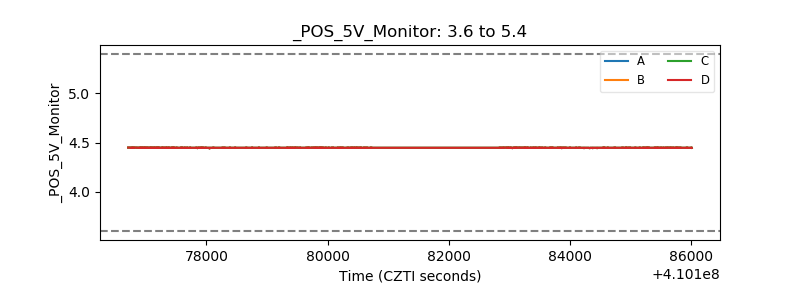 |
| _ROLL_ROT | 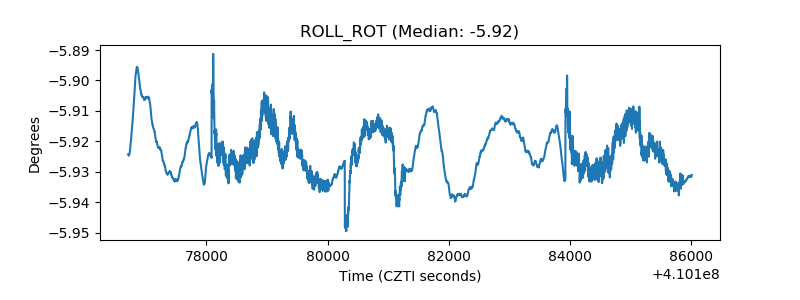 |
| _Roll_DEC | 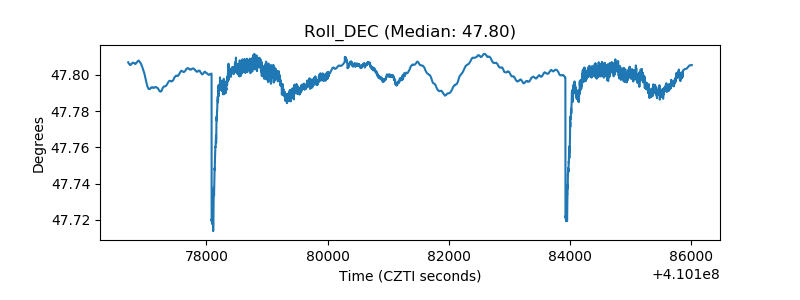 |
| _Roll_RA | 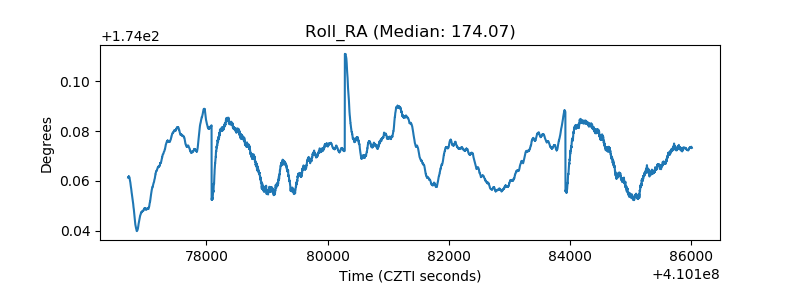 |
| Veto Counter | 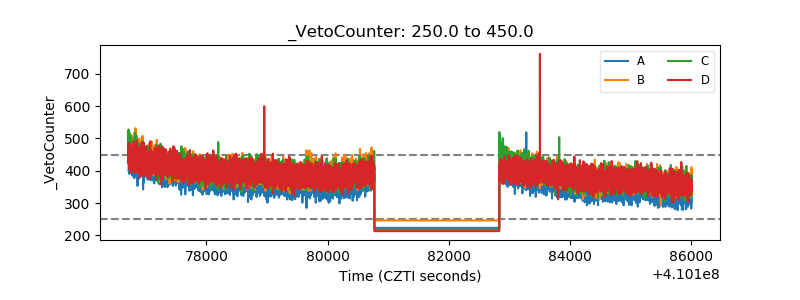 |