| Param | Original file | Final file |
|---|---|---|
| Filename | modeM0/AS1A12_093T02_9000005452_39247cztM0_level2.fits | modeM0/AS1A12_093T02_9000005452_39247cztM0_level2_quad_clean.evt |
| Size (bytes) | 118,785,600 | 27,691,200 |
| Size | 113.3 MB | 26.4 MB |
| Events in quadrant A | 900,099 | 189,508 |
| Events in quadrant B | 881,076 | 192,317 |
| Events in quadrant C | 796,033 | 180,185 |
| Events in quadrant D | 1,689,739 | 155,913 |
| Mode M0 | |||
|---|---|---|---|
| Quadrant | BADHDUFLAG | Total packets | Discarded packets |
| A | 0 | 3667 | 2 |
| B | 0 | 3660 | 1 |
| C | 0 | 3322 | 1 |
| D | 0 | 6163 | 1 |
| Mode SS | |||
|---|---|---|---|
| Quadrant | BADHDUFLAG | Total packets | Discarded packets |
| A | 0 | 36 | 0 |
| B | 0 | 36 | 0 |
| C | 0 | 36 | 0 |
| D | 0 | 36 | 0 |
| Mode M9 | |||
|---|---|---|---|
| Quadrant | BADHDUFLAG | Total packets | Discarded packets |
| A | 0 | 18 | 0 |
| B | 0 | 18 | 0 |
| C | 0 | 18 | 0 |
| D | 0 | 18 | 0 |
| Quadrant | Total seconds | Saturated seconds | Saturation percentage |
|---|---|---|---|
| A | 1637 | 5 | 0.305437% |
| B | 1637 | 11 | 0.671961% |
| C | 1637 | 5 | 0.305437% |
| D | 1637 | 225 | 13.744655% |
Noise dominated data is calculated using 1-second bins in cleaned event files. If a bin has >2000 counts, and if more than 50% of those come from <1% of pixels, then it is considered to be noise-dominated and hence unusable.
| Quadrant | # 1 sec bins | Bins with >0 counts | Bins with >2000 counts | High rate bins dominated by noise | Noise dominated (total time) | Noise dominated (detector-on time) | Marked lightcurve |
|---|---|---|---|---|---|---|---|
| A | 3429 | 1638 | 2 | 2 | 0.06% | 0.12% | 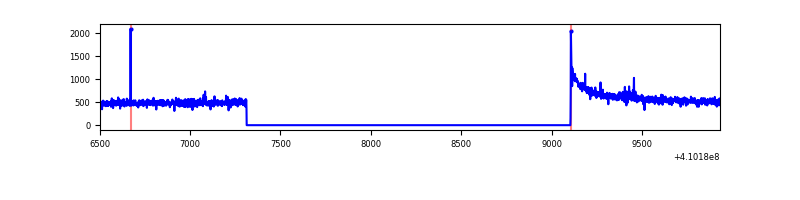 |
| B | 3429 | 1638 | 3 | 3 | 0.09% | 0.18% | 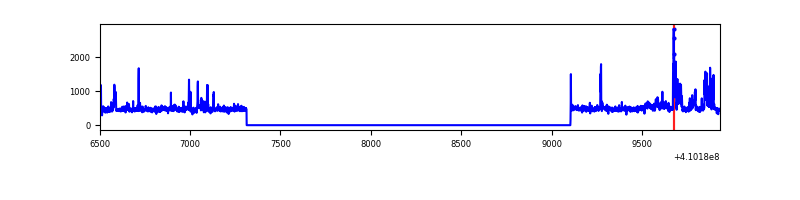 |
| C | 3429 | 1638 | 1 | 1 | 0.03% | 0.06% | 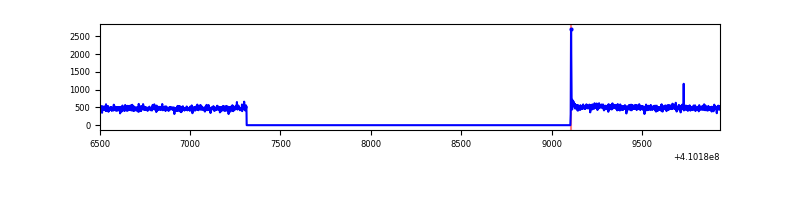 |
| D | 3429 | 1638 | 193 | 193 | 5.63% | 11.78% | 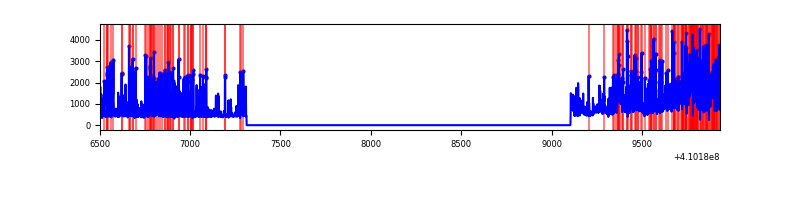 |
Top three noisy pixels from each quadrant. If the there are fewer than three noisy pixels in the level2.evt file, extra rows are filled as -1
| Pixel properties | Quadrant properties | ||||||
|---|---|---|---|---|---|---|---|
| Quadrant | DetID | PixID | Counts | Sigma | Mean | Median | Sigma |
| A | 10 | 83 | 163340 | 4103.62 | 188 | 185 | 39.8 |
| A | 13 | 248 | 7321 | 179.48 | 188 | 185 | 39.8 |
| A | 3 | 137 | 2006 | 45.8 | 188 | 185 | 39.8 |
| B | 5 | 172 | 84018 | 2176.26 | 186 | 181 | 38.5 |
| B | 0 | 190 | 24336 | 627.02 | 186 | 181 | 38.5 |
| B | 5 | 184 | 22228 | 572.3 | 186 | 181 | 38.5 |
| C | 15 | 214 | 76843 | 1728.03 | 182 | 182 | 44.4 |
| C | 0 | 10 | 9094 | 200.89 | 182 | 182 | 44.4 |
| C | 13 | 61 | 1241 | 23.87 | 182 | 182 | 44.4 |
| D | 12 | 235 | 821408 | 18494.79 | 174 | 169 | 44.4 |
| D | 5 | 222 | 68443 | 1537.57 | 174 | 169 | 44.4 |
| D | 12 | 233 | 41393 | 928.39 | 174 | 169 | 44.4 |
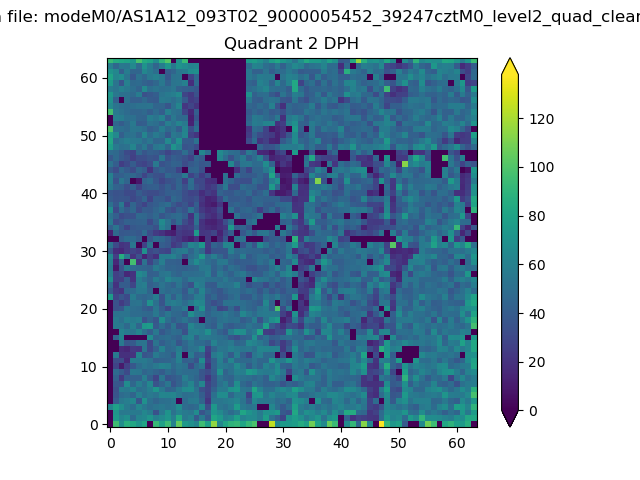
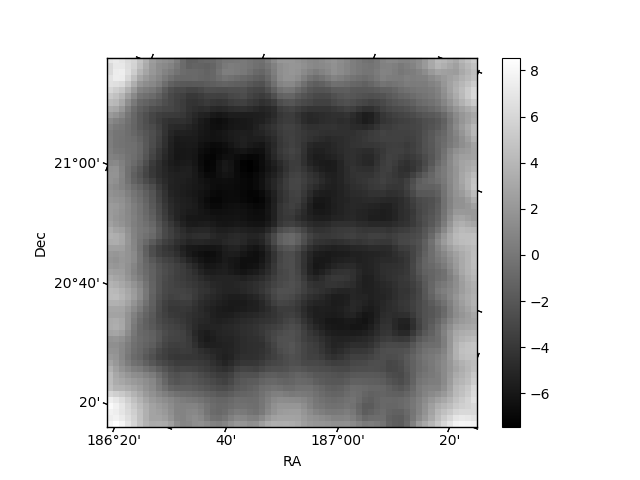
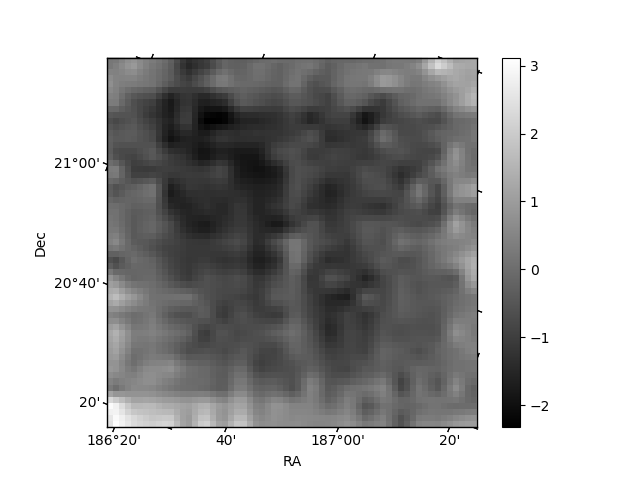
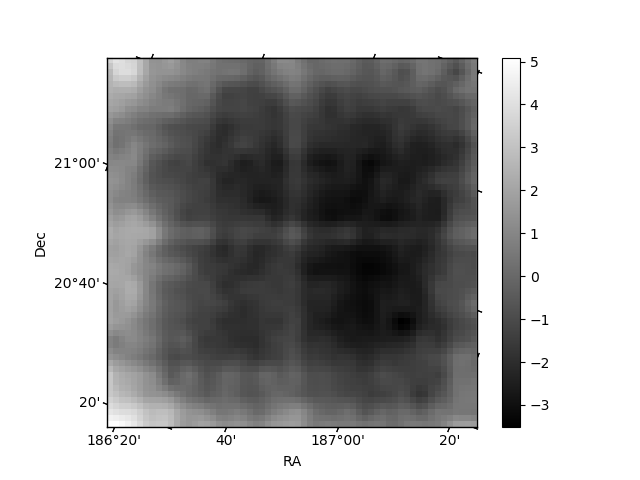
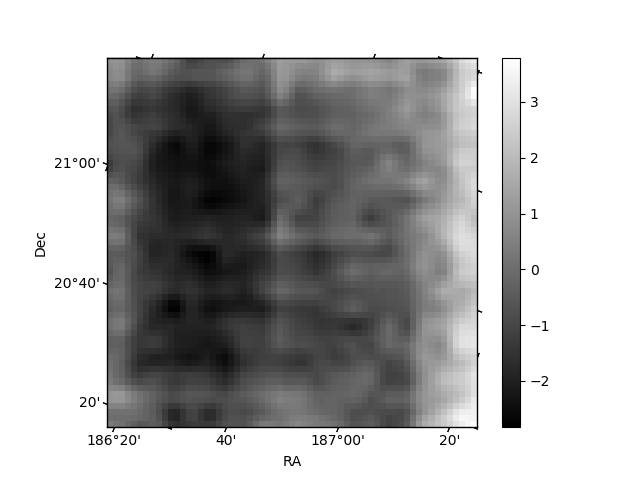
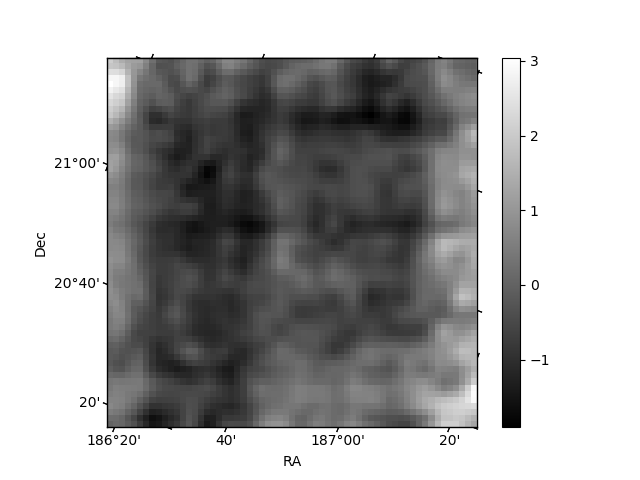
Histogram calculated using DETX and DETY for each event in the final _common_clean file
| Quadrant A | 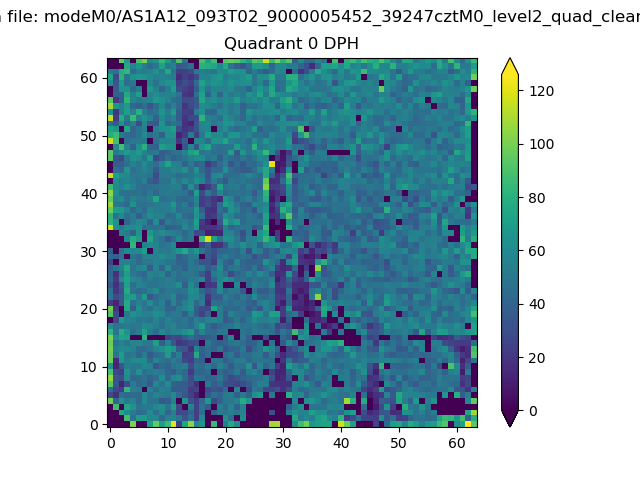 |
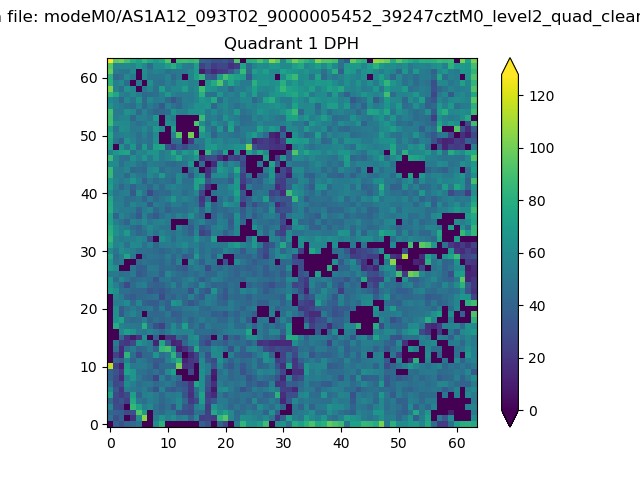 |
Quadrant B |
|---|---|---|---|
| Quadrant D | 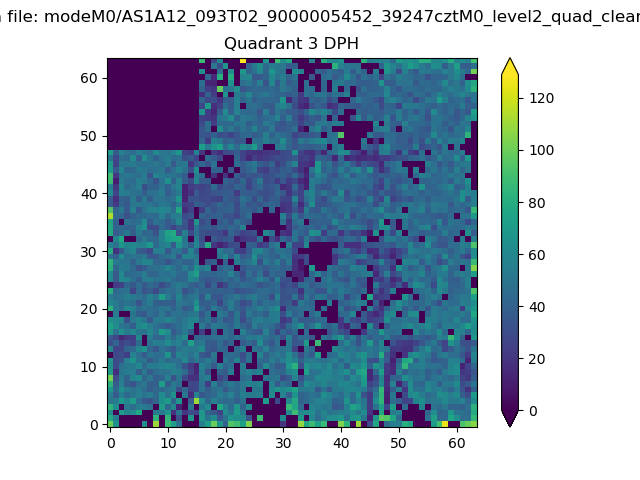 |
 |
Quadrant C |
| Plot type | Count rate plots | Images |
|---|---|---|
| Comparison with Poisson distribution Blue bars denote a histogram of data divided into 1 sec bins. Red curve is a Poisson curve with rate = median count rate of data. |
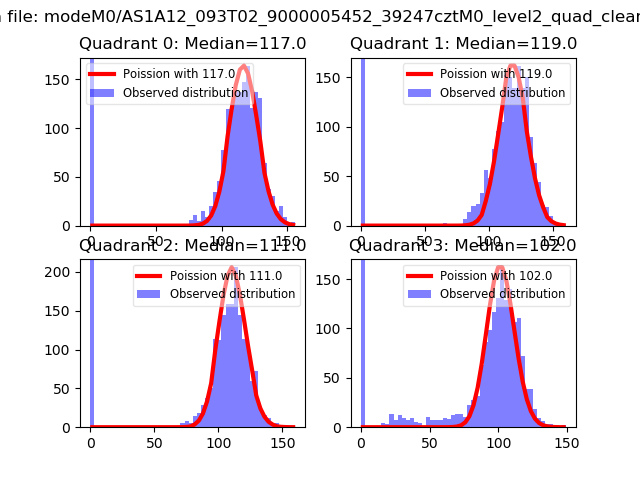 |
 |
| Quadrant-wise count rates Data is divided into 100 sec bins |
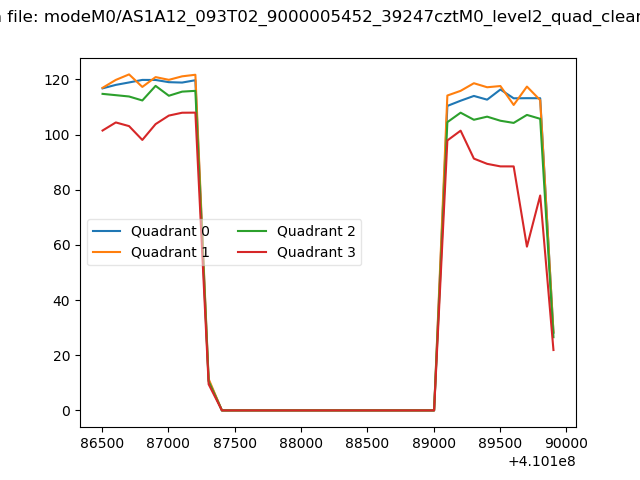 |
|
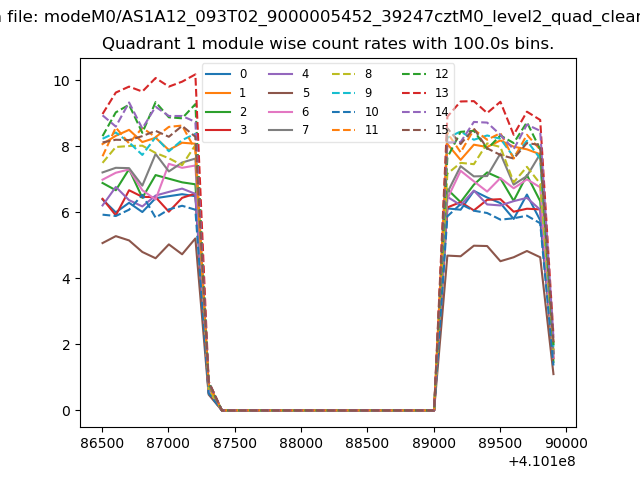
| Module-wise count rates for Quadrant A Data is divided into 100 sec bins |
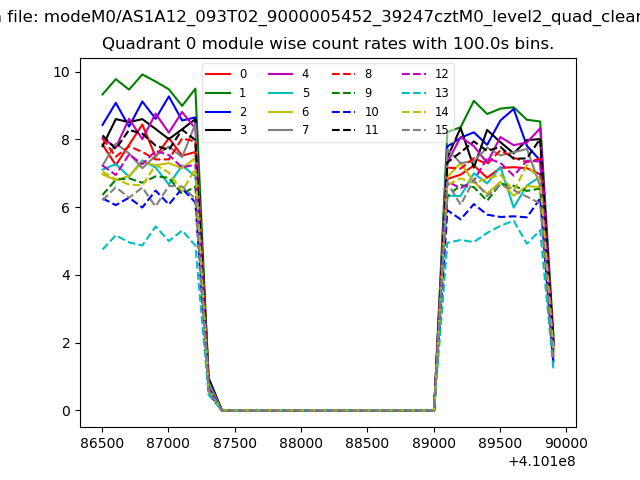 |
 |
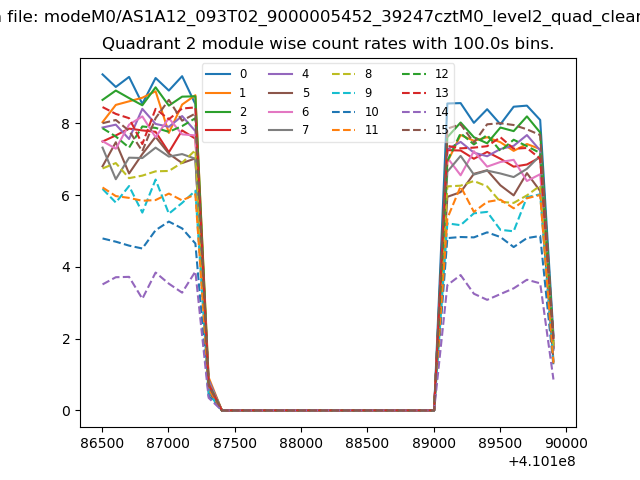
| Module-wise count rates for Quadrant B Data is divided into 100 sec bins |
 |
 |
| Module-wise count rates for Quadrant C Data is divided into 100 sec bins |
 |
 |
| Module-wise count rates for Quadrant D Data is divided into 100 sec bins |
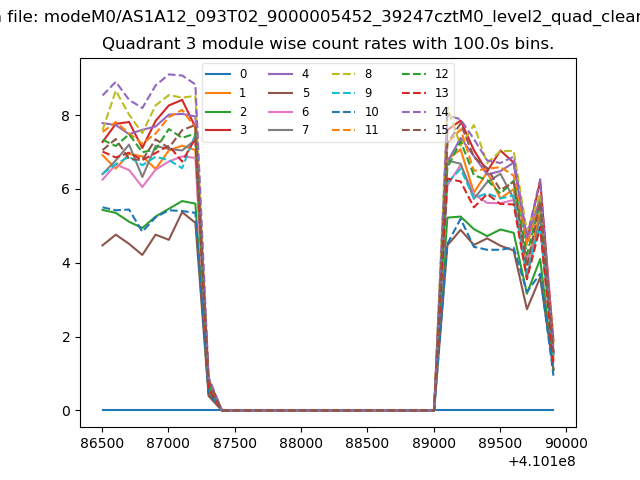 |
 |
| Parameter | Plot |
|---|---|
| CZT HV Monitor | 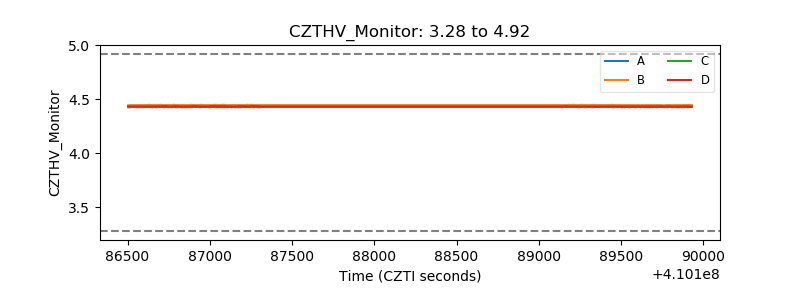 |
| D_VDD | 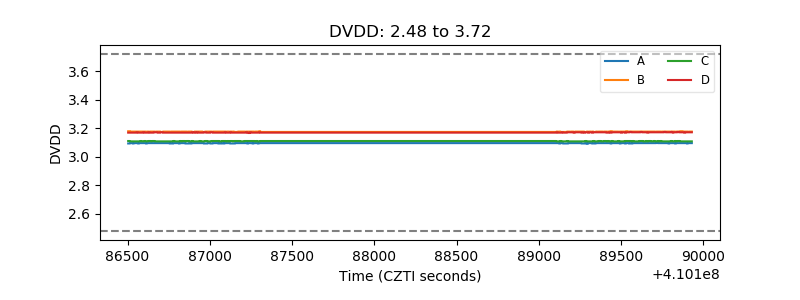 |
| Temperature 1 | 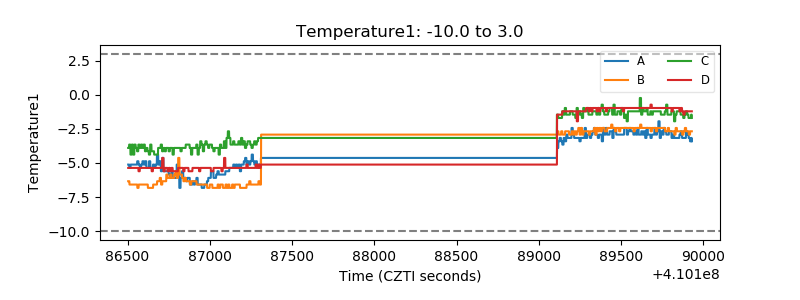 |
| Veto HV Monitor | 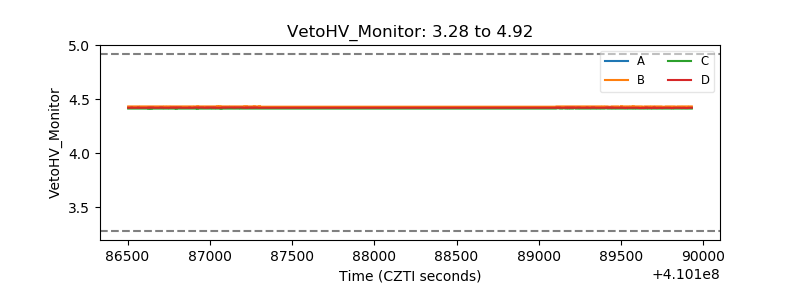 |
| Veto LLD | 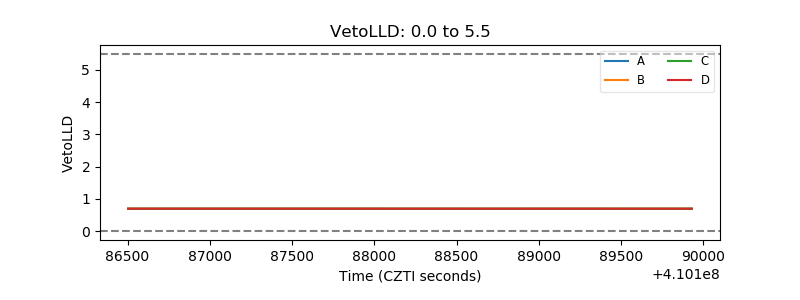 |
| Alpha Counter | 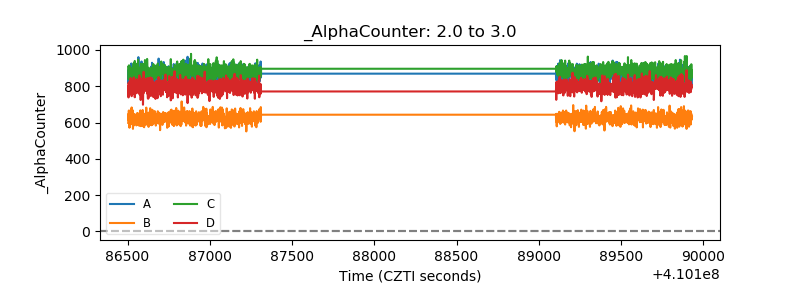 |
| _CPM_Rate | 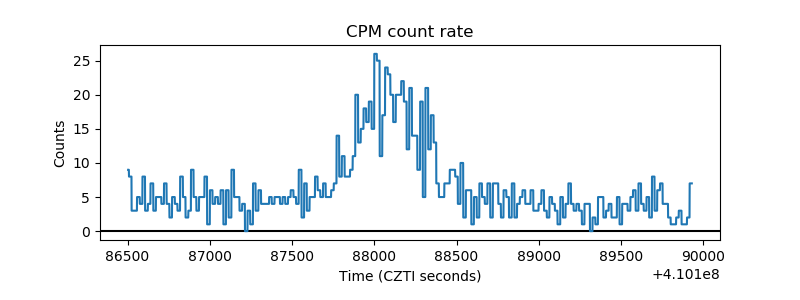 |
| CZT Counter | 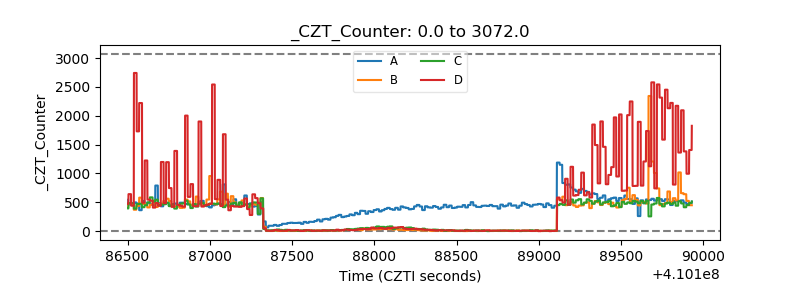 |
| +2.5 Volts monitor | 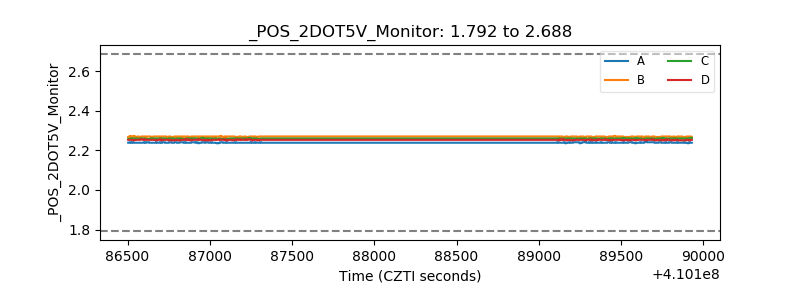 |
| +5 Volts monitor | 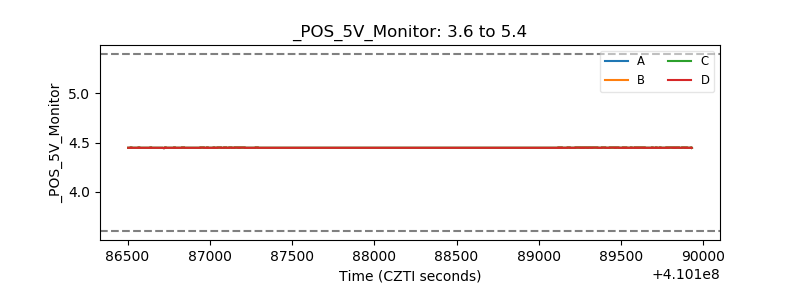 |
| _ROLL_ROT | 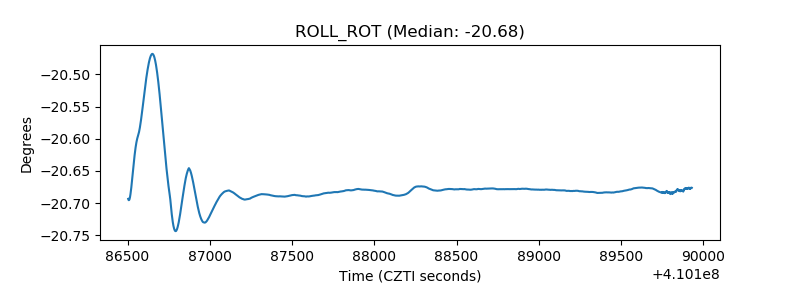 |
| _Roll_DEC | 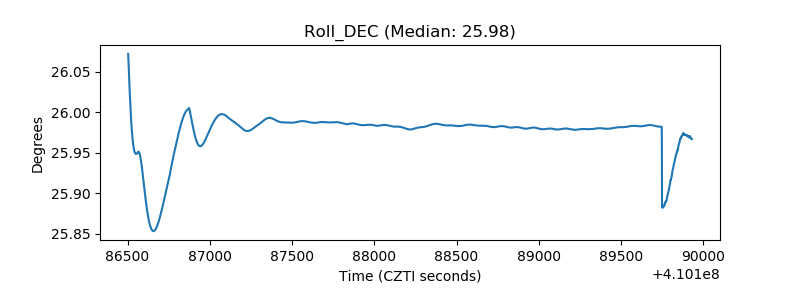 |
| _Roll_RA | 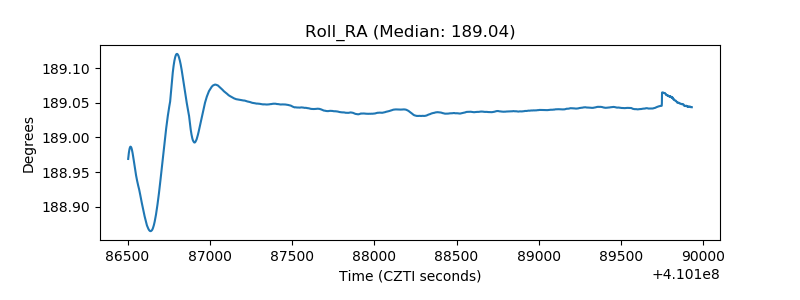 |
| Veto Counter |  |