| Param | Original file | Final file |
|---|---|---|
| Filename | modeM0/AS1A12_093T02_9000005452_39248cztM0_level2.fits | modeM0/AS1A12_093T02_9000005452_39248cztM0_level2_quad_clean.evt |
| Size (bytes) | 458,470,080 | 91,814,400 |
| Size | 437.2 MB | 87.6 MB |
| Events in quadrant A | 3,176,903 | 637,364 |
| Events in quadrant B | 3,102,454 | 646,631 |
| Events in quadrant C | 2,679,939 | 616,164 |
| Events in quadrant D | 7,571,598 | 483,310 |
| Mode M0 | |||
|---|---|---|---|
| Quadrant | BADHDUFLAG | Total packets | Discarded packets |
| A | 0 | 12997 | 3 |
| B | 0 | 12949 | 2 |
| C | 0 | 11419 | 2 |
| D | 0 | 26457 | 2 |
| Mode SS | |||
|---|---|---|---|
| Quadrant | BADHDUFLAG | Total packets | Discarded packets |
| A | 0 | 116 | 0 |
| B | 0 | 116 | 0 |
| C | 0 | 116 | 0 |
| D | 0 | 116 | 0 |
| Mode M9 | |||
|---|---|---|---|
| Quadrant | BADHDUFLAG | Total packets | Discarded packets |
| A | 0 | 25 | 0 |
| B | 0 | 25 | 0 |
| C | 0 | 25 | 0 |
| D | 0 | 26 | 0 |
| Quadrant | Total seconds | Saturated seconds | Saturation percentage |
|---|---|---|---|
| A | 5664 | 98 | 1.730226% |
| B | 5664 | 76 | 1.341808% |
| C | 5664 | 6 | 0.105932% |
| D | 5664 | 1349 | 23.817090% |
Noise dominated data is calculated using 1-second bins in cleaned event files. If a bin has >2000 counts, and if more than 50% of those come from <1% of pixels, then it is considered to be noise-dominated and hence unusable.
| Quadrant | # 1 sec bins | Bins with >0 counts | Bins with >2000 counts | High rate bins dominated by noise | Noise dominated (total time) | Noise dominated (detector-on time) | Marked lightcurve |
|---|---|---|---|---|---|---|---|
| A | 7127 | 5665 | 53 | 53 | 0.74% | 0.94% | 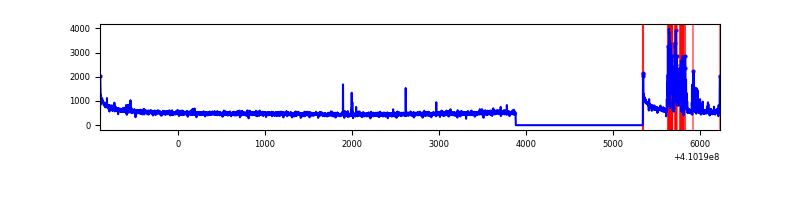 |
| B | 7127 | 5664 | 46 | 46 | 0.65% | 0.81% | 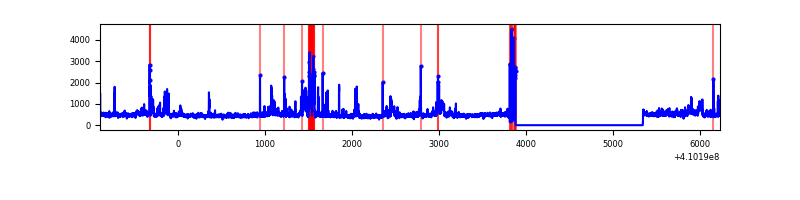 |
| C | 7127 | 5665 | 1 | 1 | 0.01% | 0.02% | 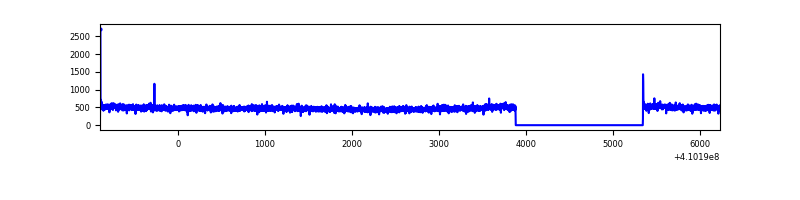 |
| D | 7126 | 5664 | 1144 | 1144 | 16.05% | 20.20% | 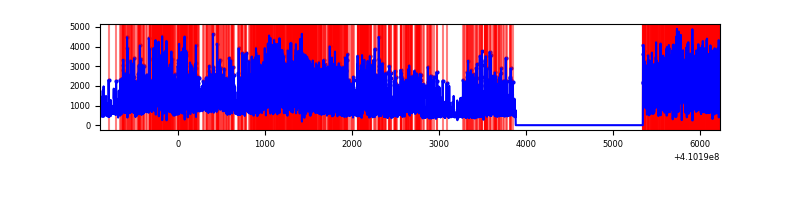 |
Top three noisy pixels from each quadrant. If the there are fewer than three noisy pixels in the level2.evt file, extra rows are filled as -1
| Pixel properties | Quadrant properties | ||||||
|---|---|---|---|---|---|---|---|
| Quadrant | DetID | PixID | Counts | Sigma | Mean | Median | Sigma |
| A | 10 | 83 | 437303 | 3360.21 | 633 | 620 | 130.0 |
| A | 13 | 248 | 288040 | 2211.66 | 633 | 620 | 130.0 |
| A | 13 | 254 | 7857 | 55.69 | 633 | 620 | 130.0 |
| B | 5 | 172 | 383504 | 3125.7 | 628 | 611 | 122.5 |
| B | 0 | 190 | 100666 | 816.79 | 628 | 611 | 122.5 |
| B | 5 | 184 | 82896 | 671.72 | 628 | 611 | 122.5 |
| C | 15 | 214 | 256716 | 1758.77 | 618 | 621 | 145.6 |
| C | 0 | 10 | 13288 | 86.99 | 618 | 621 | 145.6 |
| C | 13 | 61 | 4257 | 24.97 | 618 | 621 | 145.6 |
| D | 12 | 235 | 4339465 | 31445.05 | 564 | 548 | 138.0 |
| D | 5 | 222 | 670821 | 4857.61 | 564 | 548 | 138.0 |
| D | 12 | 227 | 115354 | 832.02 | 564 | 548 | 138.0 |
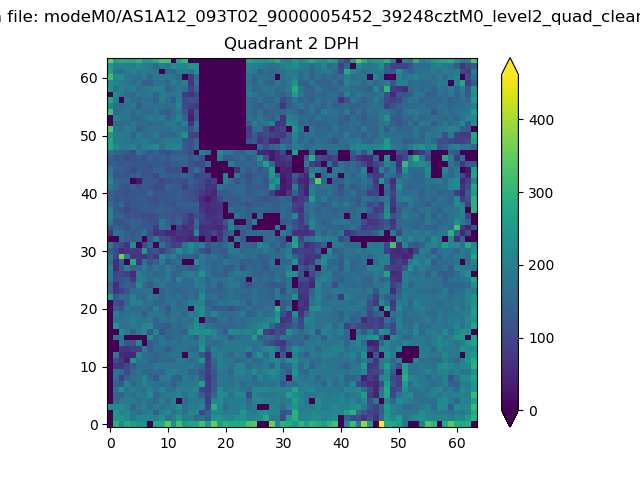
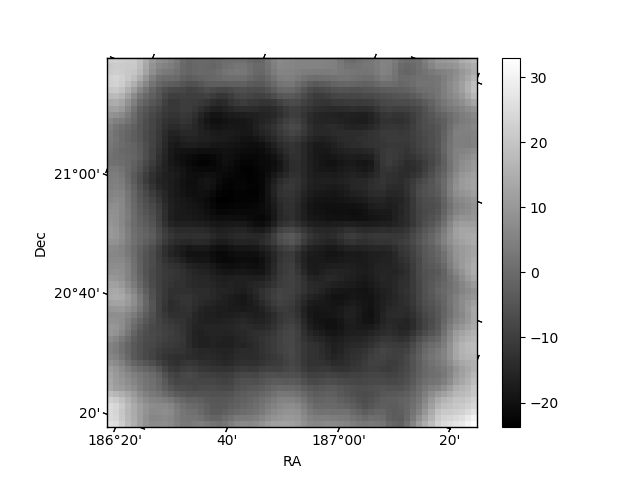
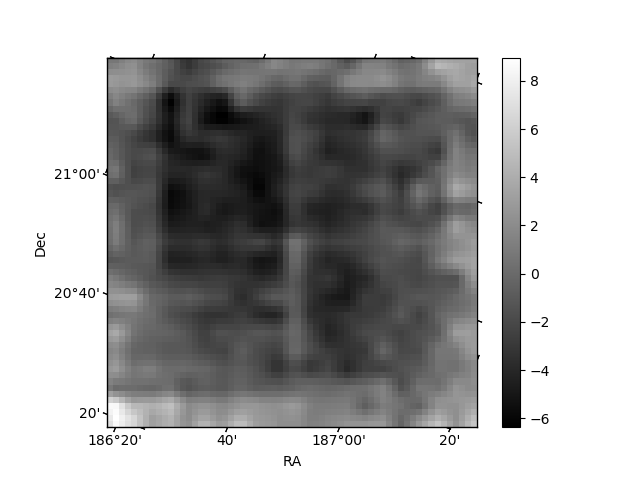
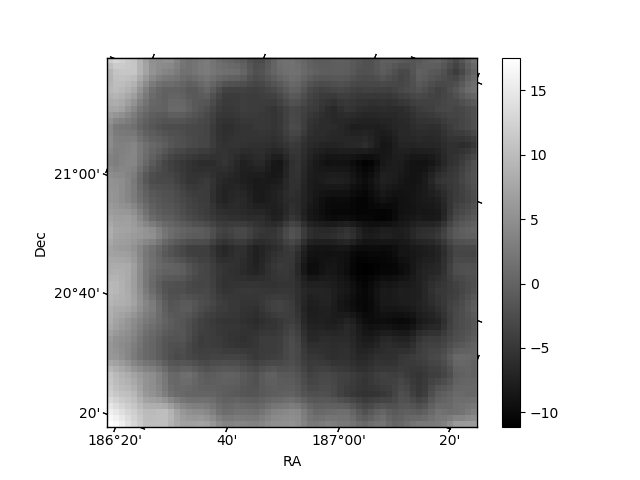
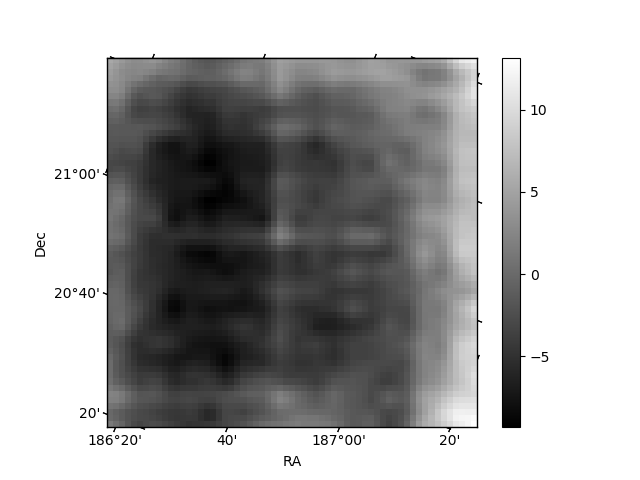
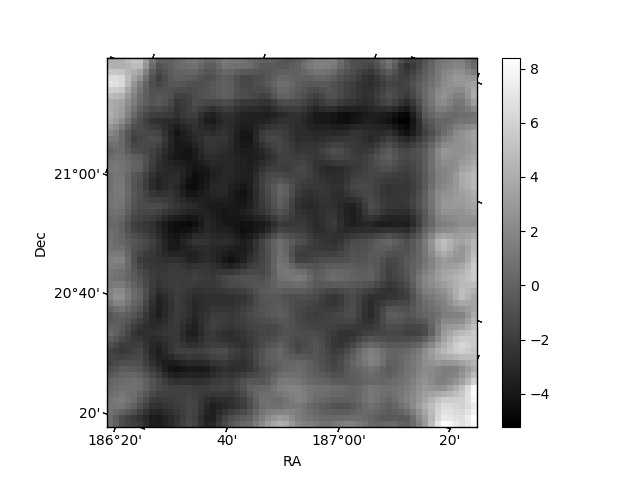
Histogram calculated using DETX and DETY for each event in the final _common_clean file
| Quadrant A | 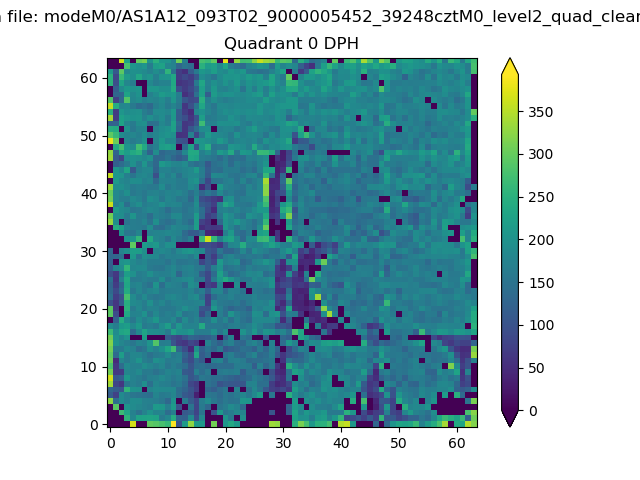 |
 |
Quadrant B |
|---|---|---|---|
| Quadrant D | 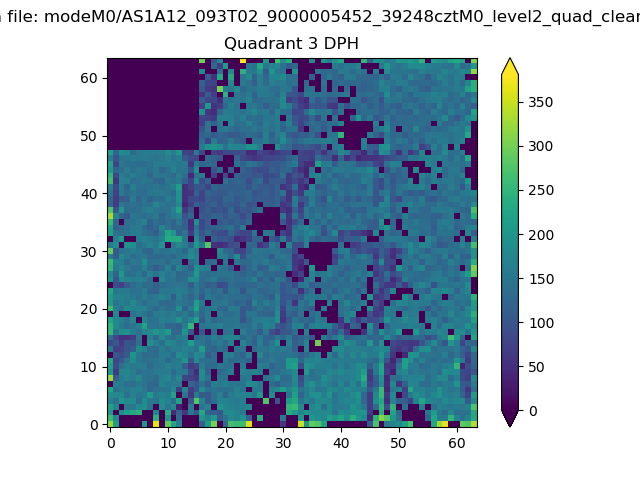 |
 |
Quadrant C |
| Plot type | Count rate plots | Images |
|---|---|---|
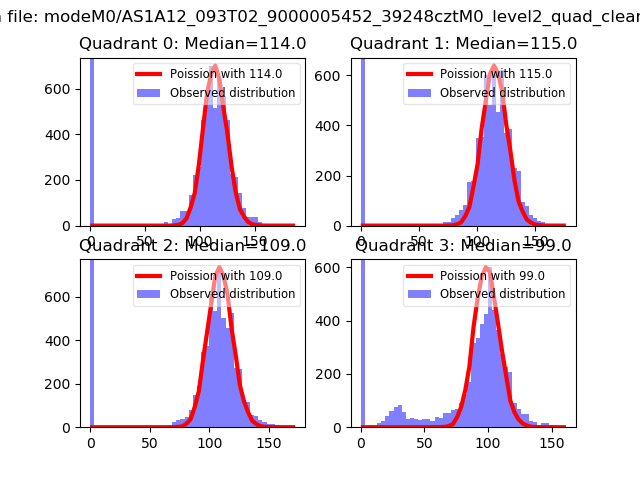
| Comparison with Poisson distribution Blue bars denote a histogram of data divided into 1 sec bins. Red curve is a Poisson curve with rate = median count rate of data. |
 |
 |
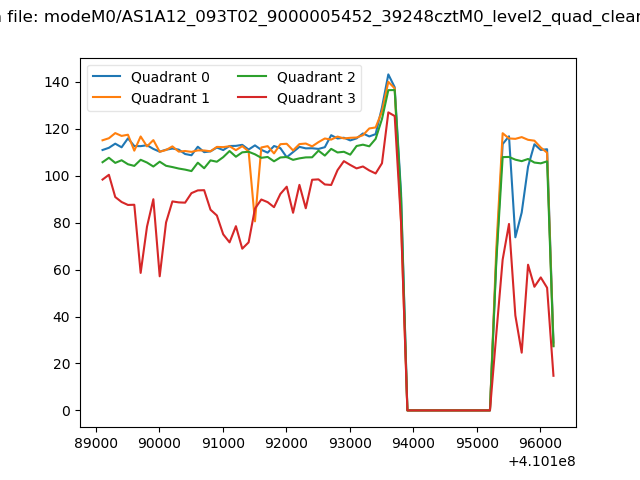
| Quadrant-wise count rates Data is divided into 100 sec bins |
 |
|
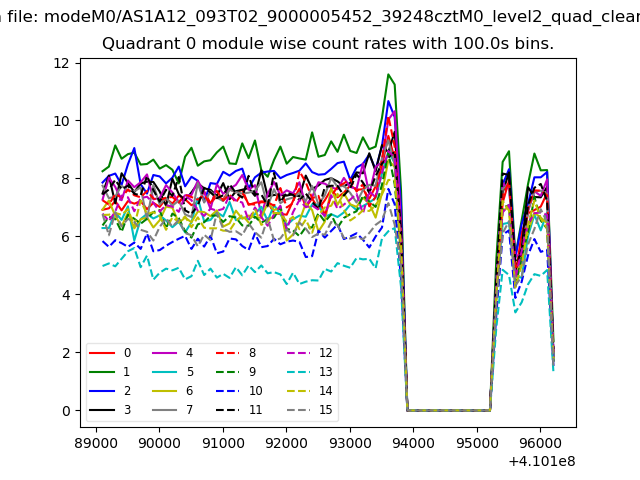
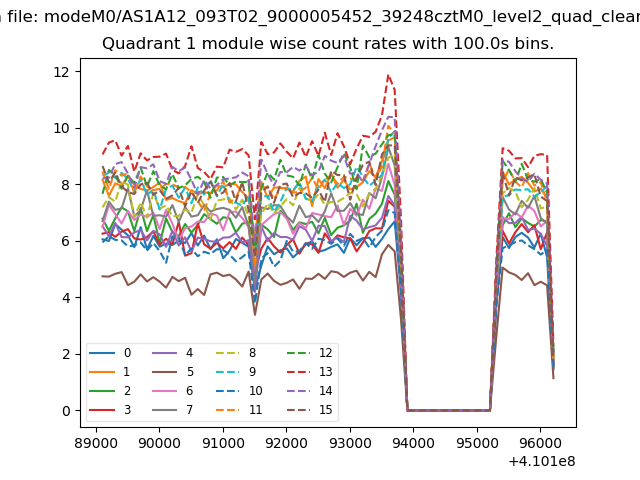
| Module-wise count rates for Quadrant A Data is divided into 100 sec bins |
 |
 |
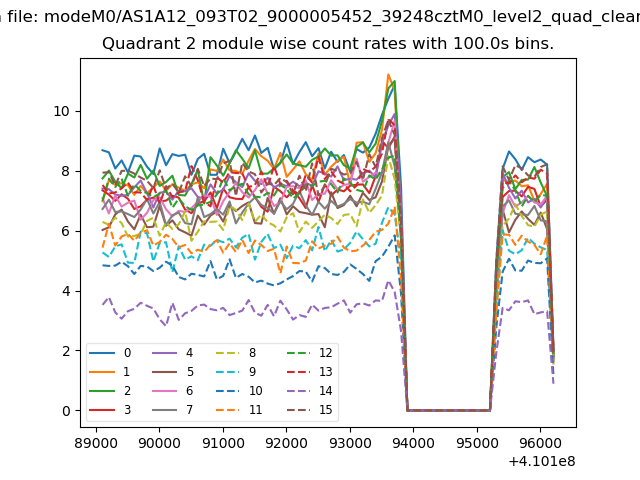
| Module-wise count rates for Quadrant B Data is divided into 100 sec bins |
 |
 |
| Module-wise count rates for Quadrant C Data is divided into 100 sec bins |
 |
 |
| Module-wise count rates for Quadrant D Data is divided into 100 sec bins |
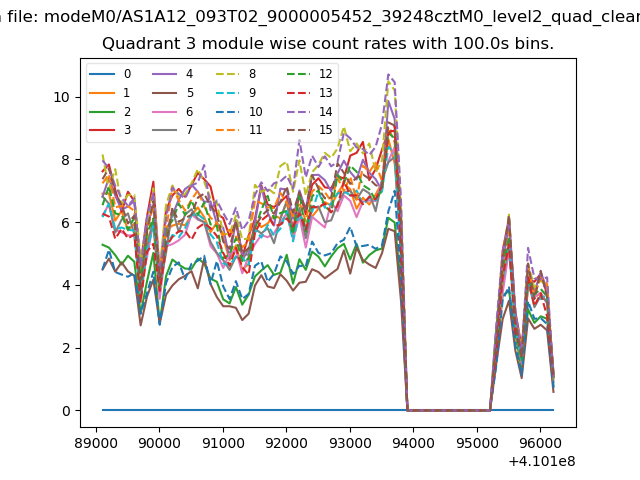 |
 |
| Parameter | Plot |
|---|---|
| CZT HV Monitor | 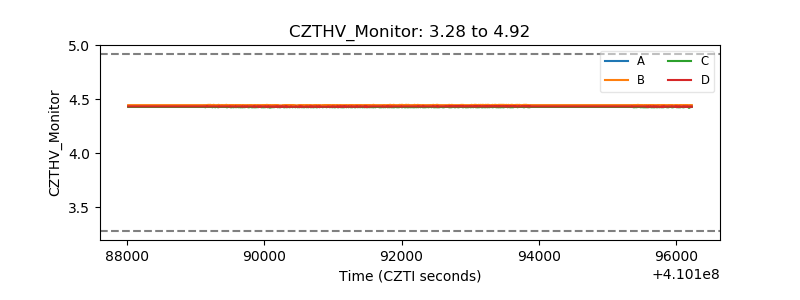 |
| D_VDD | 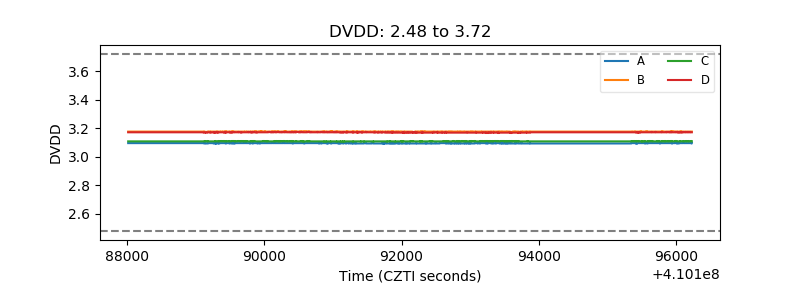 |
| Temperature 1 | 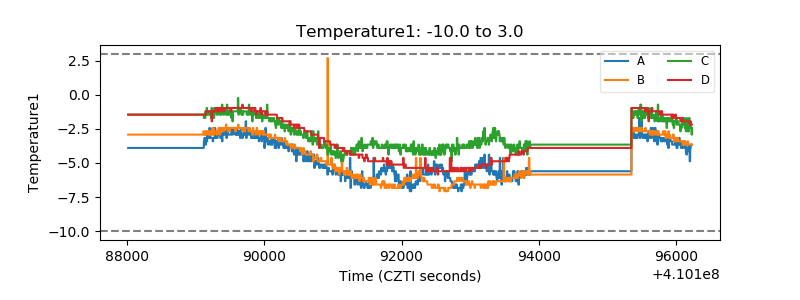 |
| Veto HV Monitor | 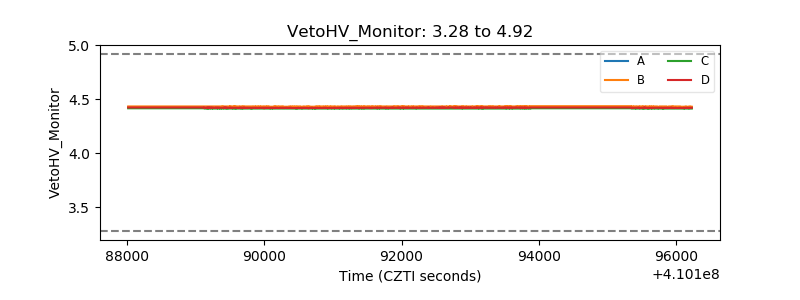 |
| Veto LLD | 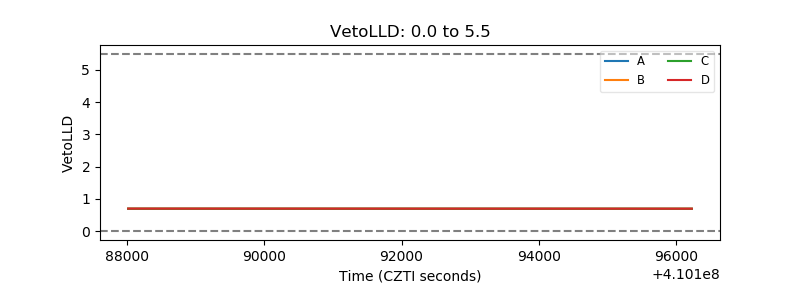 |
| Alpha Counter | 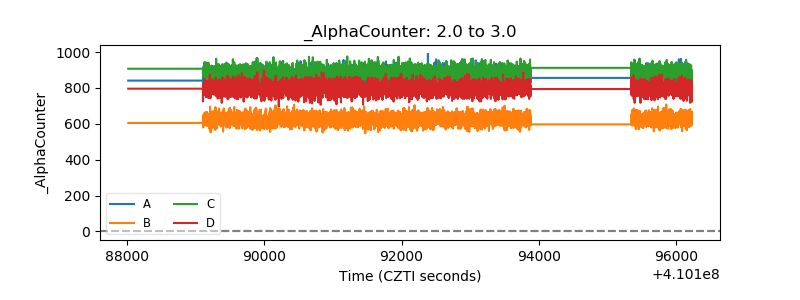 |
| _CPM_Rate |  |
| CZT Counter | 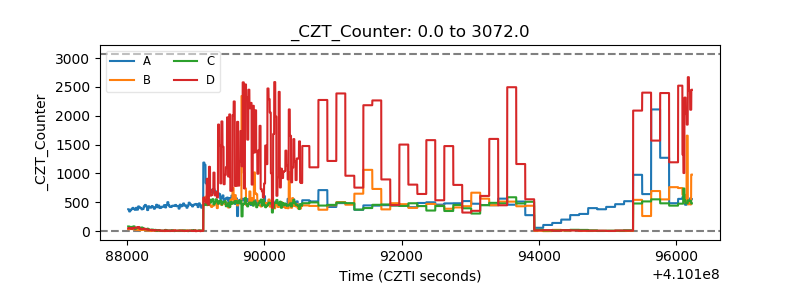 |
| +2.5 Volts monitor | 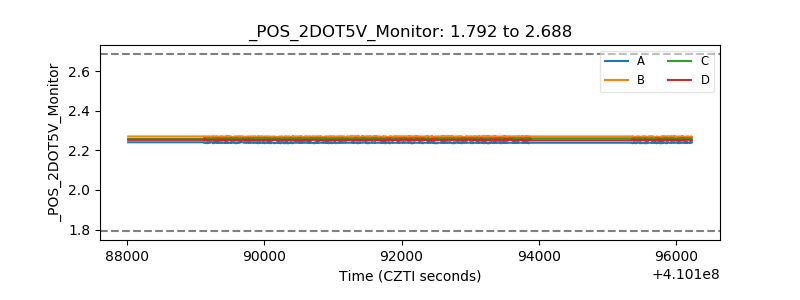 |
| +5 Volts monitor | 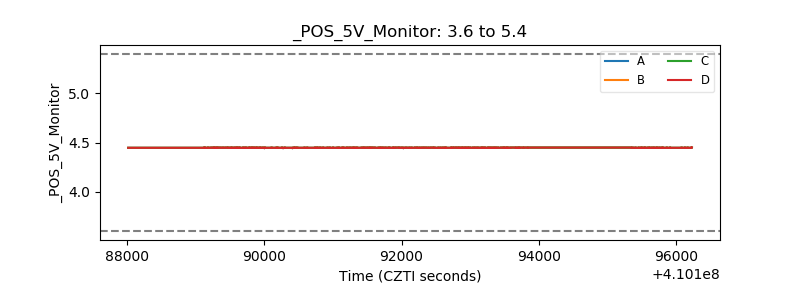 |
| _ROLL_ROT | 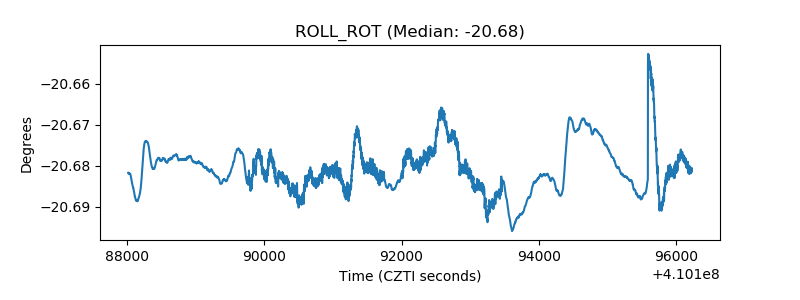 |
| _Roll_DEC | 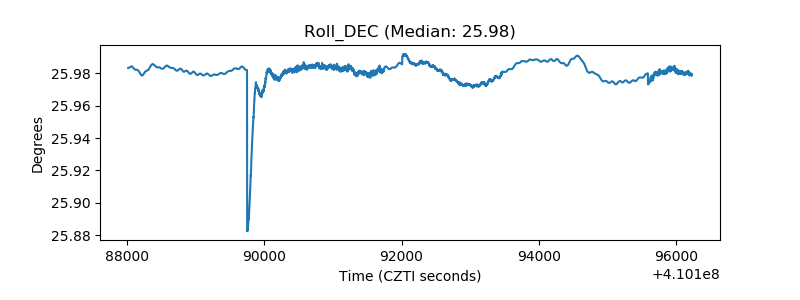 |
| _Roll_RA | 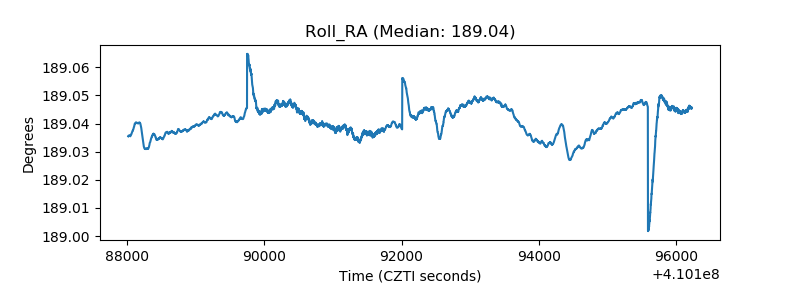 |
| Veto Counter | 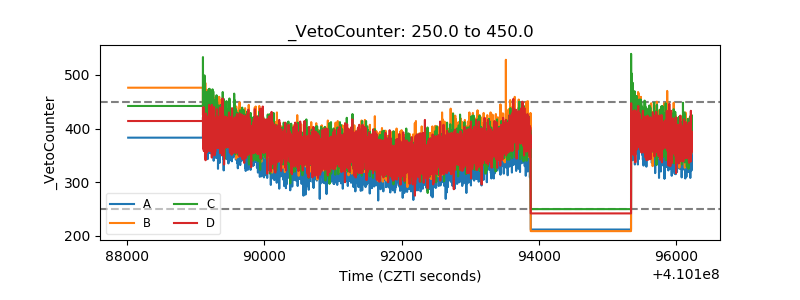 |