| Param | Original file | Final file |
|---|---|---|
| Filename | modeM0/AS1A12_093T02_9000005452_39249cztM0_level2.fits | modeM0/AS1A12_093T02_9000005452_39249cztM0_level2_quad_clean.evt |
| Size (bytes) | 945,097,920 | 175,818,240 |
| Size | 901.3 MB | 167.7 MB |
| Events in quadrant A | 6,405,236 | 1,230,620 |
| Events in quadrant B | 5,851,576 | 1,257,807 |
| Events in quadrant C | 5,237,923 | 1,203,132 |
| Events in quadrant D | 16,628,307 | 861,788 |
| Mode M0 | |||
|---|---|---|---|
| Quadrant | BADHDUFLAG | Total packets | Discarded packets |
| A | 0 | 26026 | 5 |
| B | 0 | 24777 | 3 |
| C | 0 | 22455 | 3 |
| D | 0 | 57153 | 3 |
| Mode SS | |||
|---|---|---|---|
| Quadrant | BADHDUFLAG | Total packets | Discarded packets |
| A | 0 | 224 | 0 |
| B | 0 | 224 | 0 |
| C | 0 | 224 | 0 |
| D | 0 | 224 | 0 |
| Mode M9 | |||
|---|---|---|---|
| Quadrant | BADHDUFLAG | Total packets | Discarded packets |
| A | 0 | 40 | 0 |
| B | 0 | 41 | 0 |
| C | 0 | 41 | 0 |
| D | 0 | 41 | 0 |
| Quadrant | Total seconds | Saturated seconds | Saturation percentage |
|---|---|---|---|
| A | 11128 | 253 | 2.273544% |
| B | 11128 | 99 | 0.889648% |
| C | 11128 | 10 | 0.089863% |
| D | 11128 | 3427 | 30.796190% |
Noise dominated data is calculated using 1-second bins in cleaned event files. If a bin has >2000 counts, and if more than 50% of those come from <1% of pixels, then it is considered to be noise-dominated and hence unusable.
| Quadrant | # 1 sec bins | Bins with >0 counts | Bins with >2000 counts | High rate bins dominated by noise | Noise dominated (total time) | Noise dominated (detector-on time) | Marked lightcurve |
|---|---|---|---|---|---|---|---|
| A | 16187 | 11131 | 170 | 170 | 1.05% | 1.53% | 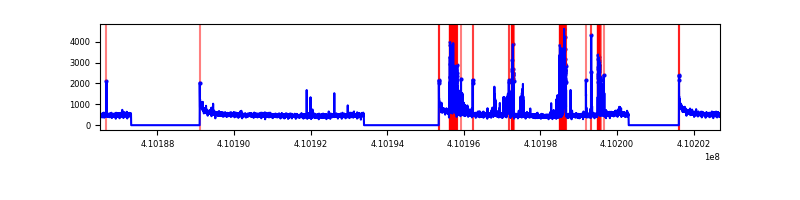 |
| B | 16187 | 11131 | 52 | 52 | 0.32% | 0.47% | 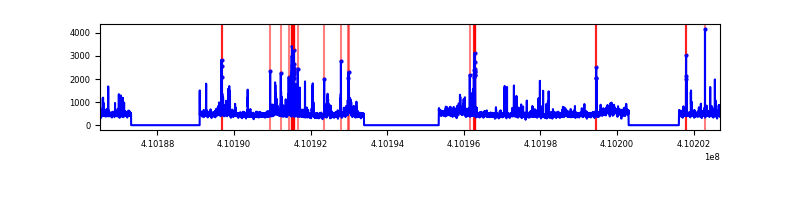 |
| C | 16187 | 11131 | 2 | 2 | 0.01% | 0.02% | 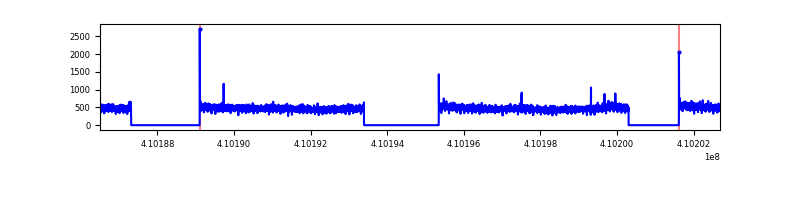 |
| D | 16187 | 11131 | 2931 | 2931 | 18.11% | 26.33% | 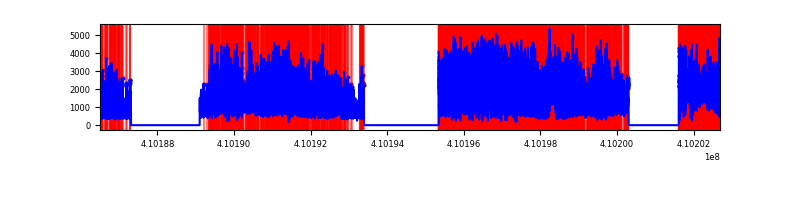 |
Top three noisy pixels from each quadrant. If the there are fewer than three noisy pixels in the level2.evt file, extra rows are filled as -1
| Pixel properties | Quadrant properties | ||||||
|---|---|---|---|---|---|---|---|
| Quadrant | DetID | PixID | Counts | Sigma | Mean | Median | Sigma |
| A | 13 | 248 | 865796 | 3459.6 | 1228 | 1204 | 249.9 |
| A | 10 | 83 | 787483 | 3146.24 | 1228 | 1204 | 249.9 |
| A | 13 | 254 | 15514 | 57.26 | 1228 | 1204 | 249.9 |
| B | 5 | 172 | 560427 | 2364.78 | 1226 | 1193 | 236.5 |
| B | 5 | 184 | 187997 | 789.92 | 1226 | 1193 | 236.5 |
| B | 0 | 190 | 185264 | 778.36 | 1226 | 1193 | 236.5 |
| C | 15 | 214 | 496509 | 1758.2 | 1206 | 1211 | 281.7 |
| C | 3 | 233 | 20095 | 67.03 | 1206 | 1211 | 281.7 |
| C | 0 | 10 | 17688 | 58.49 | 1206 | 1211 | 281.7 |
| D | 12 | 235 | 10657037 | 40832.85 | 1066 | 1034 | 261.0 |
| D | 5 | 222 | 862270 | 3300.18 | 1066 | 1034 | 261.0 |
| D | 12 | 227 | 600226 | 2296.05 | 1066 | 1034 | 261.0 |
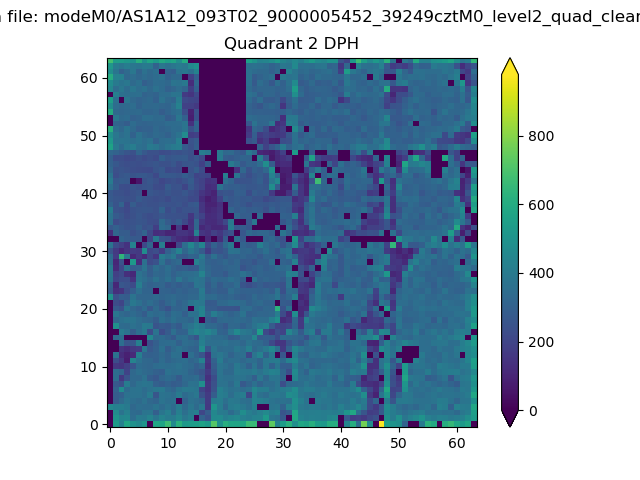
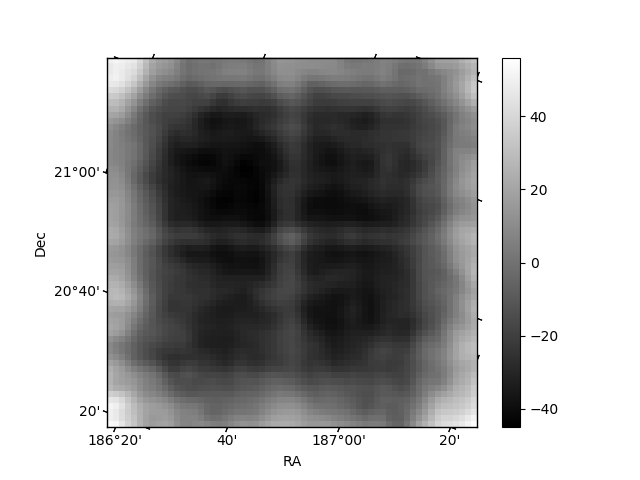
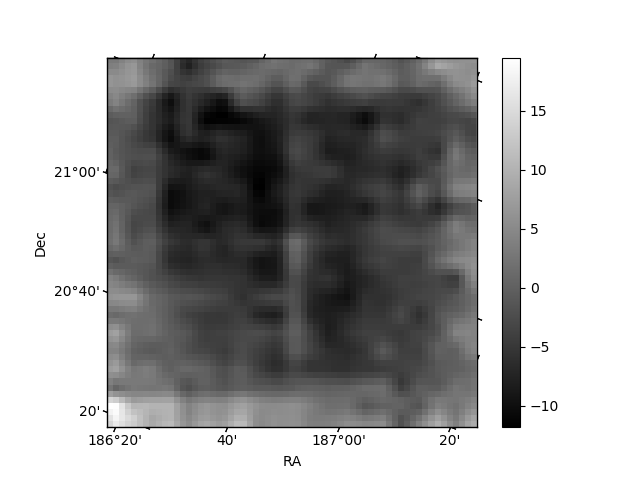
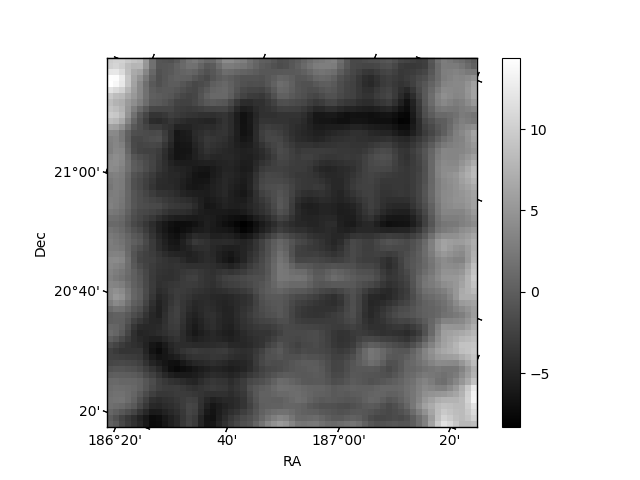
Histogram calculated using DETX and DETY for each event in the final _common_clean file
| Quadrant A | 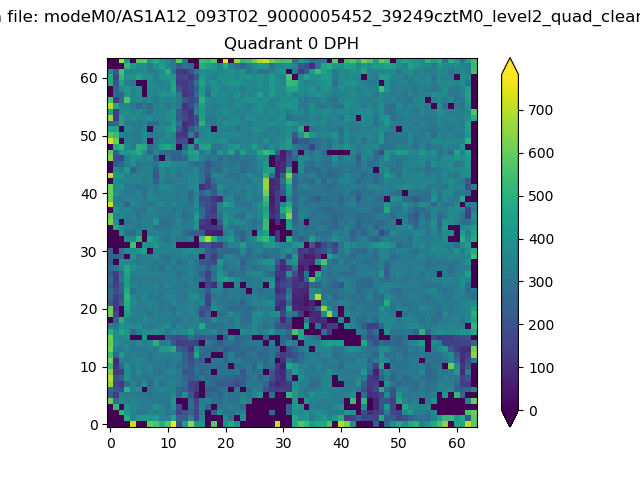 |
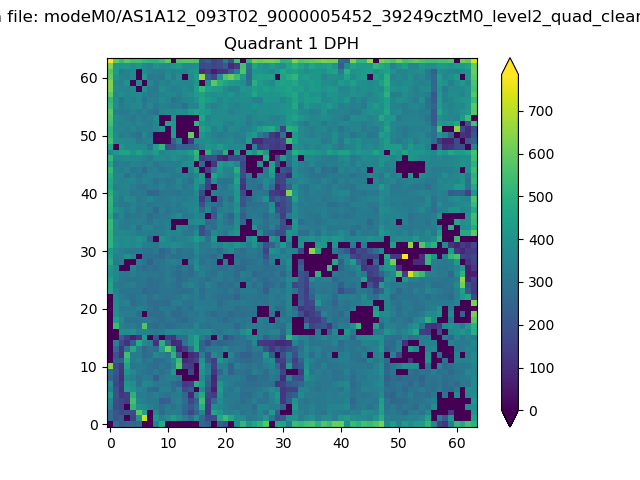 |
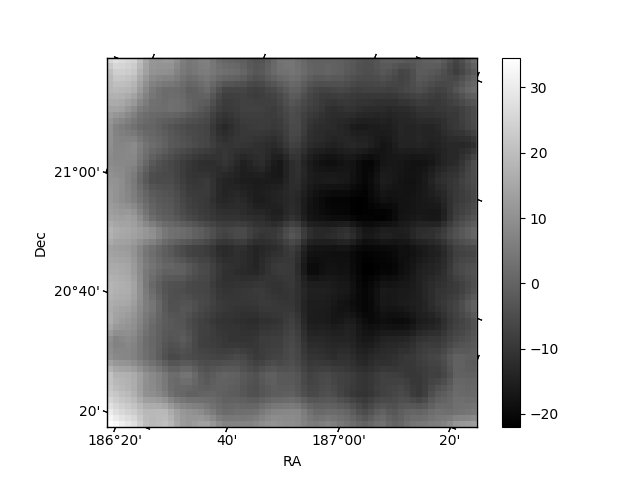
Quadrant B |
|---|---|---|---|
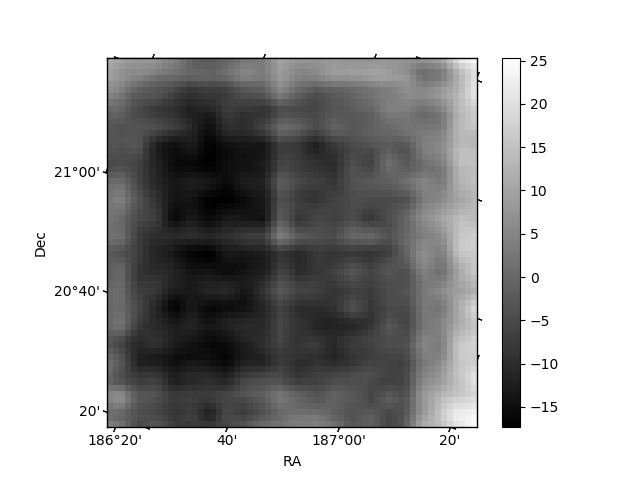
| Quadrant D | 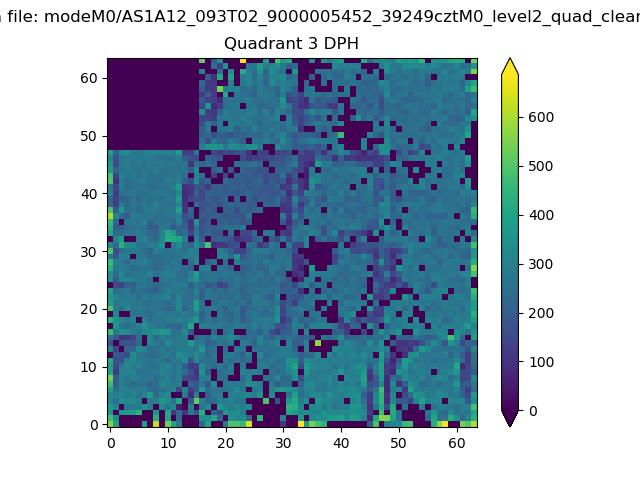 |
 |
Quadrant C |
| Plot type | Count rate plots | Images |
|---|---|---|
| Comparison with Poisson distribution Blue bars denote a histogram of data divided into 1 sec bins. Red curve is a Poisson curve with rate = median count rate of data. |
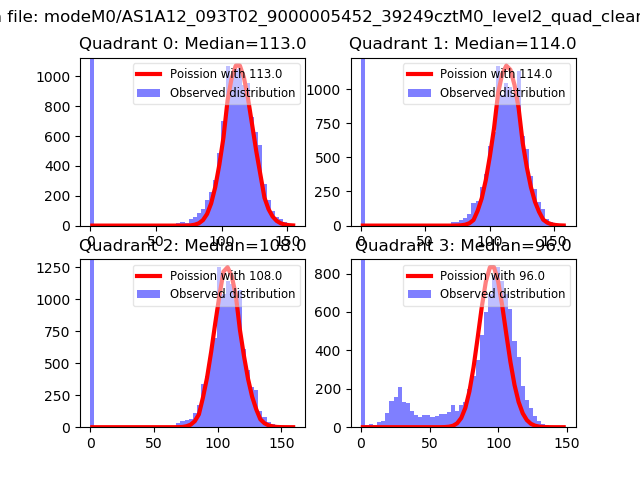 |
 |
| Quadrant-wise count rates Data is divided into 100 sec bins |
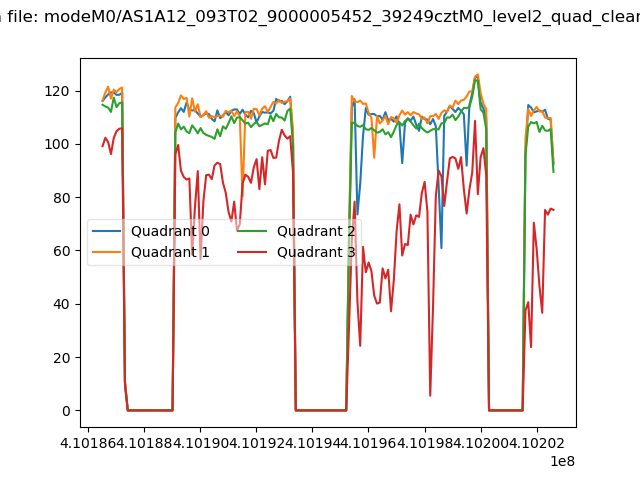 |
|
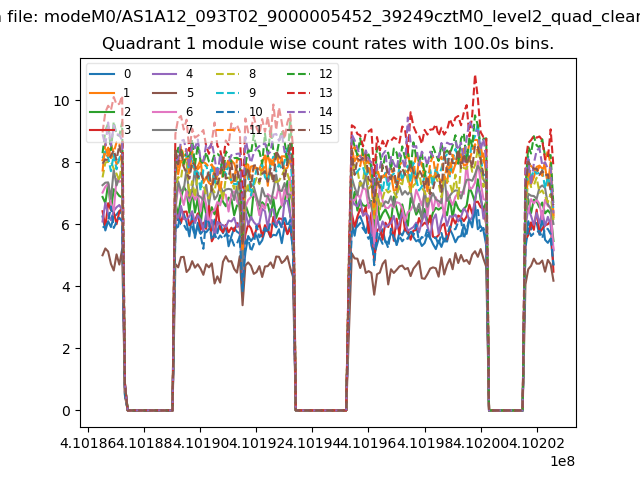
| Module-wise count rates for Quadrant A Data is divided into 100 sec bins |
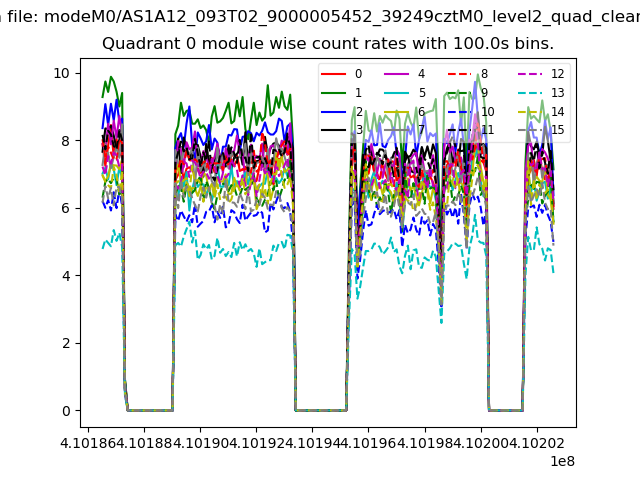 |
 |
| Module-wise count rates for Quadrant B Data is divided into 100 sec bins |
 |
 |
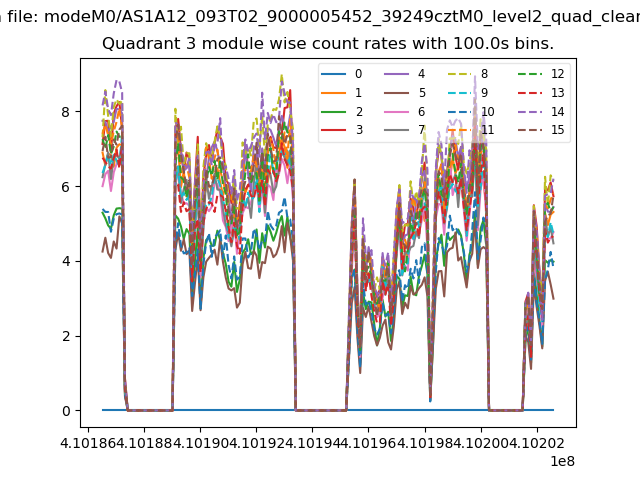
| Module-wise count rates for Quadrant C Data is divided into 100 sec bins |
 |
 |
| Module-wise count rates for Quadrant D Data is divided into 100 sec bins |
 |
 |
| Parameter | Plot |
|---|---|
| CZT HV Monitor | 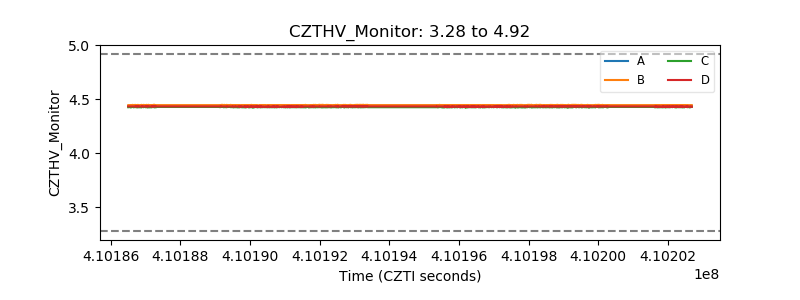 |
| D_VDD | 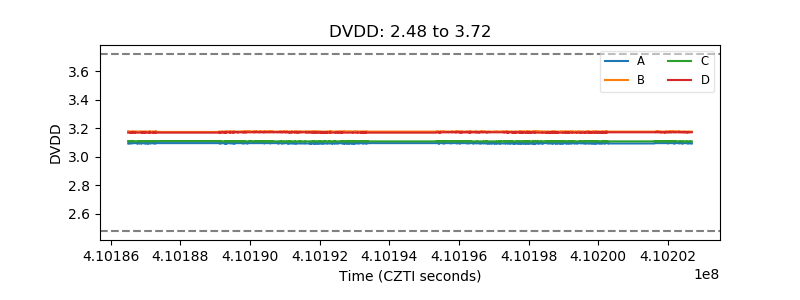 |
| Temperature 1 | 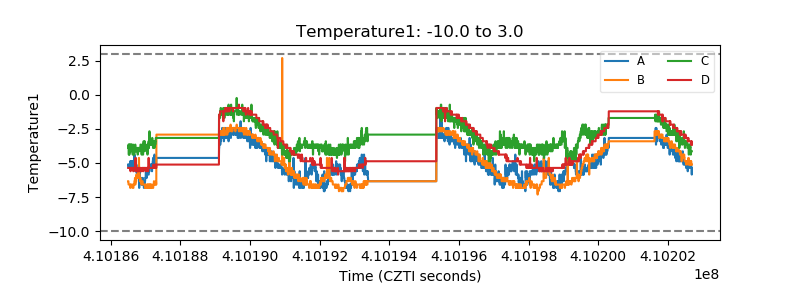 |
| Veto HV Monitor | 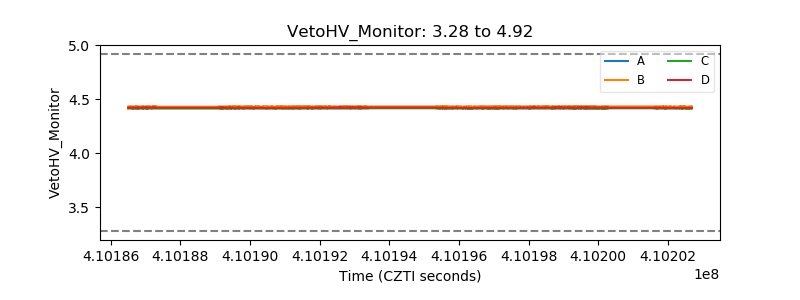 |
| Veto LLD | 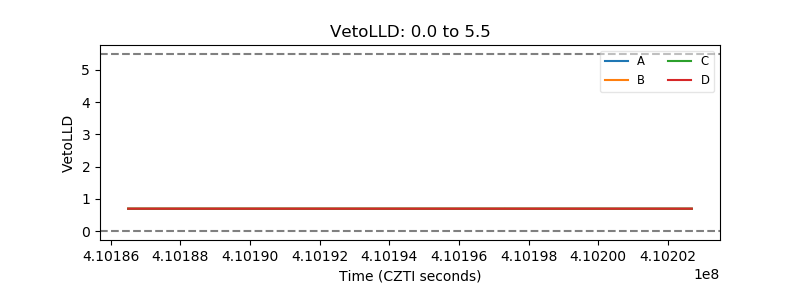 |
| Alpha Counter | 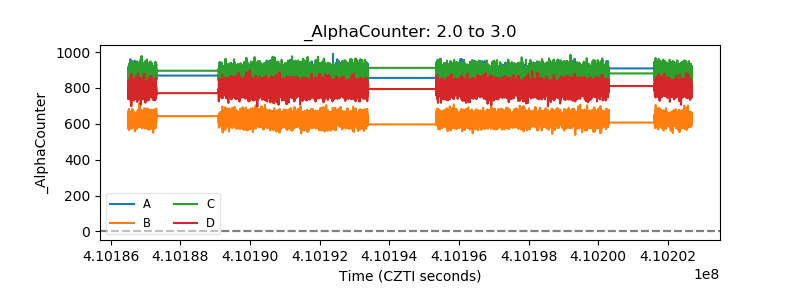 |
| _CPM_Rate | 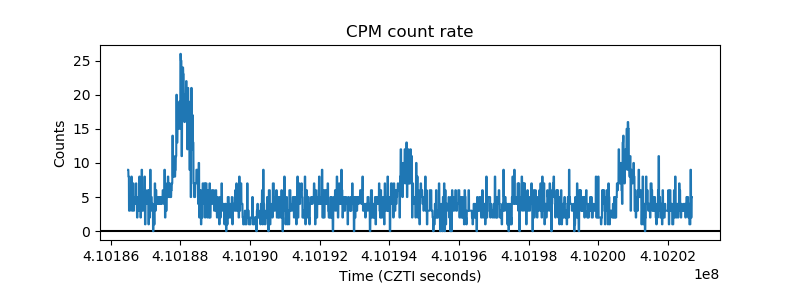 |
| CZT Counter | 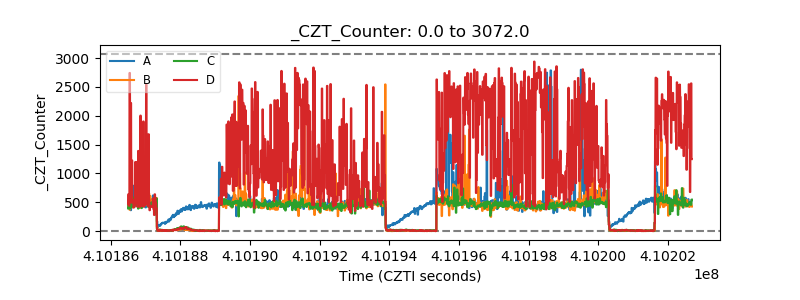 |
| +2.5 Volts monitor | 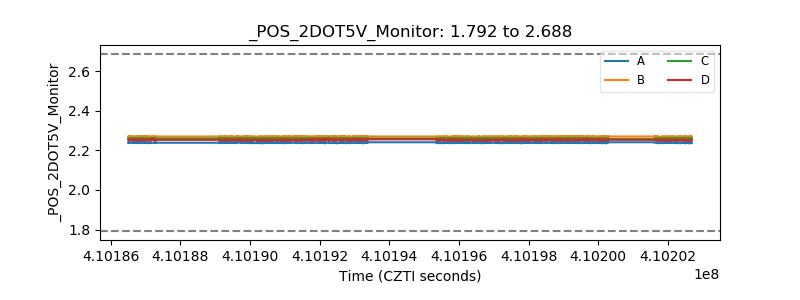 |
| +5 Volts monitor | 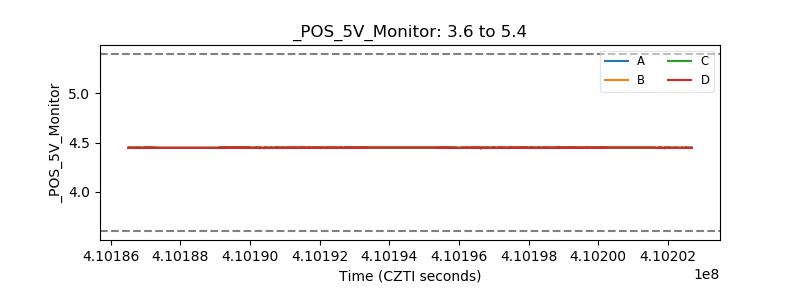 |
| _ROLL_ROT | 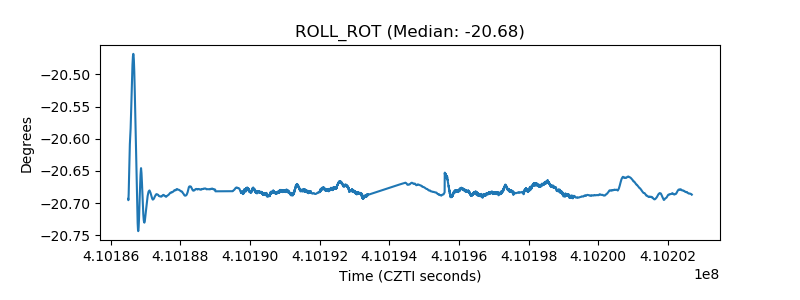 |
| _Roll_DEC | 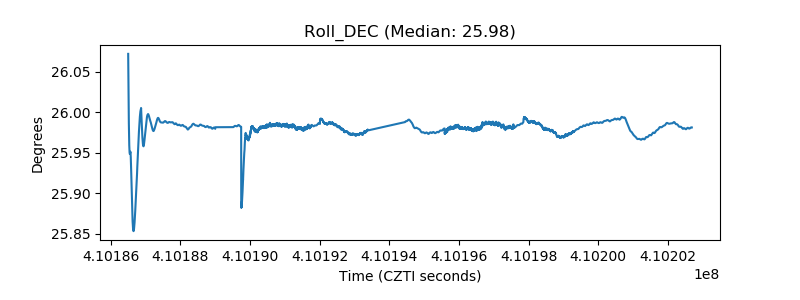 |
| _Roll_RA | 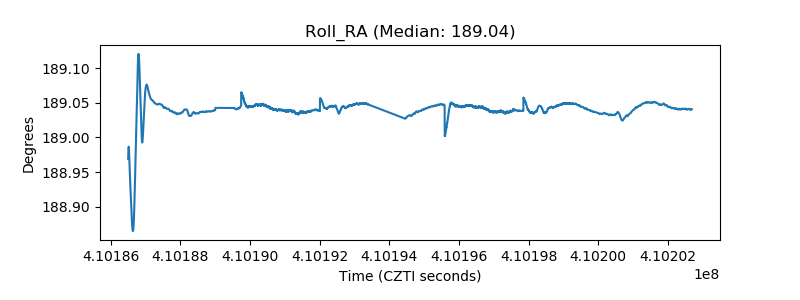 |
| Veto Counter | 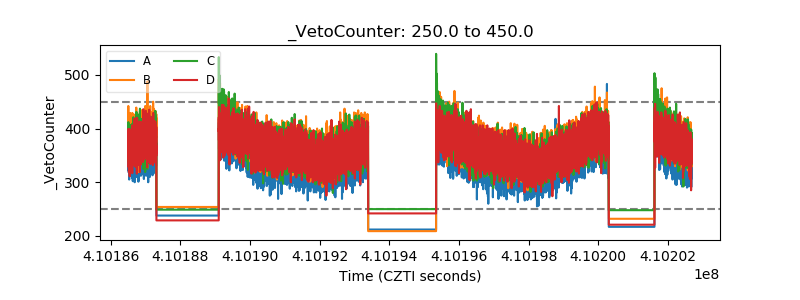 |