| Param | Original file | Final file |
|---|---|---|
| Filename | modeM0/AS1A12_093T02_9000005452_39250cztM0_level2.fits | modeM0/AS1A12_093T02_9000005452_39250cztM0_level2_quad_clean.evt |
| Size (bytes) | 535,072,320 | 94,821,120 |
| Size | 510.3 MB | 90.4 MB |
| Events in quadrant A | 3,399,845 | 667,330 |
| Events in quadrant B | 3,754,350 | 658,809 |
| Events in quadrant C | 2,886,099 | 651,929 |
| Events in quadrant D | 9,295,905 | 469,797 |
| Mode M0 | |||
|---|---|---|---|
| Quadrant | BADHDUFLAG | Total packets | Discarded packets |
| A | 0 | 13896 | 3 |
| B | 0 | 15133 | 2 |
| C | 0 | 12272 | 2 |
| D | 0 | 31796 | 2 |
| Mode SS | |||
|---|---|---|---|
| Quadrant | BADHDUFLAG | Total packets | Discarded packets |
| A | 0 | 122 | 0 |
| B | 0 | 122 | 0 |
| C | 0 | 122 | 0 |
| D | 0 | 122 | 0 |
| Mode M9 | |||
|---|---|---|---|
| Quadrant | BADHDUFLAG | Total packets | Discarded packets |
| A | 0 | 21 | 0 |
| B | 0 | 21 | 0 |
| C | 0 | 21 | 0 |
| D | 0 | 22 | 0 |
| Quadrant | Total seconds | Saturated seconds | Saturation percentage |
|---|---|---|---|
| A | 6059 | 90 | 1.485394% |
| B | 6059 | 283 | 4.670738% |
| C | 6059 | 7 | 0.115531% |
| D | 6059 | 1885 | 31.110744% |
Noise dominated data is calculated using 1-second bins in cleaned event files. If a bin has >2000 counts, and if more than 50% of those come from <1% of pixels, then it is considered to be noise-dominated and hence unusable.
| Quadrant | # 1 sec bins | Bins with >0 counts | Bins with >2000 counts | High rate bins dominated by noise | Noise dominated (total time) | Noise dominated (detector-on time) | Marked lightcurve |
|---|---|---|---|---|---|---|---|
| A | 7342 | 6060 | 70 | 70 | 0.95% | 1.16% | 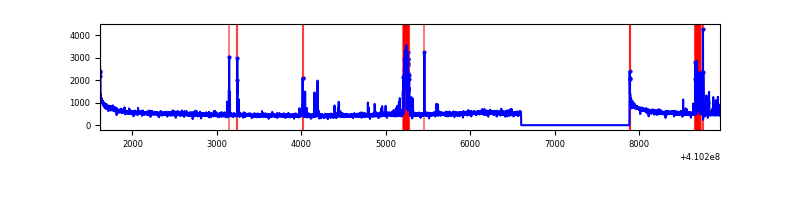 |
| B | 7342 | 6060 | 202 | 202 | 2.75% | 3.33% | 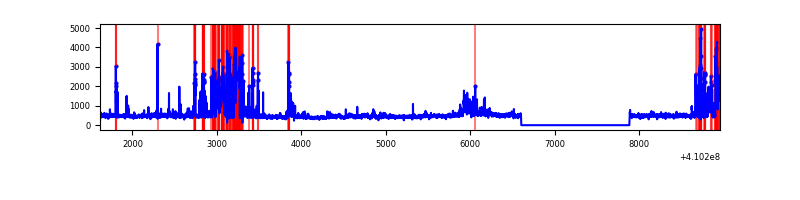 |
| C | 7342 | 6060 | 1 | 1 | 0.01% | 0.02% | 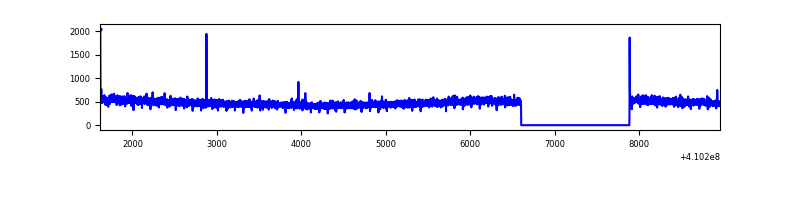 |
| D | 7342 | 6060 | 1669 | 1669 | 22.73% | 27.54% | 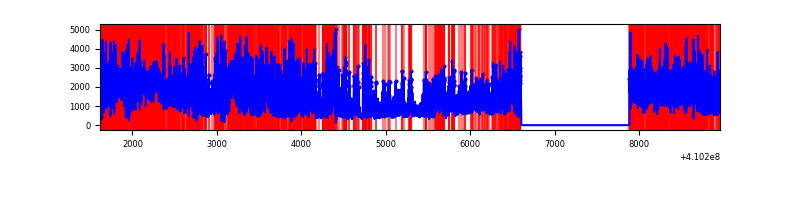 |
Top three noisy pixels from each quadrant. If the there are fewer than three noisy pixels in the level2.evt file, extra rows are filled as -1
| Pixel properties | Quadrant properties | ||||||
|---|---|---|---|---|---|---|---|
| Quadrant | DetID | PixID | Counts | Sigma | Mean | Median | Sigma |
| A | 10 | 83 | 459717 | 3326.34 | 674 | 661 | 138.0 |
| A | 13 | 248 | 315227 | 2279.36 | 674 | 661 | 138.0 |
| A | 10 | 248 | 8504 | 56.83 | 674 | 661 | 138.0 |
| B | 5 | 172 | 706820 | 5495.97 | 657 | 637 | 128.5 |
| B | 5 | 255 | 254909 | 1978.91 | 657 | 637 | 128.5 |
| B | 5 | 184 | 134090 | 1038.62 | 657 | 637 | 128.5 |
| C | 15 | 214 | 271505 | 1729.77 | 662 | 665 | 156.6 |
| C | 3 | 233 | 18670 | 114.99 | 662 | 665 | 156.6 |
| C | 0 | 10 | 9172 | 54.33 | 662 | 665 | 156.6 |
| D | 12 | 235 | 6369849 | 43819.87 | 594 | 576 | 145.4 |
| D | 5 | 222 | 329617 | 2263.76 | 594 | 576 | 145.4 |
| D | 2 | 250 | 114875 | 786.36 | 594 | 576 | 145.4 |
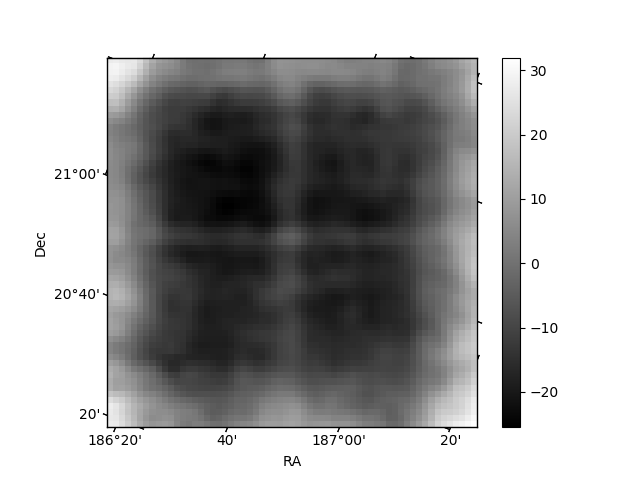
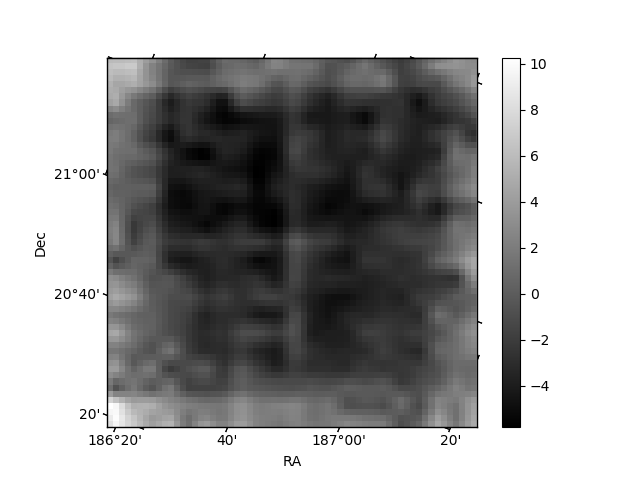
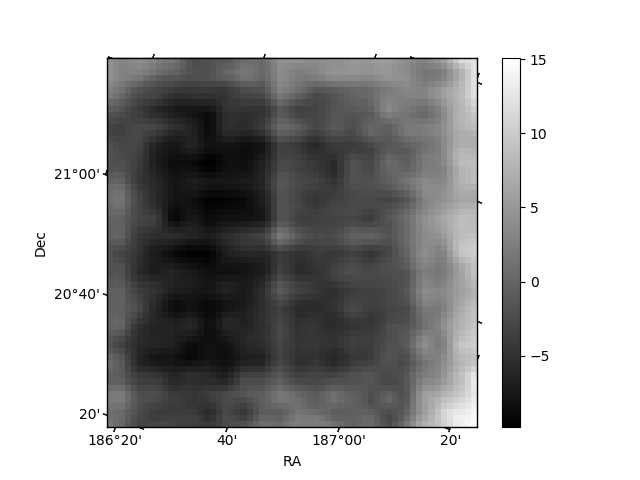
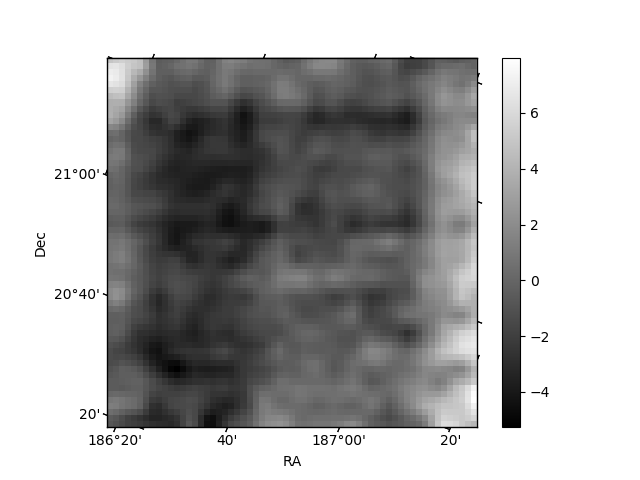
Histogram calculated using DETX and DETY for each event in the final _common_clean file
| Quadrant A | 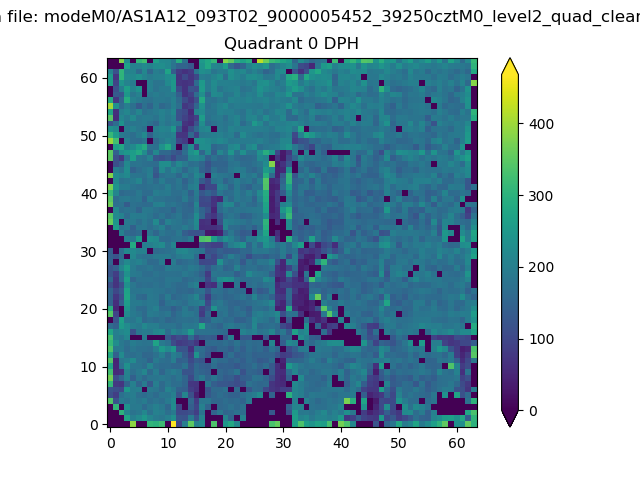 |
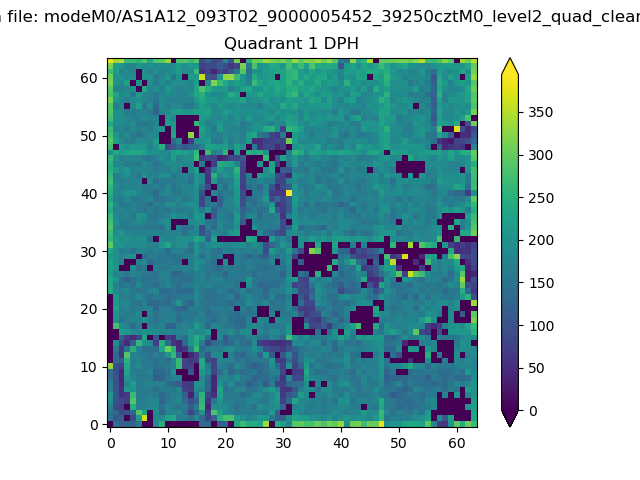 |
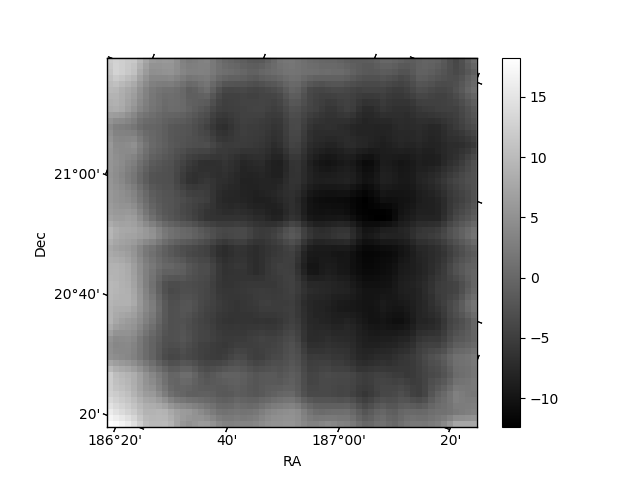
Quadrant B |
|---|---|---|---|
| Quadrant D | 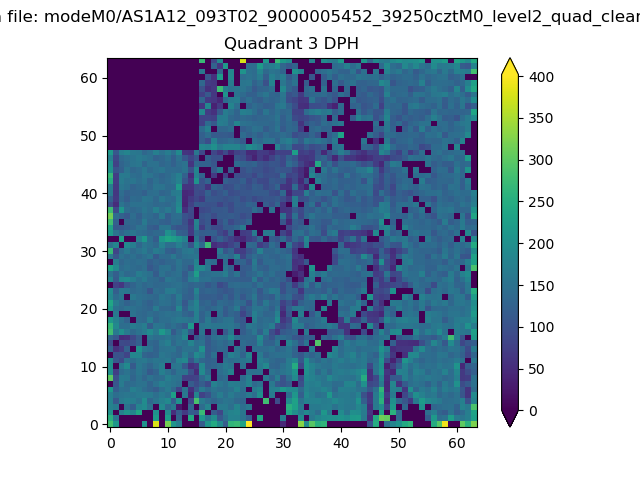 |
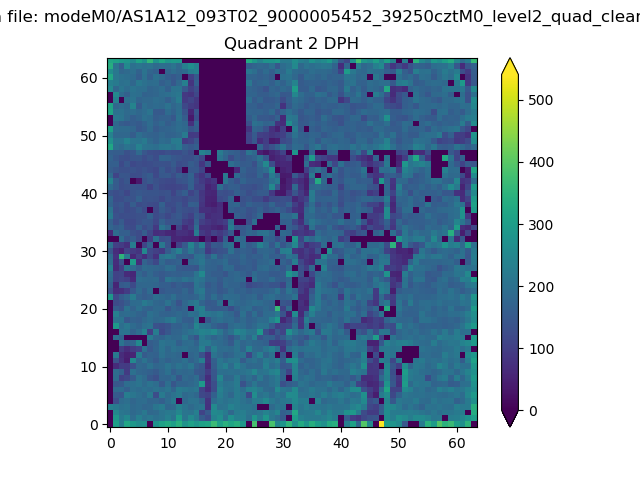 |
Quadrant C |
| Plot type | Count rate plots | Images |
|---|---|---|
| Comparison with Poisson distribution Blue bars denote a histogram of data divided into 1 sec bins. Red curve is a Poisson curve with rate = median count rate of data. |
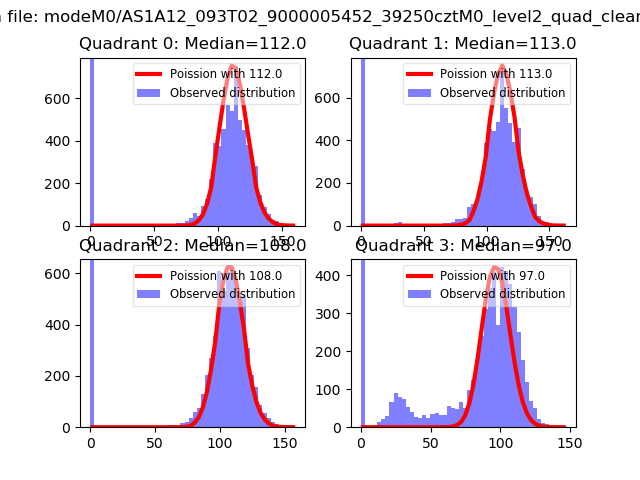 |
 |
| Quadrant-wise count rates Data is divided into 100 sec bins |
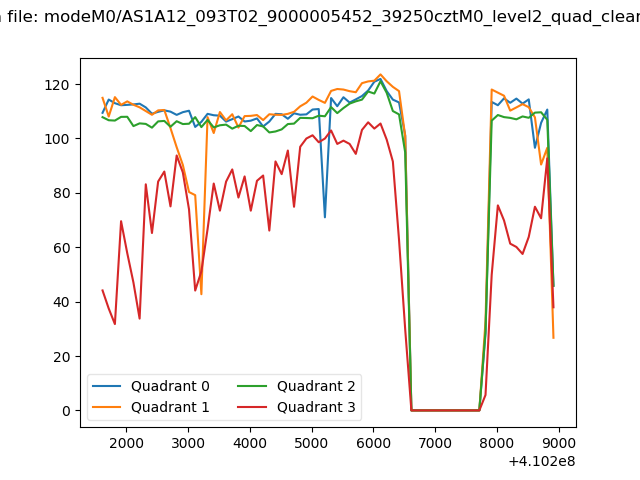 |
|
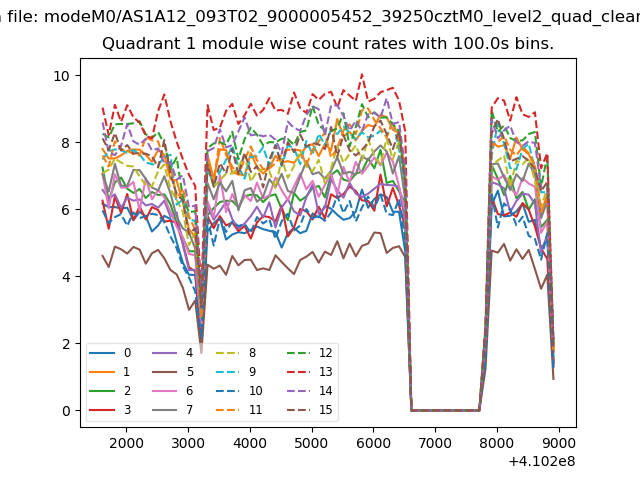
| Module-wise count rates for Quadrant A Data is divided into 100 sec bins |
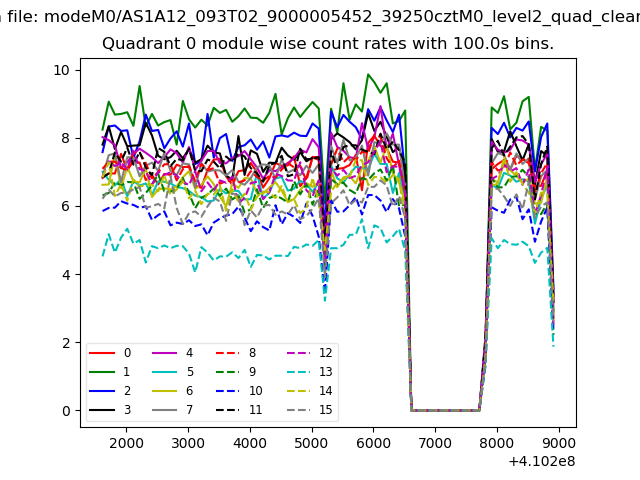 |
 |
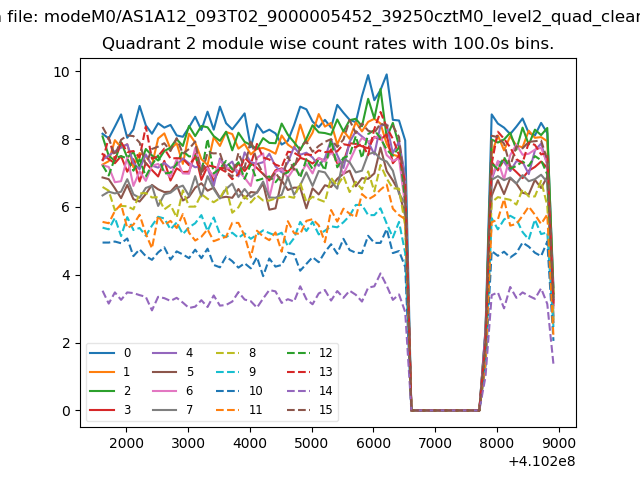
| Module-wise count rates for Quadrant B Data is divided into 100 sec bins |
 |
 |
| Module-wise count rates for Quadrant C Data is divided into 100 sec bins |
 |
 |
| Module-wise count rates for Quadrant D Data is divided into 100 sec bins |
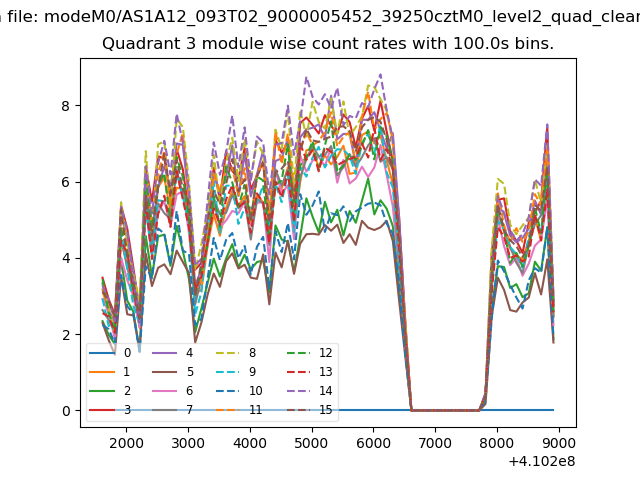 |
 |
| Parameter | Plot |
|---|---|
| CZT HV Monitor | 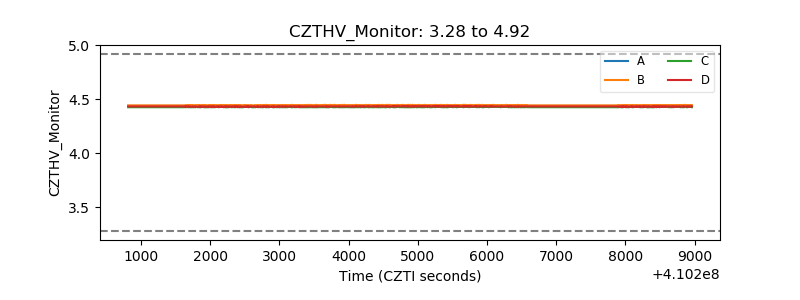 |
| D_VDD | 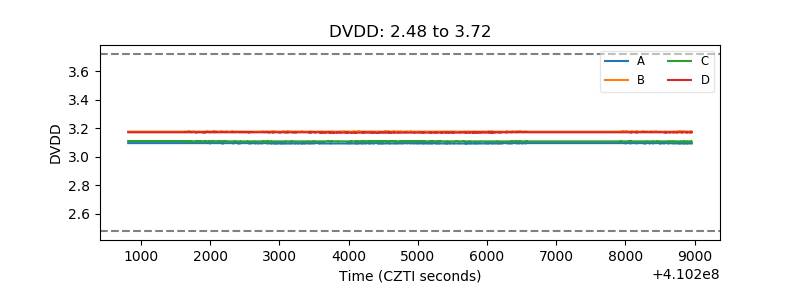 |
| Temperature 1 | 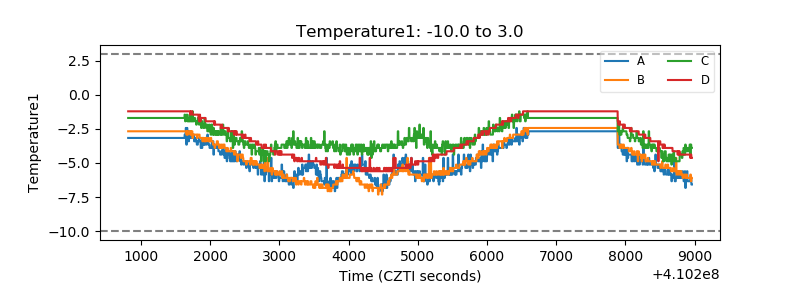 |
| Veto HV Monitor |  |
| Veto LLD | 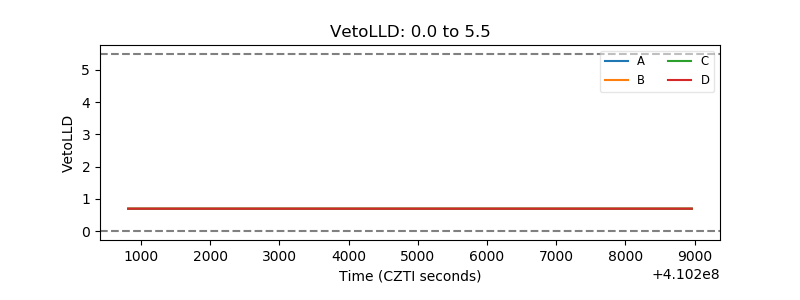 |
| Alpha Counter | 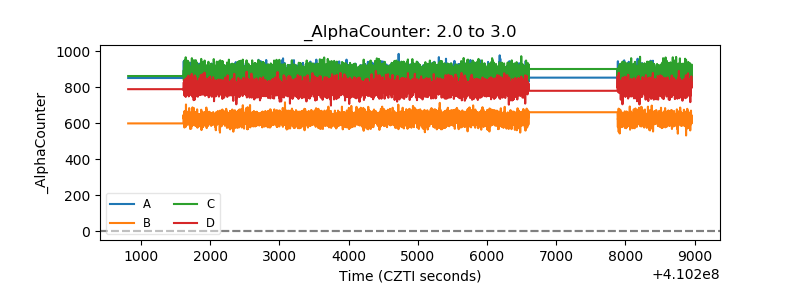 |
| _CPM_Rate | 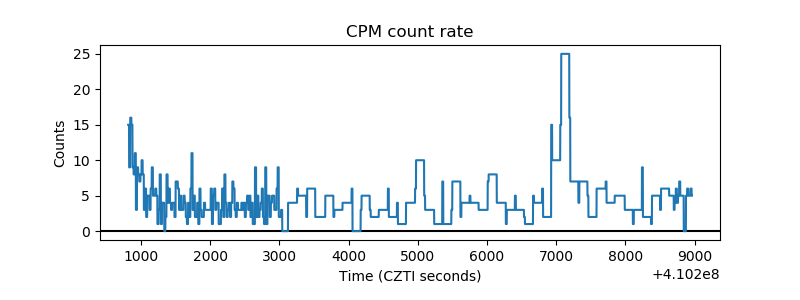 |
| CZT Counter | 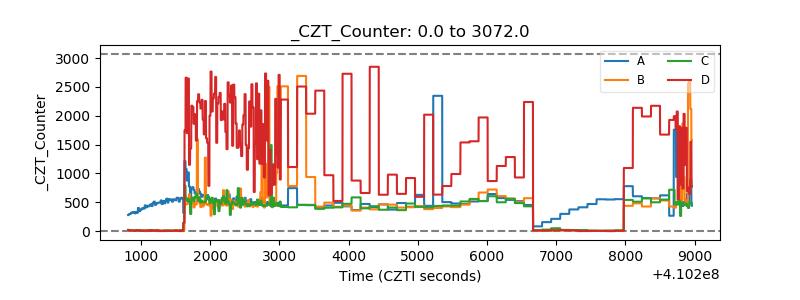 |
| +2.5 Volts monitor | 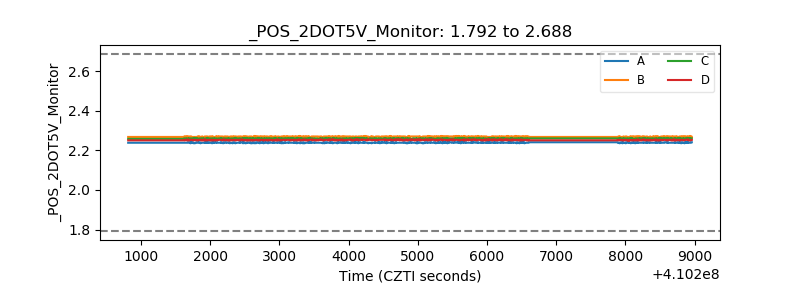 |
| +5 Volts monitor | 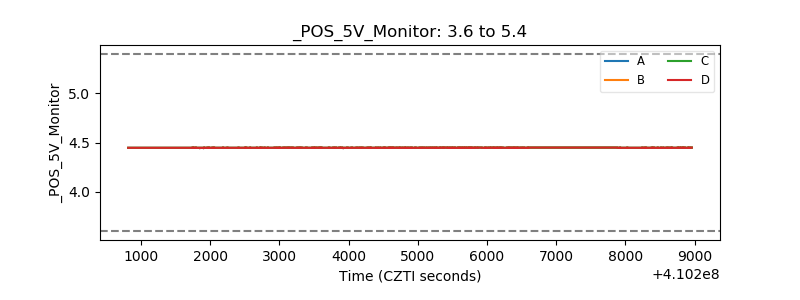 |
| _ROLL_ROT | 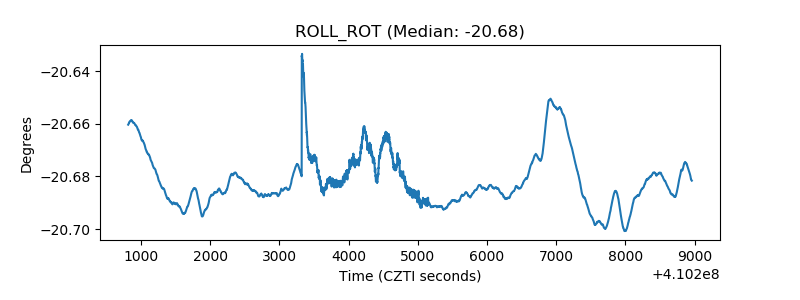 |
| _Roll_DEC | 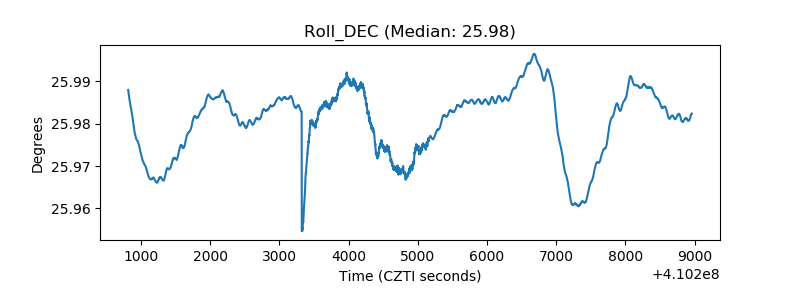 |
| _Roll_RA | 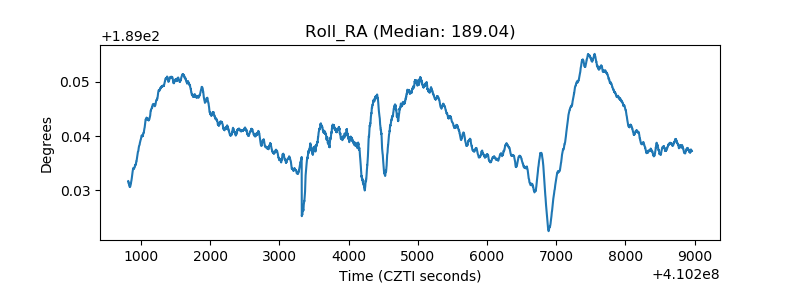 |
| Veto Counter | 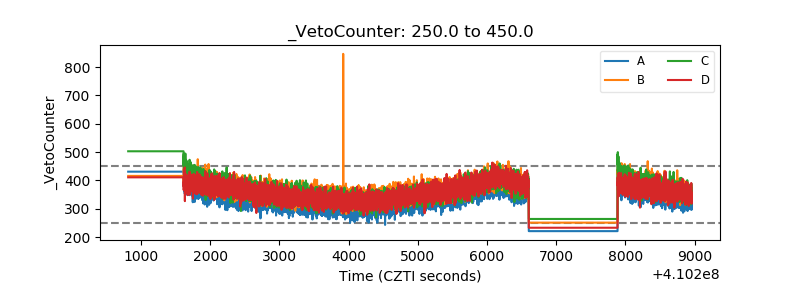 |