| Param | Original file | Final file |
|---|---|---|
| Filename | modeM0/AS1A12_093T02_9000005452_39254cztM0_level2.fits | modeM0/AS1A12_093T02_9000005452_39254cztM0_level2_quad_clean.evt |
| Size (bytes) | 435,893,760 | 91,324,800 |
| Size | 415.7 MB | 87.1 MB |
| Events in quadrant A | 2,821,114 | 636,913 |
| Events in quadrant B | 4,087,369 | 628,230 |
| Events in quadrant C | 2,605,073 | 618,760 |
| Events in quadrant D | 6,185,363 | 488,294 |
| Mode M0 | |||
|---|---|---|---|
| Quadrant | BADHDUFLAG | Total packets | Discarded packets |
| A | 0 | 11948 | 3 |
| B | 0 | 15894 | 2 |
| C | 0 | 11317 | 2 |
| D | 0 | 22225 | 2 |
| Mode SS | |||
|---|---|---|---|
| Quadrant | BADHDUFLAG | Total packets | Discarded packets |
| A | 0 | 116 | 0 |
| B | 0 | 116 | 0 |
| C | 0 | 116 | 0 |
| D | 0 | 116 | 0 |
| Mode M9 | |||
|---|---|---|---|
| Quadrant | BADHDUFLAG | Total packets | Discarded packets |
| A | 0 | 29 | 0 |
| B | 0 | 29 | 0 |
| C | 0 | 29 | 0 |
| D | 0 | 30 | 0 |
| Quadrant | Total seconds | Saturated seconds | Saturation percentage |
|---|---|---|---|
| A | 5614 | 14 | 0.249377% |
| B | 5614 | 286 | 5.094407% |
| C | 5614 | 4 | 0.071250% |
| D | 5614 | 1020 | 18.168864% |
Noise dominated data is calculated using 1-second bins in cleaned event files. If a bin has >2000 counts, and if more than 50% of those come from <1% of pixels, then it is considered to be noise-dominated and hence unusable.
| Quadrant | # 1 sec bins | Bins with >0 counts | Bins with >2000 counts | High rate bins dominated by noise | Noise dominated (total time) | Noise dominated (detector-on time) | Marked lightcurve |
|---|---|---|---|---|---|---|---|
| A | 7346 | 5615 | 3 | 3 | 0.04% | 0.05% | 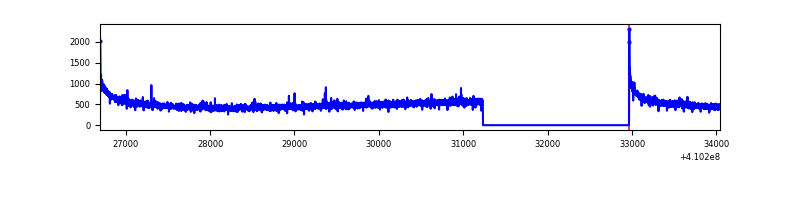 |
| B | 7346 | 5615 | 196 | 196 | 2.67% | 3.49% | 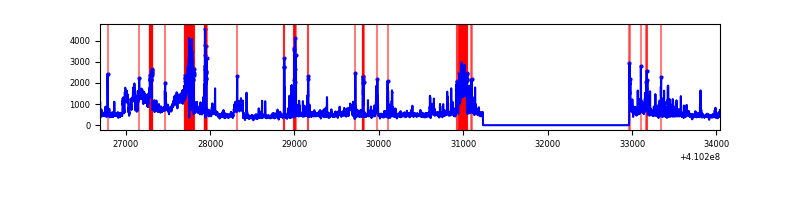 |
| C | 7346 | 5615 | 0 | 0 | 0.00% | 0.00% | 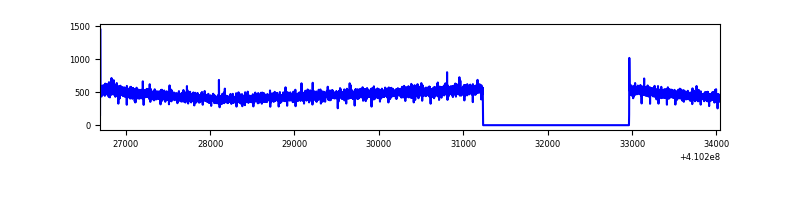 |
| D | 7346 | 5615 | 780 | 780 | 10.62% | 13.89% | 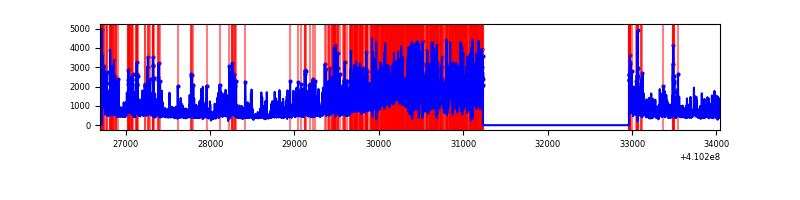 |
Top three noisy pixels from each quadrant. If the there are fewer than three noisy pixels in the level2.evt file, extra rows are filled as -1
| Pixel properties | Quadrant properties | ||||||
|---|---|---|---|---|---|---|---|
| Quadrant | DetID | PixID | Counts | Sigma | Mean | Median | Sigma |
| A | 10 | 83 | 431056 | 3400.14 | 616 | 603 | 126.6 |
| A | 13 | 254 | 6683 | 48.03 | 616 | 603 | 126.6 |
| A | 3 | 137 | 6661 | 47.85 | 616 | 603 | 126.6 |
| B | 5 | 184 | 1169850 | 10068.92 | 603 | 586 | 116.1 |
| B | 5 | 172 | 406993 | 3499.71 | 603 | 586 | 116.1 |
| B | 0 | 190 | 82278 | 703.48 | 603 | 586 | 116.1 |
| C | 15 | 214 | 252827 | 1789.93 | 601 | 604 | 140.9 |
| C | 0 | 10 | 5209 | 32.68 | 601 | 604 | 140.9 |
| C | 13 | 61 | 4140 | 25.09 | 601 | 604 | 140.9 |
| D | 12 | 235 | 3851523 | 28887.42 | 550 | 534 | 133.3 |
| D | 2 | 250 | 73243 | 545.41 | 550 | 534 | 133.3 |
| D | 12 | 227 | 38985 | 288.43 | 550 | 534 | 133.3 |
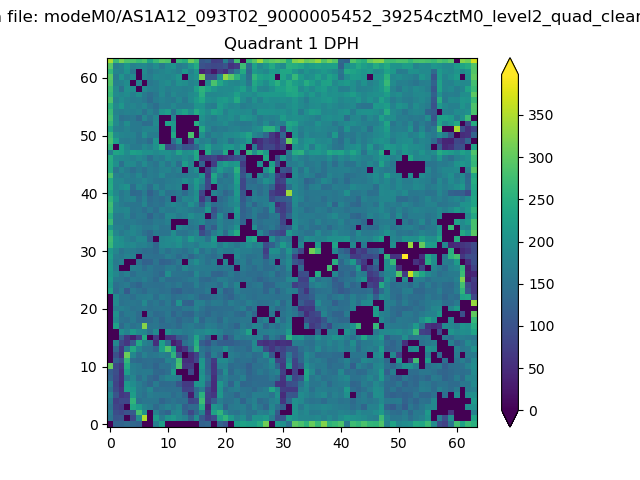
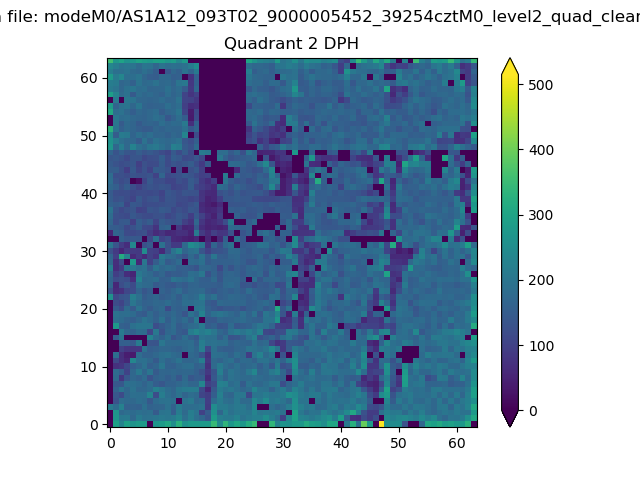
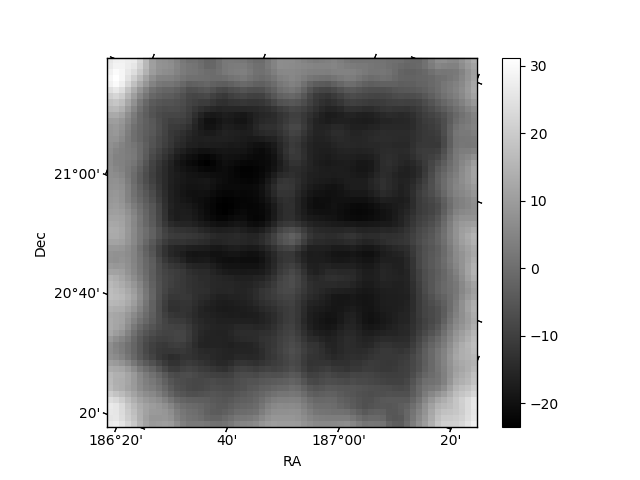
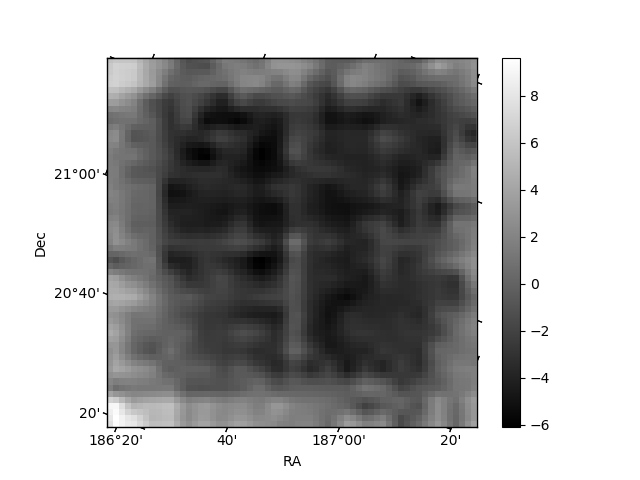
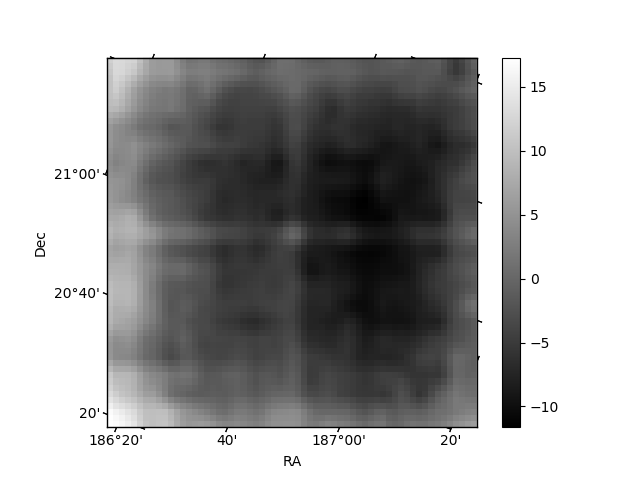
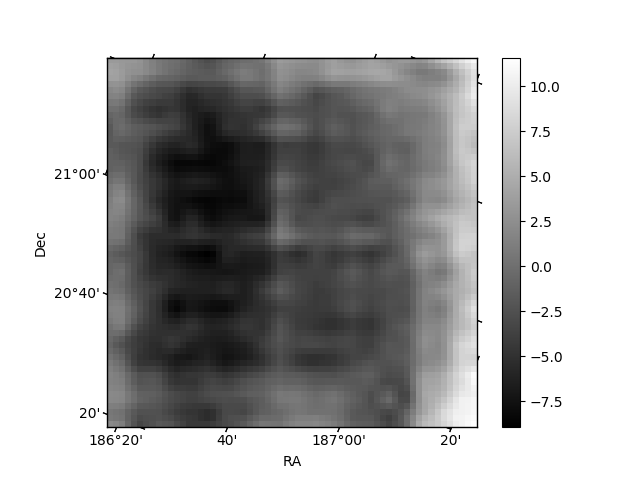
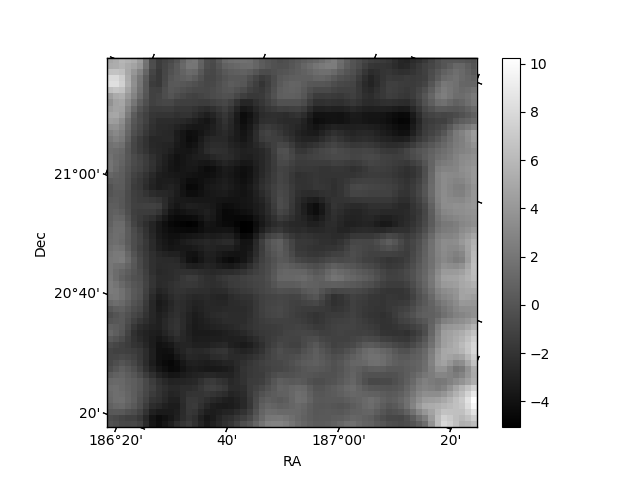
Histogram calculated using DETX and DETY for each event in the final _common_clean file
| Quadrant A | 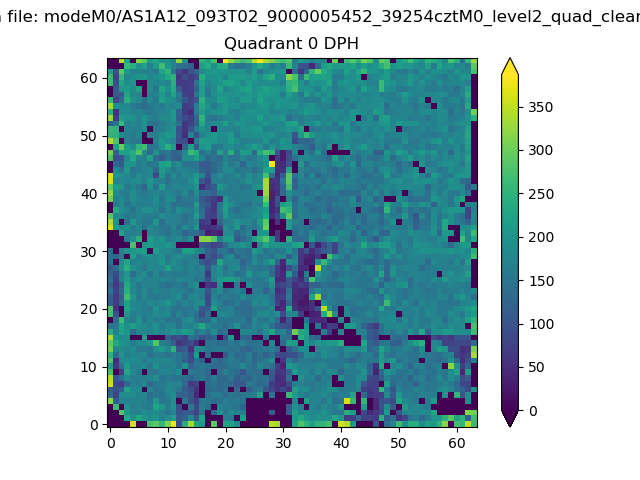 |
 |
Quadrant B |
|---|---|---|---|
| Quadrant D | 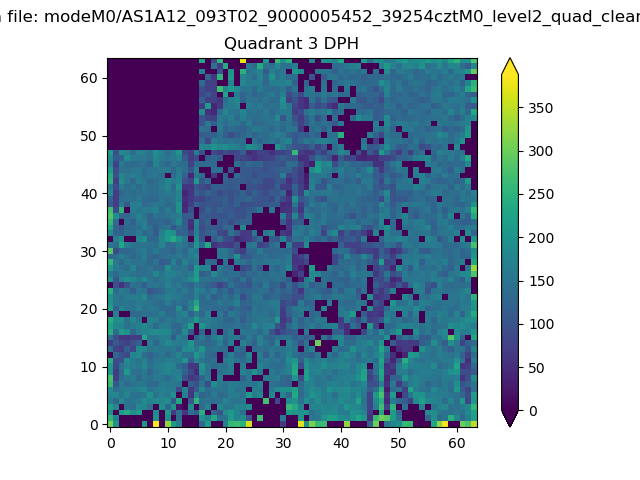 |
 |
Quadrant C |
| Plot type | Count rate plots | Images |
|---|---|---|
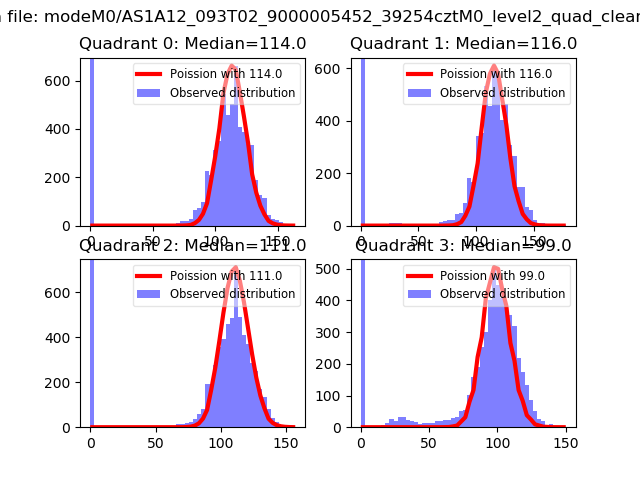
| Comparison with Poisson distribution Blue bars denote a histogram of data divided into 1 sec bins. Red curve is a Poisson curve with rate = median count rate of data. |
 |
 |
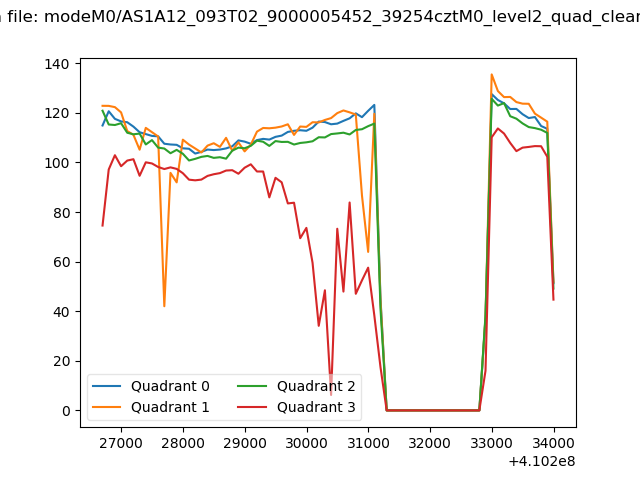
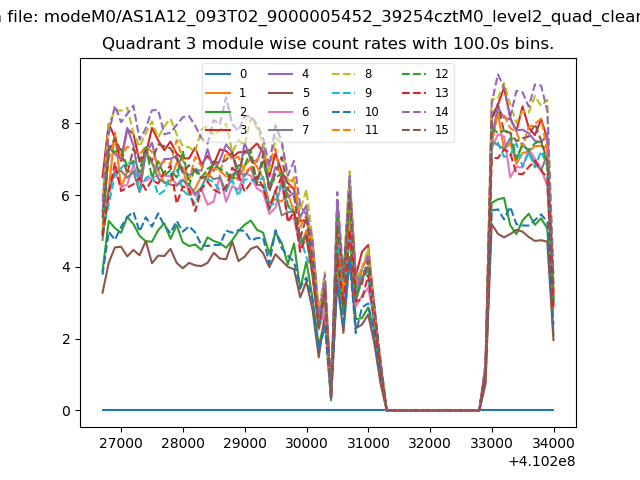
| Quadrant-wise count rates Data is divided into 100 sec bins |
 |
|
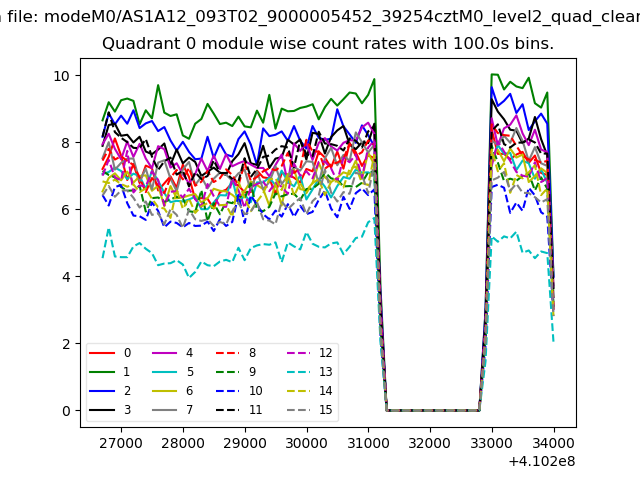
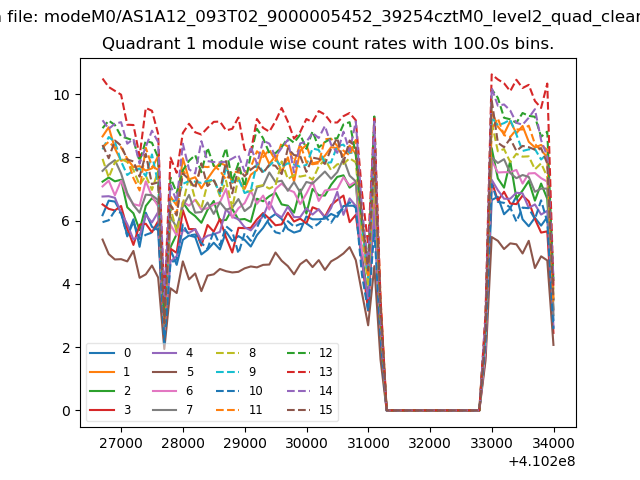
| Module-wise count rates for Quadrant A Data is divided into 100 sec bins |
 |
 |
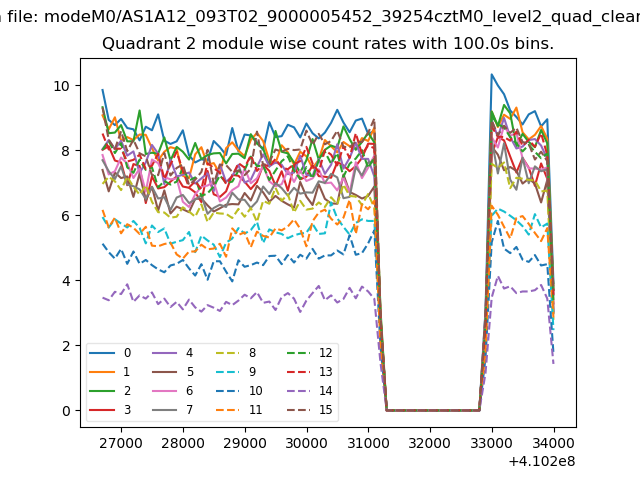
| Module-wise count rates for Quadrant B Data is divided into 100 sec bins |
 |
 |
| Module-wise count rates for Quadrant C Data is divided into 100 sec bins |
 |
 |
| Module-wise count rates for Quadrant D Data is divided into 100 sec bins |
 |
 |
| Parameter | Plot |
|---|---|
| CZT HV Monitor | 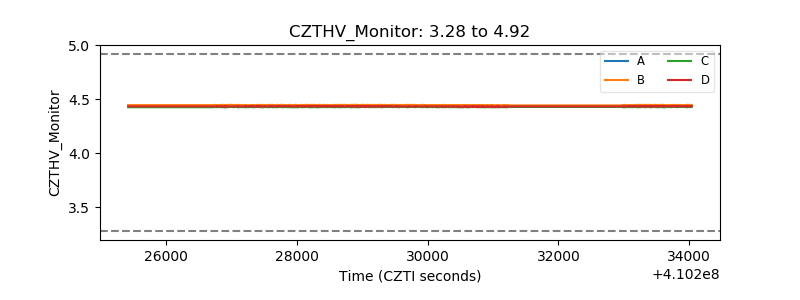 |
| D_VDD | 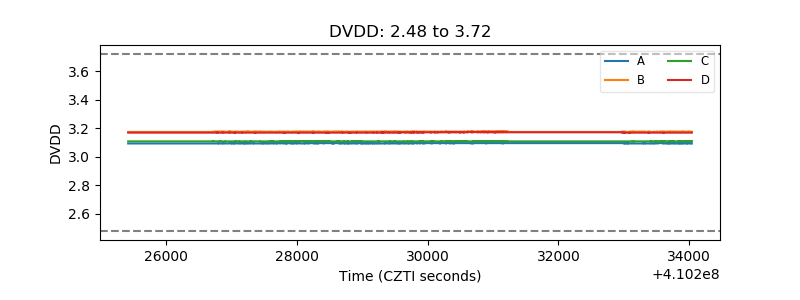 |
| Temperature 1 | 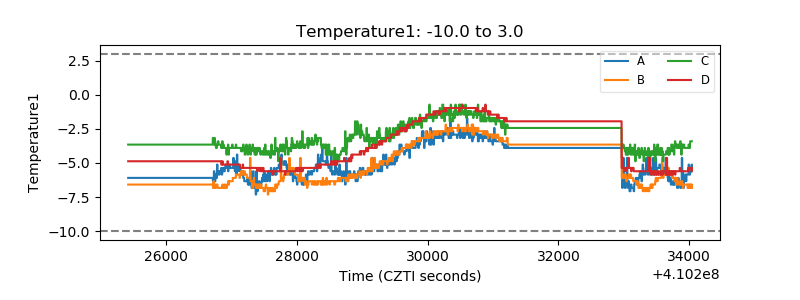 |
| Veto HV Monitor | 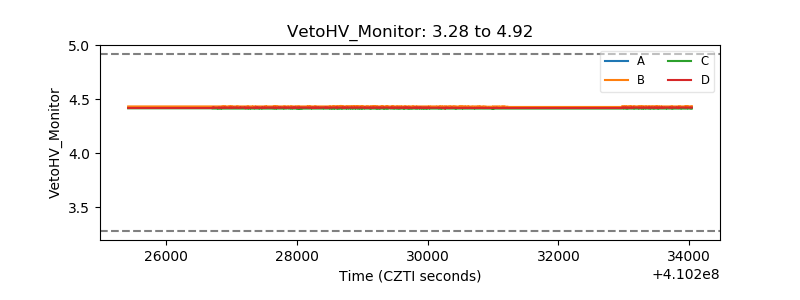 |
| Veto LLD | 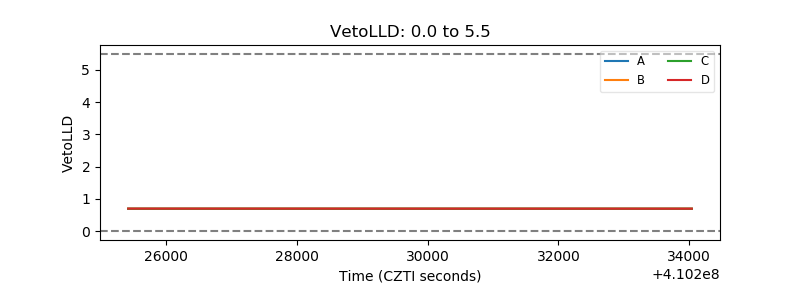 |
| Alpha Counter | 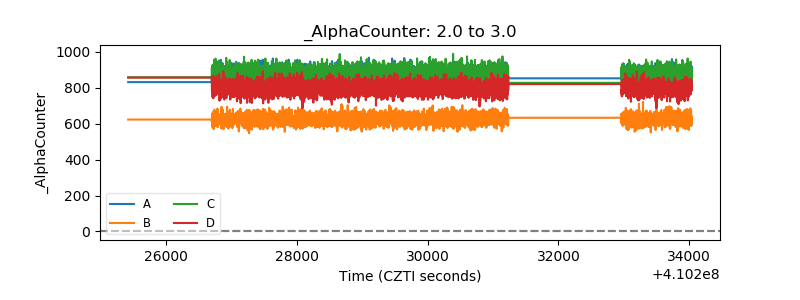 |
| _CPM_Rate | 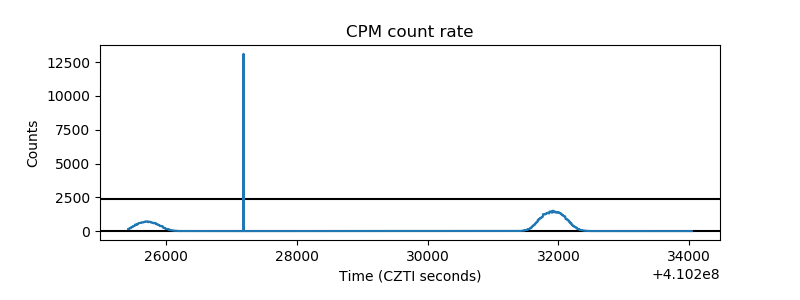 |
| CZT Counter | 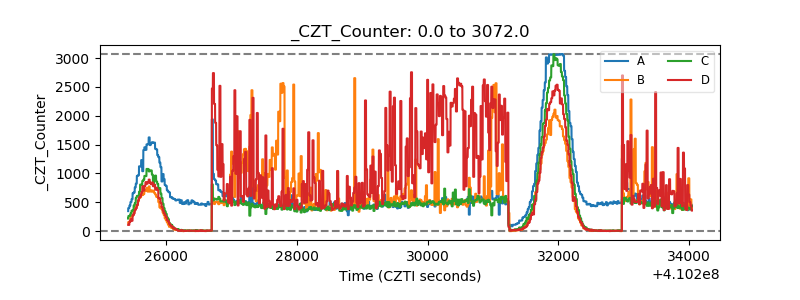 |
| +2.5 Volts monitor | 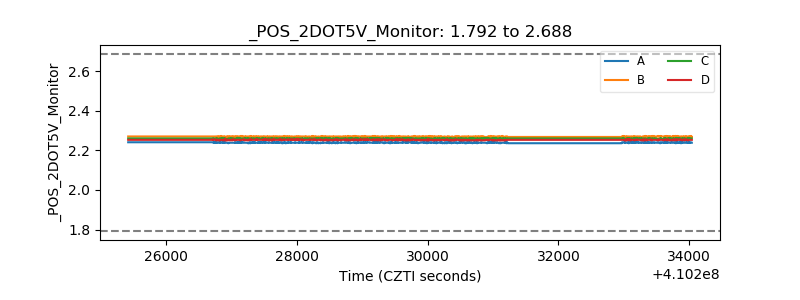 |
| +5 Volts monitor | 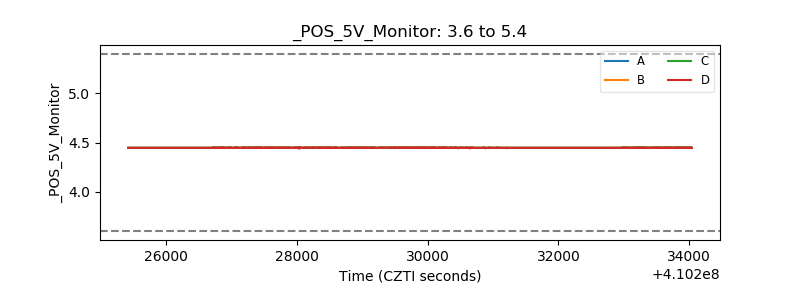 |
| _ROLL_ROT | 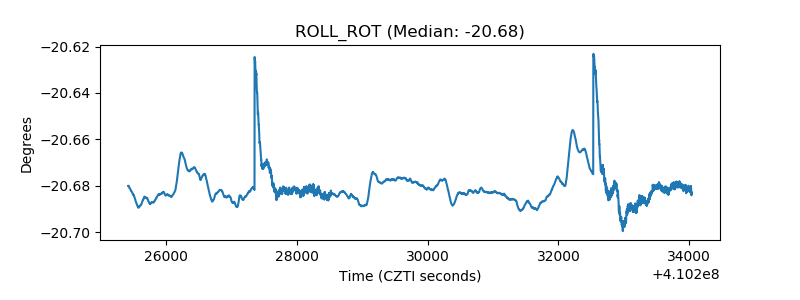 |
| _Roll_DEC | 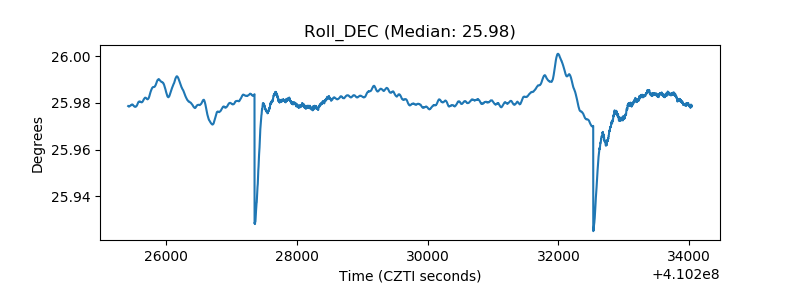 |
| _Roll_RA | 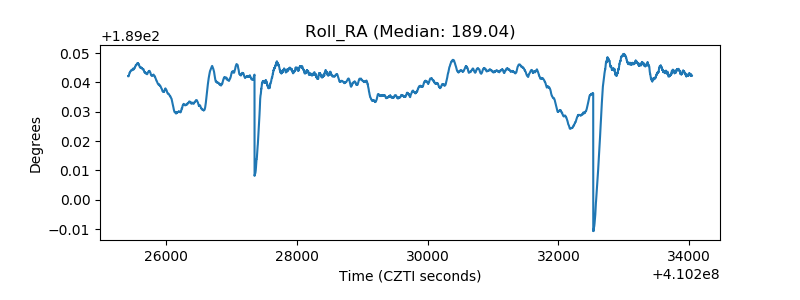 |
| Veto Counter | 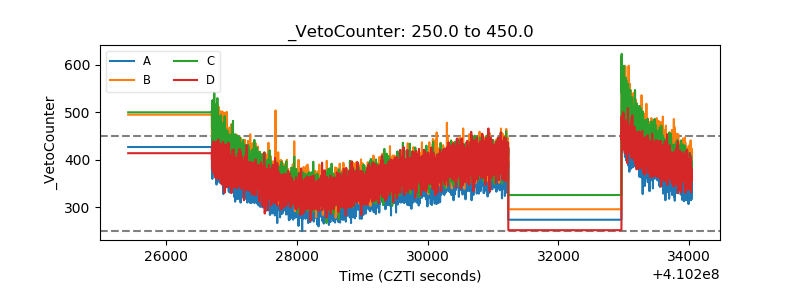 |