| Param | Original file | Final file |
|---|---|---|
| Filename | modeM0/AS1A12_093T02_9000005452_39257cztM0_level2.fits | modeM0/AS1A12_093T02_9000005452_39257cztM0_level2_quad_clean.evt |
| Size (bytes) | 2,174,696,640 | 457,859,520 |
| Size | 2.0 GB | 436.6 MB |
| Events in quadrant A | 14,396,241 | 3,193,267 |
| Events in quadrant B | 16,305,118 | 3,226,945 |
| Events in quadrant C | 13,162,222 | 3,119,820 |
| Events in quadrant D | 34,473,711 | 2,397,145 |
| Mode M0 | |||
|---|---|---|---|
| Quadrant | BADHDUFLAG | Total packets | Discarded packets |
| A | 0 | 60433 | 7 |
| B | 0 | 67255 | 6 |
| C | 0 | 56676 | 6 |
| D | 0 | 121978 | 6 |
| Mode SS | |||
|---|---|---|---|
| Quadrant | BADHDUFLAG | Total packets | Discarded packets |
| A | 0 | 572 | 0 |
| B | 0 | 572 | 0 |
| C | 0 | 572 | 0 |
| D | 0 | 572 | 0 |
| Mode M9 | |||
|---|---|---|---|
| Quadrant | BADHDUFLAG | Total packets | Discarded packets |
| A | 0 | 100 | 0 |
| B | 0 | 100 | 0 |
| C | 0 | 100 | 0 |
| D | 0 | 100 | 0 |
| Quadrant | Total seconds | Saturated seconds | Saturation percentage |
|---|---|---|---|
| A | 28004 | 149 | 0.532067% |
| B | 28004 | 700 | 2.499643% |
| C | 28004 | 22 | 0.078560% |
| D | 28004 | 5902 | 21.075561% |
Noise dominated data is calculated using 1-second bins in cleaned event files. If a bin has >2000 counts, and if more than 50% of those come from <1% of pixels, then it is considered to be noise-dominated and hence unusable.
| Quadrant | # 1 sec bins | Bins with >0 counts | Bins with >2000 counts | High rate bins dominated by noise | Noise dominated (total time) | Noise dominated (detector-on time) | Marked lightcurve |
|---|---|---|---|---|---|---|---|
| A | 37980 | 28010 | 70 | 70 | 0.18% | 0.25% | 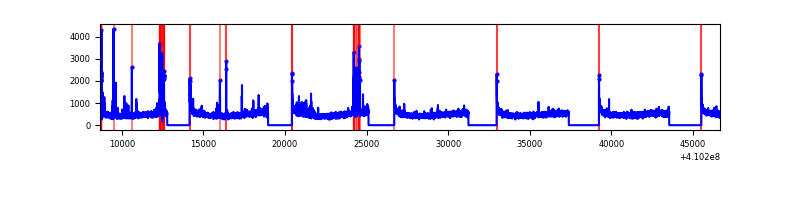 |
| B | 37980 | 28010 | 494 | 494 | 1.30% | 1.76% | 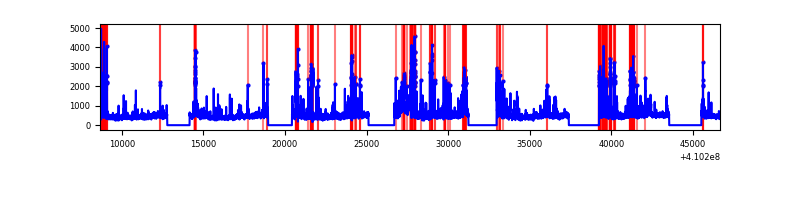 |
| C | 37980 | 28010 | 7 | 7 | 0.02% | 0.02% | 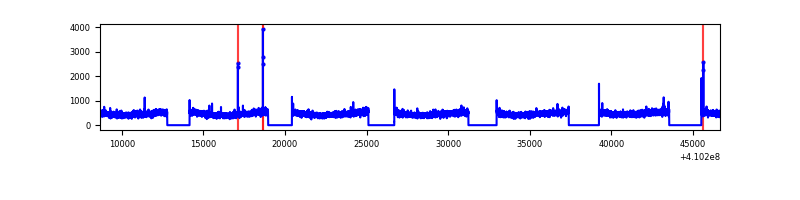 |
| D | 37980 | 28009 | 4897 | 4897 | 12.89% | 17.48% | 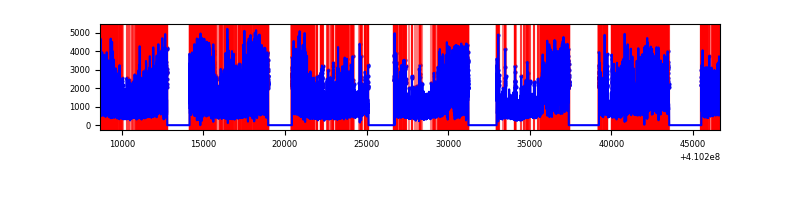 |
Top three noisy pixels from each quadrant. If the there are fewer than three noisy pixels in the level2.evt file, extra rows are filled as -1
| Pixel properties | Quadrant properties | ||||||
|---|---|---|---|---|---|---|---|
| Quadrant | DetID | PixID | Counts | Sigma | Mean | Median | Sigma |
| A | 10 | 83 | 1823346 | 2880.15 | 3126 | 3063 | 632.0 |
| A | 13 | 248 | 504865 | 793.98 | 3126 | 3063 | 632.0 |
| A | 3 | 137 | 34012 | 48.97 | 3126 | 3063 | 632.0 |
| B | 5 | 172 | 1684063 | 2875.82 | 3072 | 2986 | 584.6 |
| B | 5 | 184 | 1618639 | 2763.9 | 3072 | 2986 | 584.6 |
| B | 5 | 255 | 485094 | 824.74 | 3072 | 2986 | 584.6 |
| C | 15 | 214 | 1237362 | 1749.7 | 3044 | 3065 | 705.4 |
| C | 12 | 249 | 29549 | 37.54 | 3044 | 3065 | 705.4 |
| C | 13 | 61 | 20489 | 24.7 | 3044 | 3065 | 705.4 |
| D | 12 | 235 | 22156626 | 32820.52 | 2771 | 2692 | 675.0 |
| D | 5 | 222 | 465203 | 685.2 | 2771 | 2692 | 675.0 |
| D | 12 | 227 | 410065 | 603.51 | 2771 | 2692 | 675.0 |
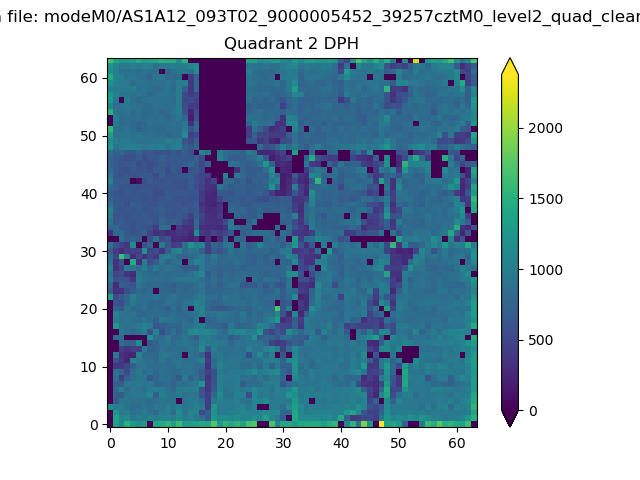
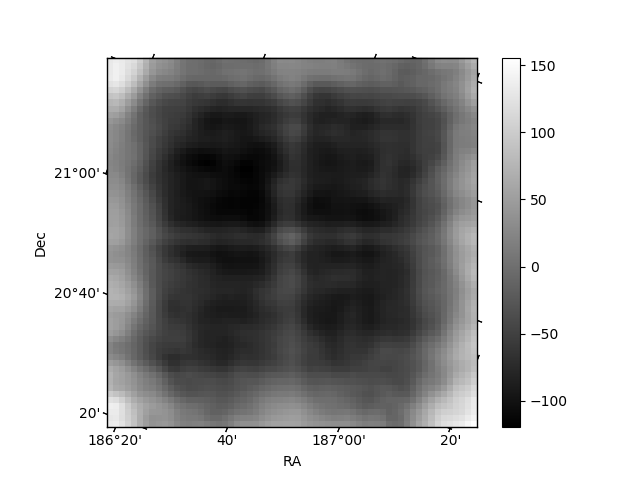
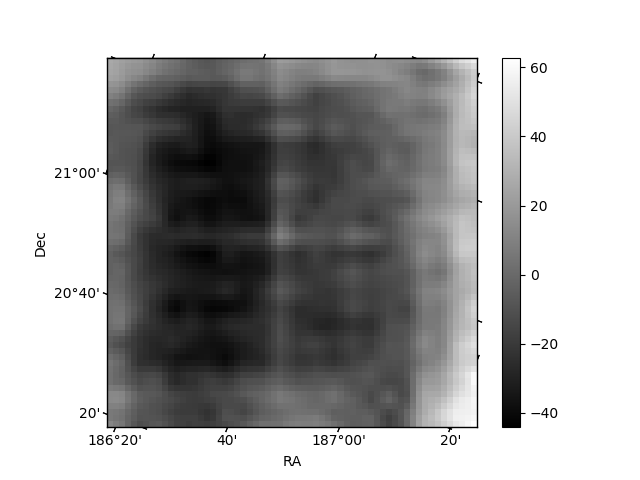
Histogram calculated using DETX and DETY for each event in the final _common_clean file
| Quadrant A | 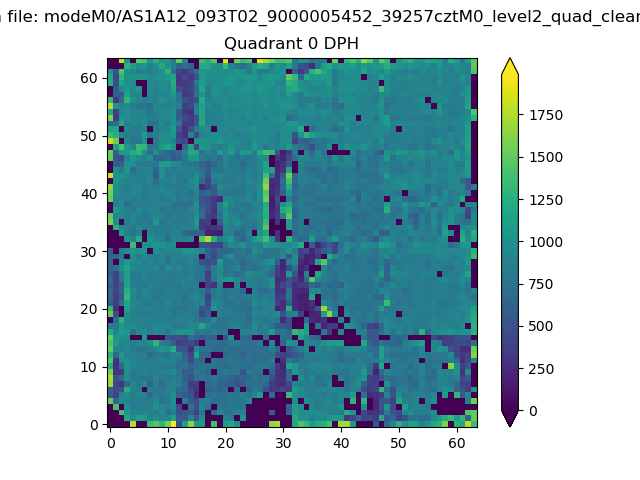 |
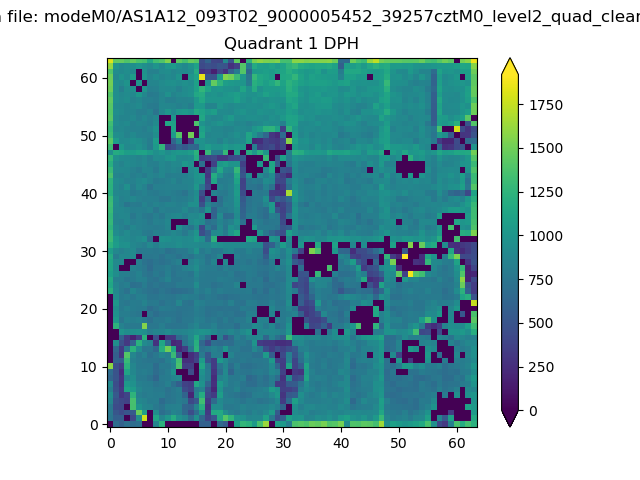 |
Quadrant B |
|---|---|---|---|
| Quadrant D | 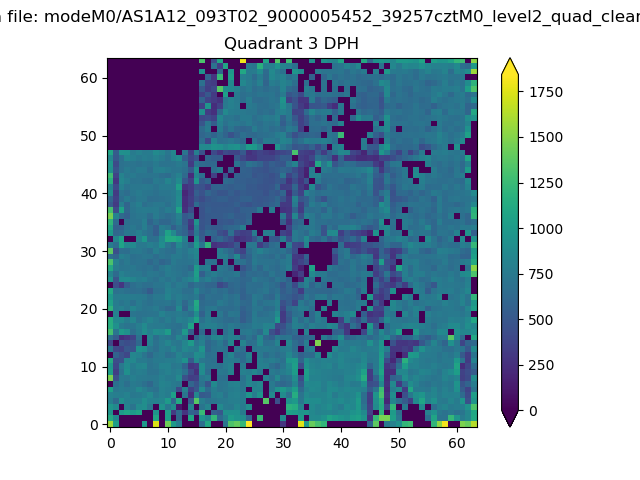 |
 |
Quadrant C |
| Plot type | Count rate plots | Images |
|---|---|---|
| Comparison with Poisson distribution Blue bars denote a histogram of data divided into 1 sec bins. Red curve is a Poisson curve with rate = median count rate of data. |
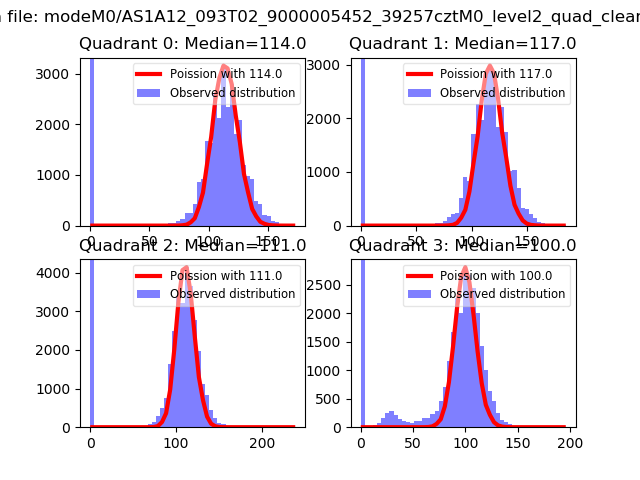 |
 |
| Quadrant-wise count rates Data is divided into 100 sec bins |
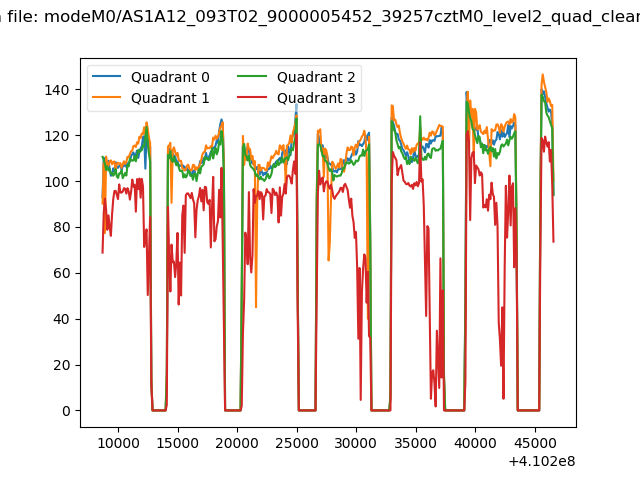 |
|
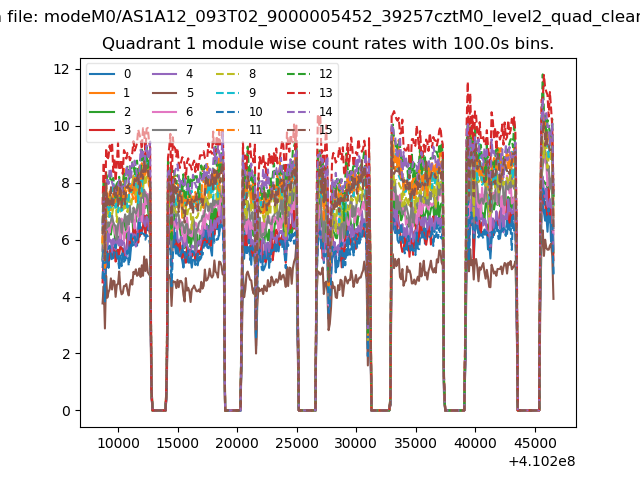
| Module-wise count rates for Quadrant A Data is divided into 100 sec bins |
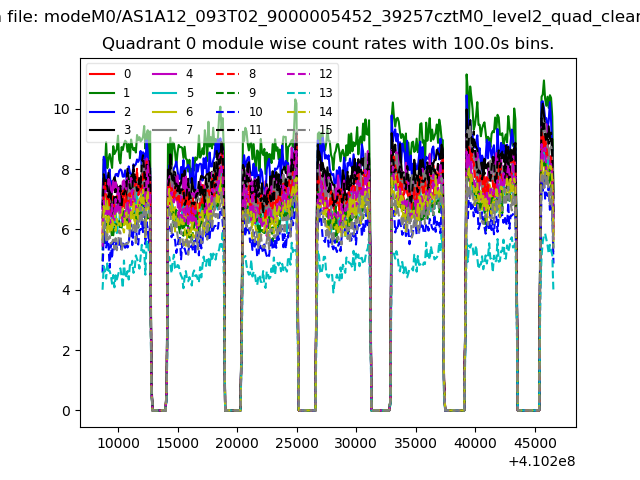 |
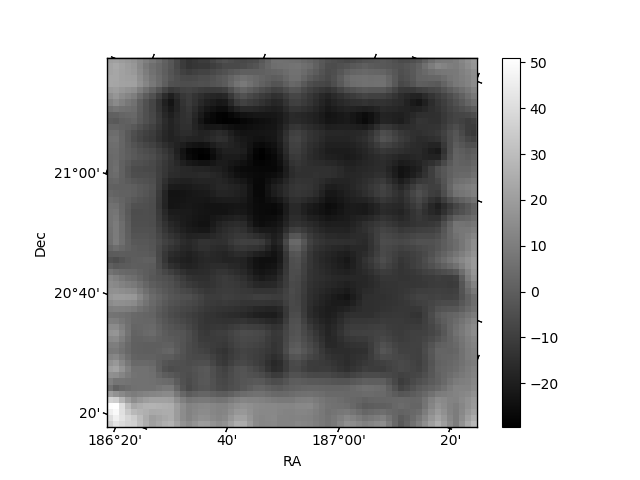 |
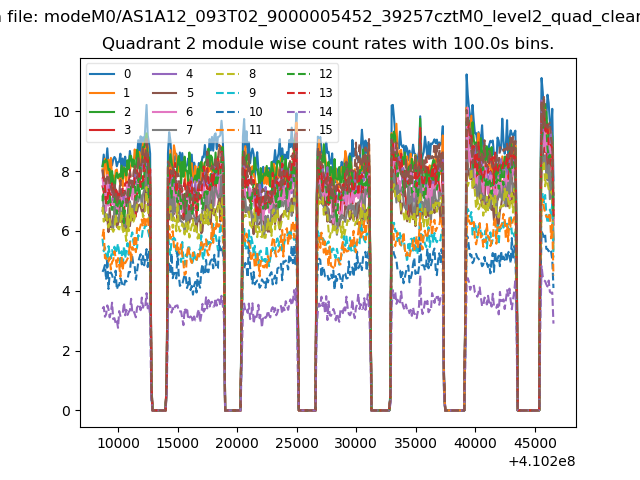
| Module-wise count rates for Quadrant B Data is divided into 100 sec bins |
 |
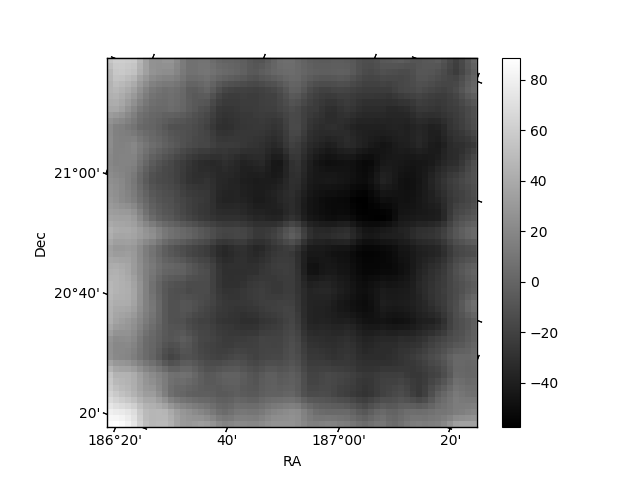 |
| Module-wise count rates for Quadrant C Data is divided into 100 sec bins |
 |
 |
| Module-wise count rates for Quadrant D Data is divided into 100 sec bins |
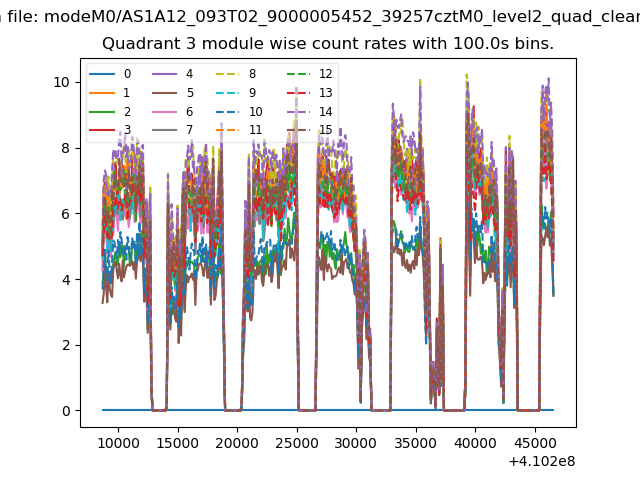 |
 |
| Parameter | Plot |
|---|---|
| CZT HV Monitor | 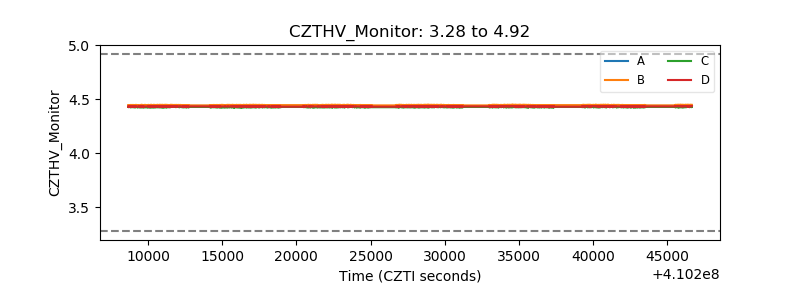 |
| D_VDD | 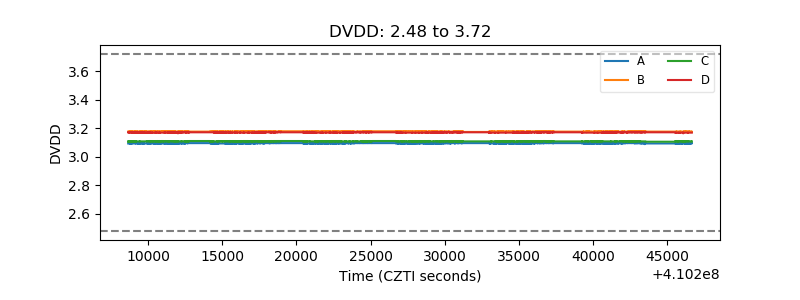 |
| Temperature 1 | 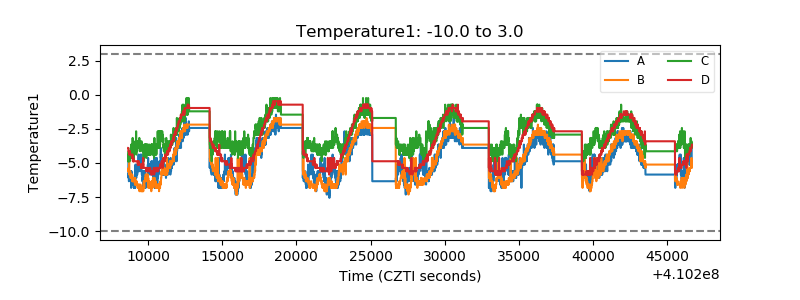 |
| Veto HV Monitor | 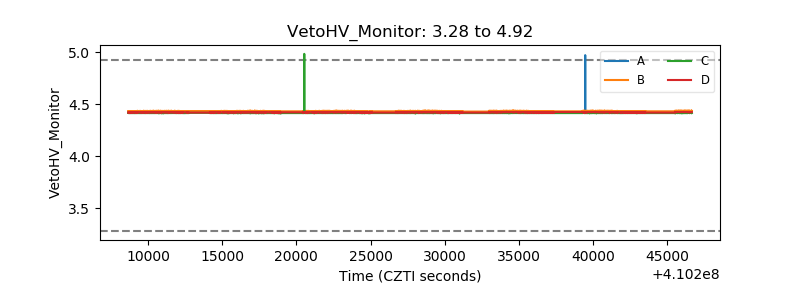 |
| Veto LLD | 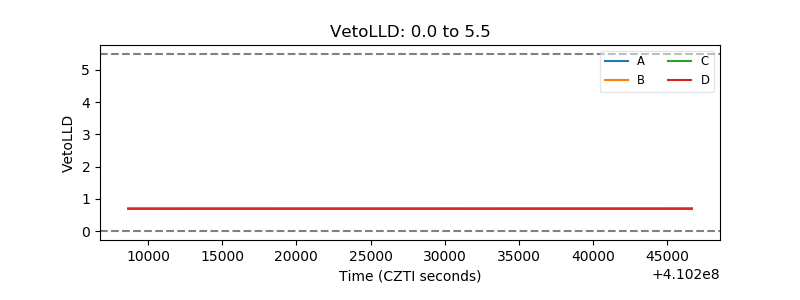 |
| Alpha Counter | 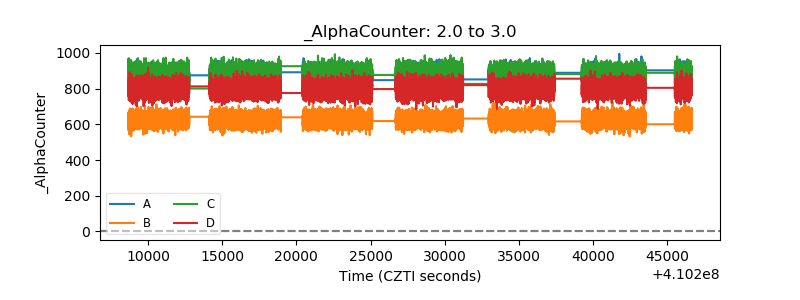 |
| _CPM_Rate | 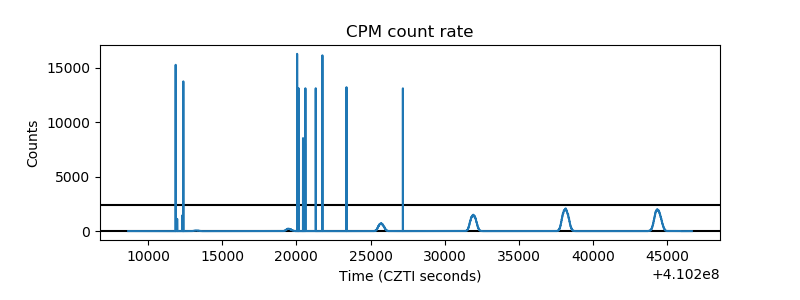 |
| CZT Counter | 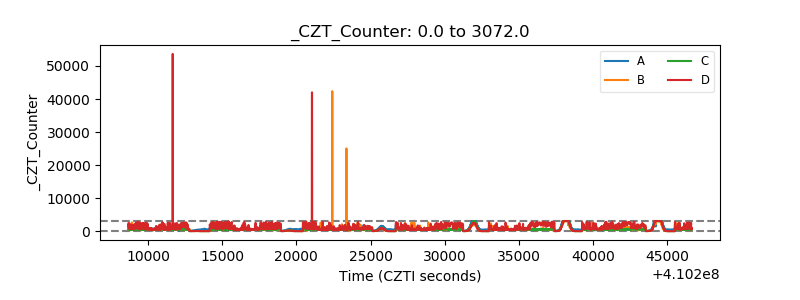 |
| +2.5 Volts monitor | 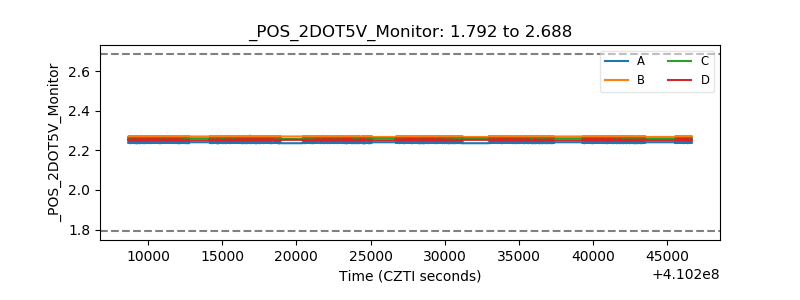 |
| +5 Volts monitor | 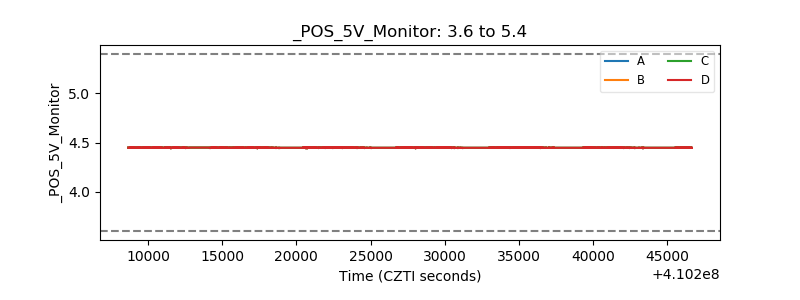 |
| _ROLL_ROT | 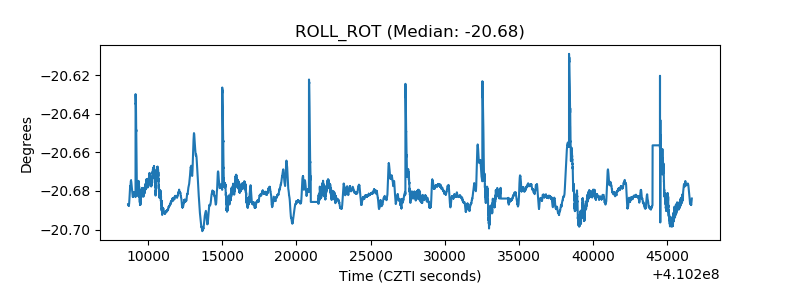 |
| _Roll_DEC | 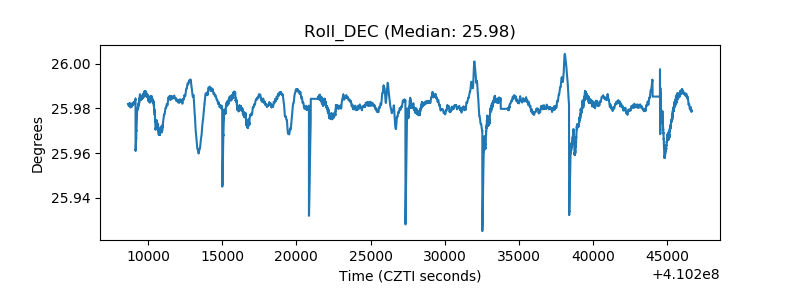 |
| _Roll_RA | 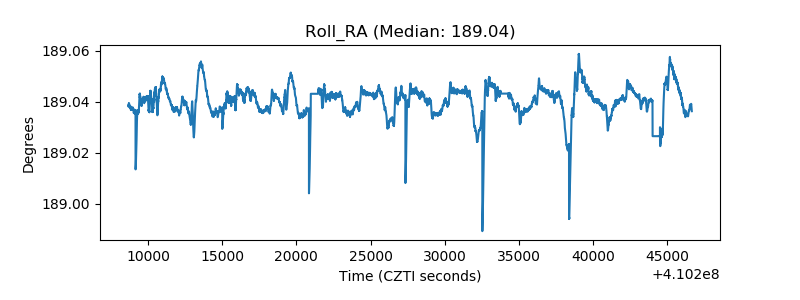 |
| Veto Counter | 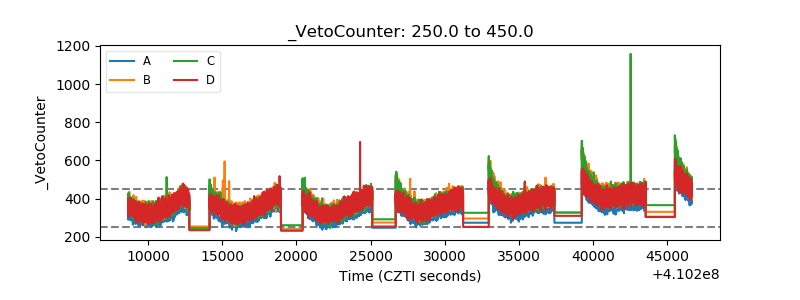 |