| Param | Original file | Final file |
|---|---|---|
| Filename | modeM0/AS1A12_093T02_9000005452_39258cztM0_level2.fits | modeM0/AS1A12_093T02_9000005452_39258cztM0_level2_quad_clean.evt |
| Size (bytes) | 514,535,040 | 84,104,640 |
| Size | 490.7 MB | 80.2 MB |
| Events in quadrant A | 2,801,153 | 651,676 |
| Events in quadrant B | 2,950,208 | 659,708 |
| Events in quadrant C | 2,572,478 | 632,228 |
| Events in quadrant D | 10,325,644 | 245,737 |
| Mode M0 | |||
|---|---|---|---|
| Quadrant | BADHDUFLAG | Total packets | Discarded packets |
| A | 0 | 11156 | 3 |
| B | 0 | 11908 | 2 |
| C | 0 | 10399 | 2 |
| D | 0 | 34227 | 2 |
| Mode SS | |||
|---|---|---|---|
| Quadrant | BADHDUFLAG | Total packets | Discarded packets |
| A | 0 | 104 | 0 |
| B | 0 | 104 | 0 |
| C | 0 | 104 | 0 |
| D | 0 | 104 | 0 |
| Mode M9 | |||
|---|---|---|---|
| Quadrant | BADHDUFLAG | Total packets | Discarded packets |
| A | 0 | 30 | 0 |
| B | 0 | 30 | 0 |
| C | 0 | 30 | 0 |
| D | 0 | 31 | 0 |
| Quadrant | Total seconds | Saturated seconds | Saturation percentage |
|---|---|---|---|
| A | 5101 | 9 | 0.176436% |
| B | 5101 | 133 | 2.607332% |
| C | 5101 | 4 | 0.078416% |
| D | 5101 | 3180 | 62.340718% |
Noise dominated data is calculated using 1-second bins in cleaned event files. If a bin has >2000 counts, and if more than 50% of those come from <1% of pixels, then it is considered to be noise-dominated and hence unusable.
| Quadrant | # 1 sec bins | Bins with >0 counts | Bins with >2000 counts | High rate bins dominated by noise | Noise dominated (total time) | Noise dominated (detector-on time) | Marked lightcurve |
|---|---|---|---|---|---|---|---|
| A | 7194 | 5102 | 4 | 4 | 0.06% | 0.08% | 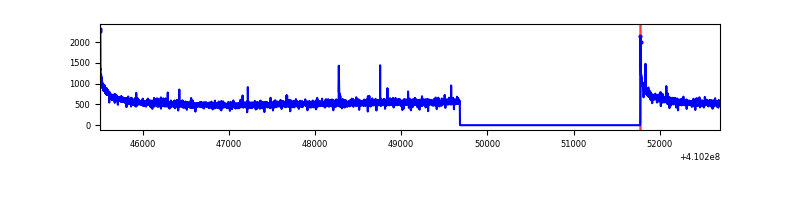 |
| B | 7194 | 5101 | 85 | 85 | 1.18% | 1.67% | 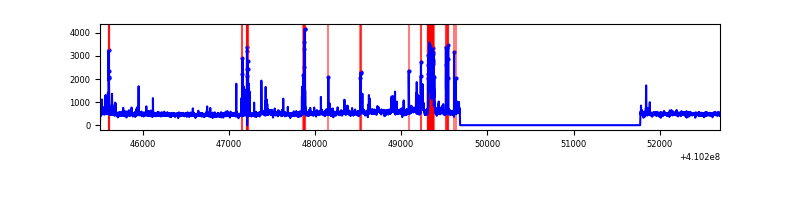 |
| C | 7194 | 5102 | 2 | 2 | 0.03% | 0.04% | 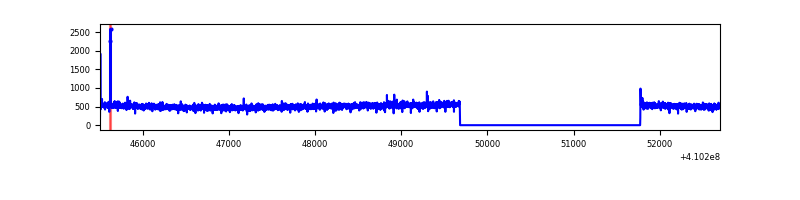 |
| D | 7194 | 5102 | 2749 | 2749 | 38.21% | 53.88% | 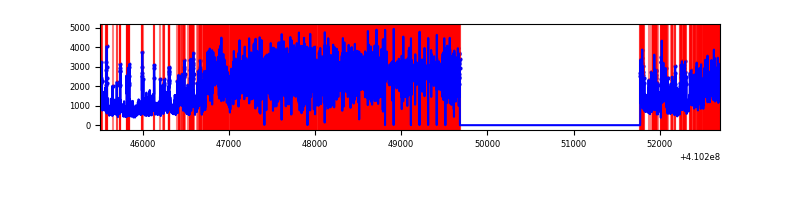 |
Top three noisy pixels from each quadrant. If the there are fewer than three noisy pixels in the level2.evt file, extra rows are filled as -1
| Pixel properties | Quadrant properties | ||||||
|---|---|---|---|---|---|---|---|
| Quadrant | DetID | PixID | Counts | Sigma | Mean | Median | Sigma |
| A | 10 | 83 | 414038 | 3389.25 | 615 | 603 | 122.0 |
| A | 13 | 248 | 6487 | 48.23 | 615 | 603 | 122.0 |
| A | 3 | 137 | 6202 | 45.9 | 615 | 603 | 122.0 |
| B | 5 | 255 | 428984 | 3735.66 | 600 | 585 | 114.7 |
| B | 5 | 172 | 67982 | 587.7 | 600 | 585 | 114.7 |
| B | 5 | 184 | 54611 | 471.11 | 600 | 585 | 114.7 |
| C | 15 | 214 | 232229 | 1688.12 | 595 | 600 | 137.2 |
| C | 12 | 249 | 10607 | 72.93 | 595 | 600 | 137.2 |
| C | 0 | 10 | 9222 | 62.84 | 595 | 600 | 137.2 |
| D | 12 | 235 | 8397501 | 91857.05 | 374 | 365 | 91.4 |
| D | 12 | 227 | 160588 | 1752.69 | 374 | 365 | 91.4 |
| D | 2 | 249 | 132198 | 1442.13 | 374 | 365 | 91.4 |
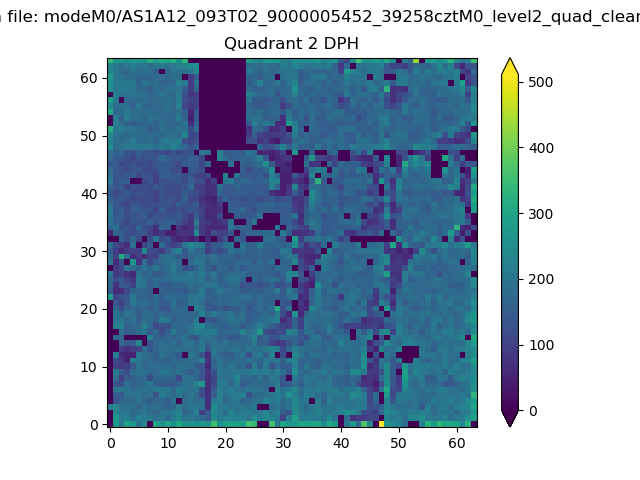
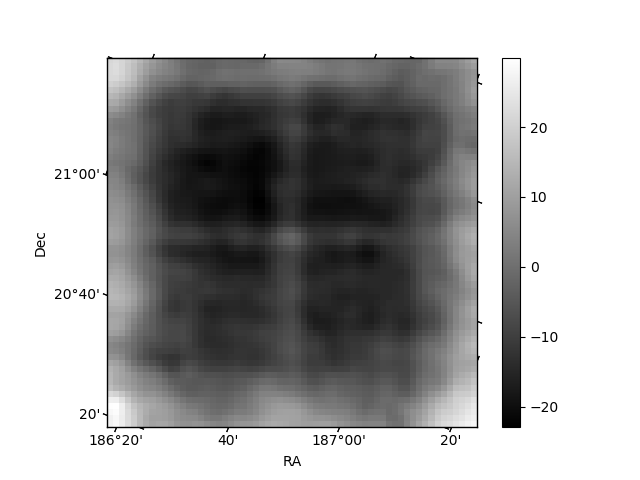
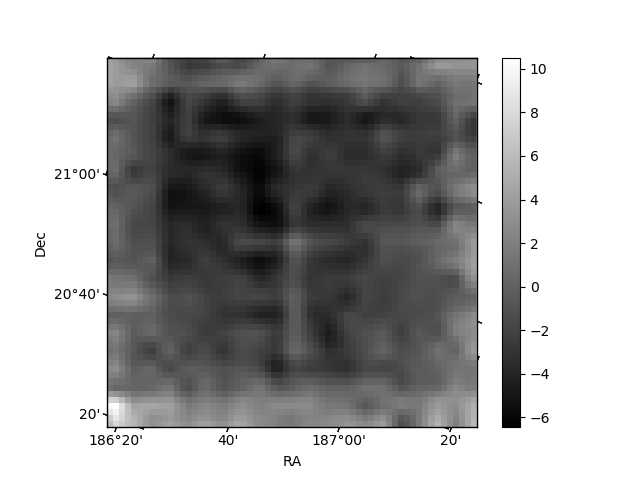
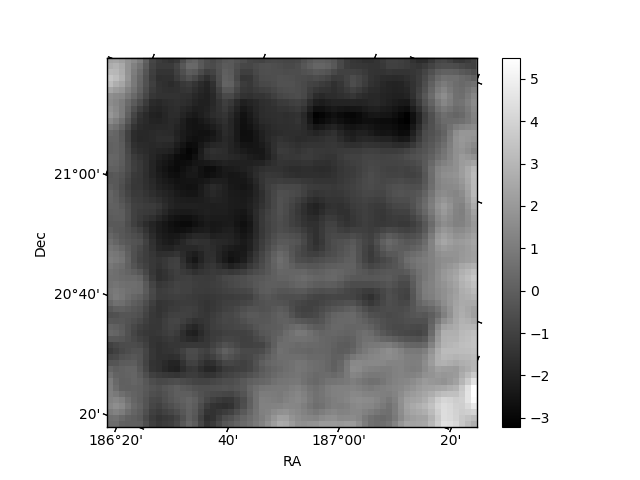
Histogram calculated using DETX and DETY for each event in the final _common_clean file
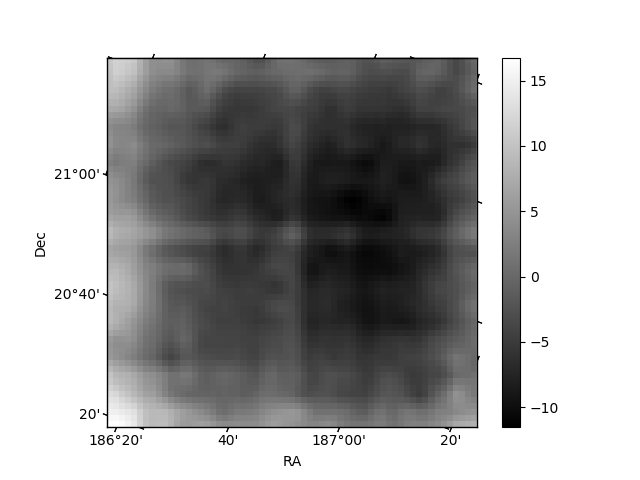
| Quadrant A | 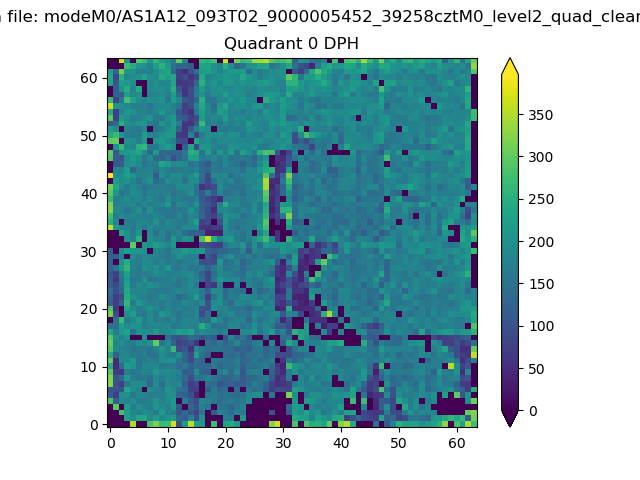 |
 |
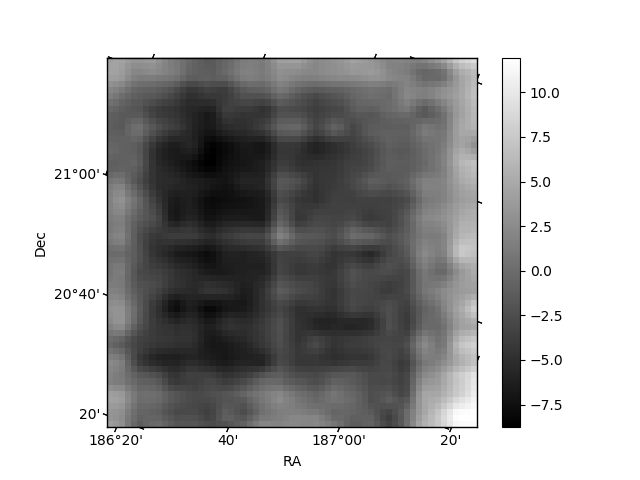
Quadrant B |
|---|---|---|---|
| Quadrant D | 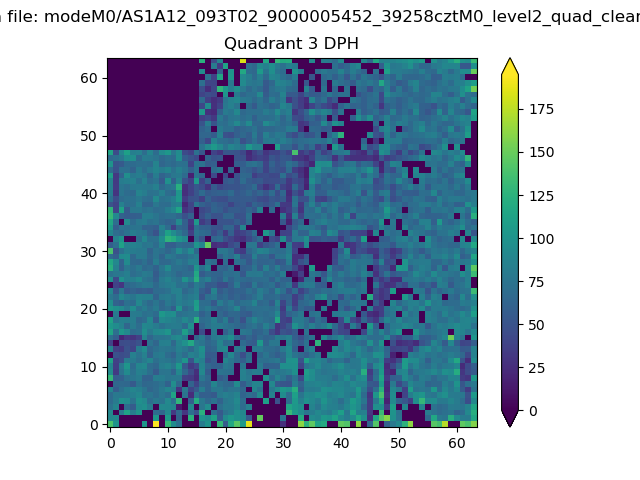 |
 |
Quadrant C |
| Plot type | Count rate plots | Images |
|---|---|---|
| Comparison with Poisson distribution Blue bars denote a histogram of data divided into 1 sec bins. Red curve is a Poisson curve with rate = median count rate of data. |
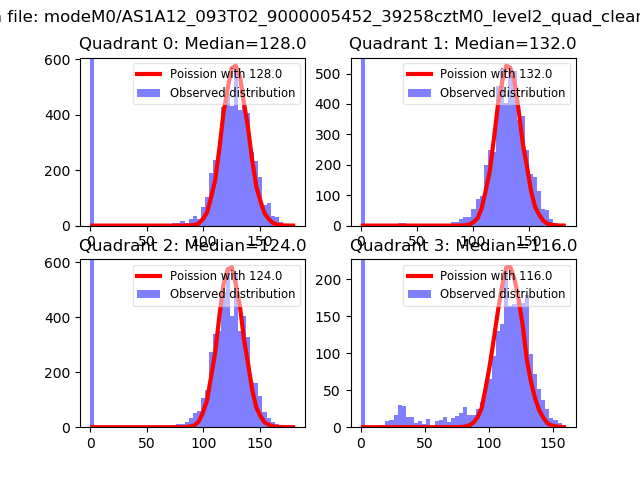 |
 |
| Quadrant-wise count rates Data is divided into 100 sec bins |
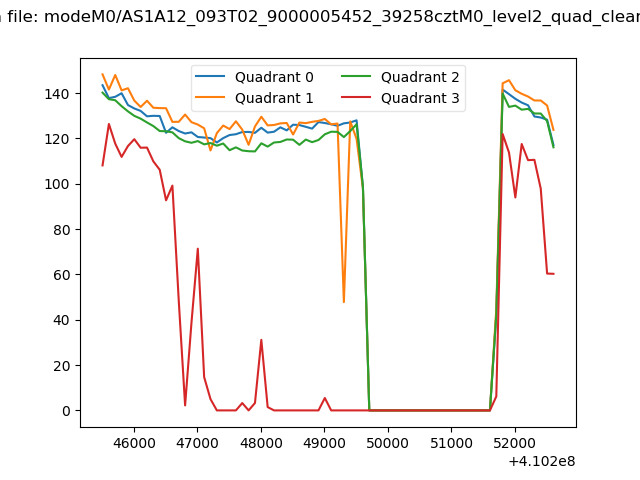 |
|
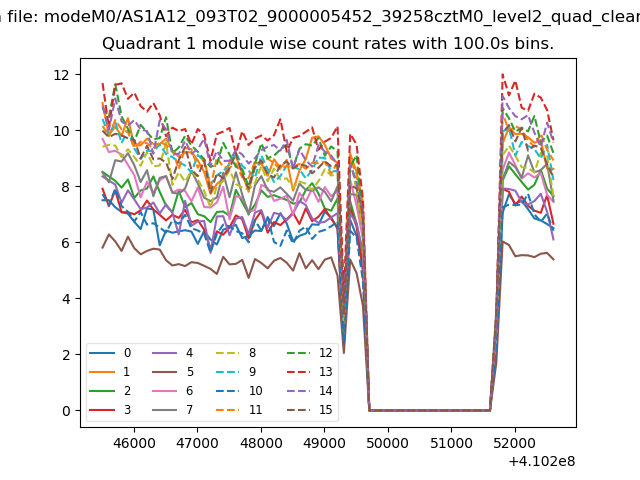
| Module-wise count rates for Quadrant A Data is divided into 100 sec bins |
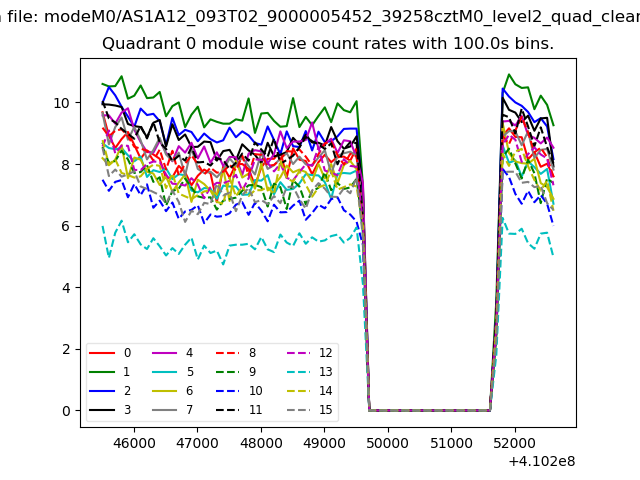 |
 |
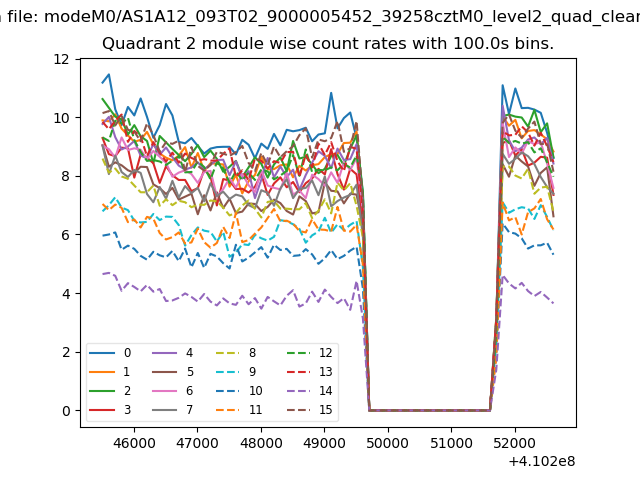
| Module-wise count rates for Quadrant B Data is divided into 100 sec bins |
 |
 |
| Module-wise count rates for Quadrant C Data is divided into 100 sec bins |
 |
 |
| Module-wise count rates for Quadrant D Data is divided into 100 sec bins |
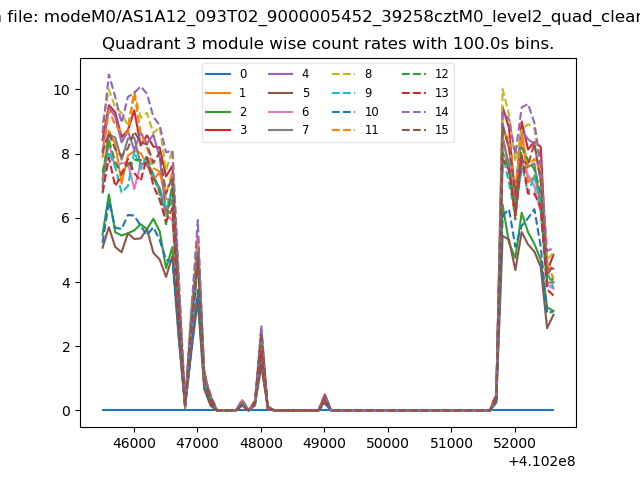 |
 |
| Parameter | Plot |
|---|---|
| CZT HV Monitor | 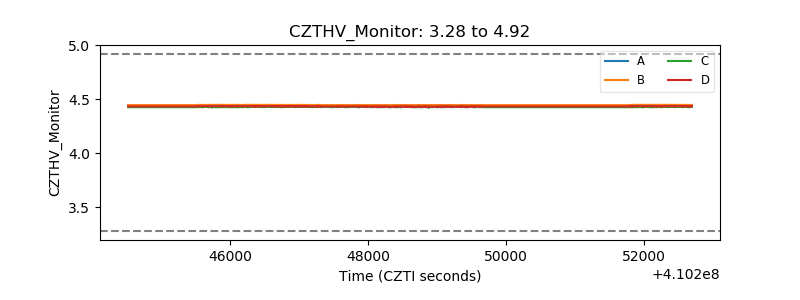 |
| D_VDD | 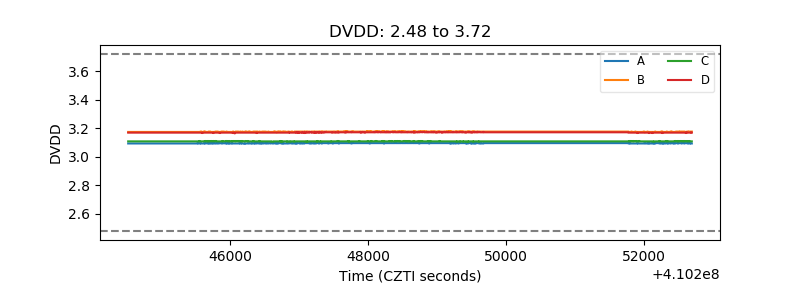 |
| Temperature 1 | 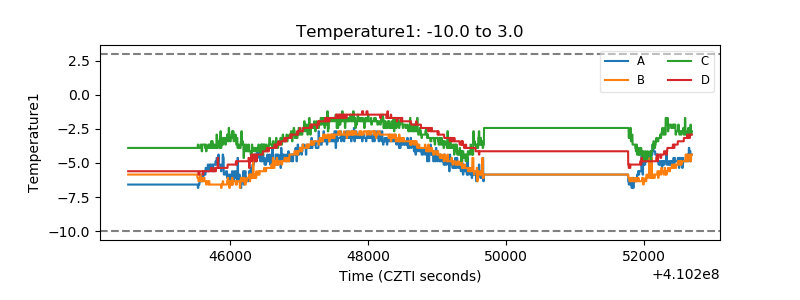 |
| Veto HV Monitor | 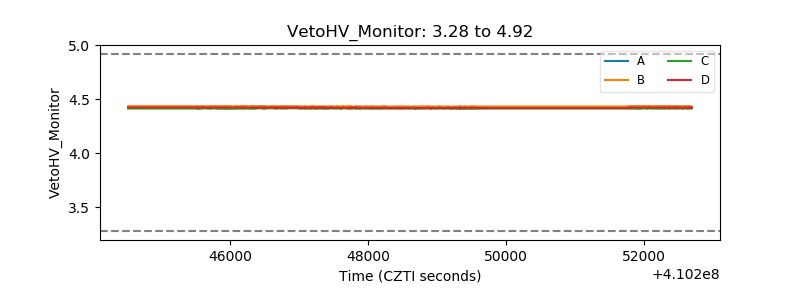 |
| Veto LLD | 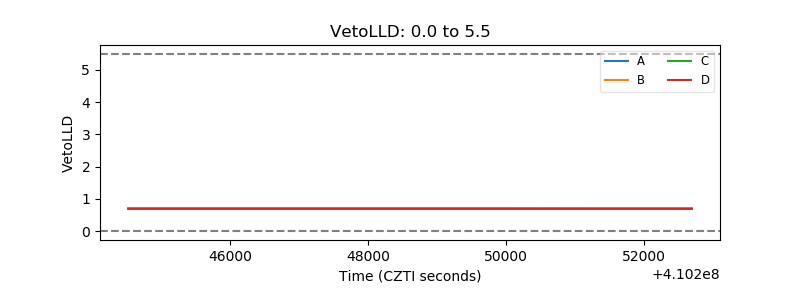 |
| Alpha Counter | 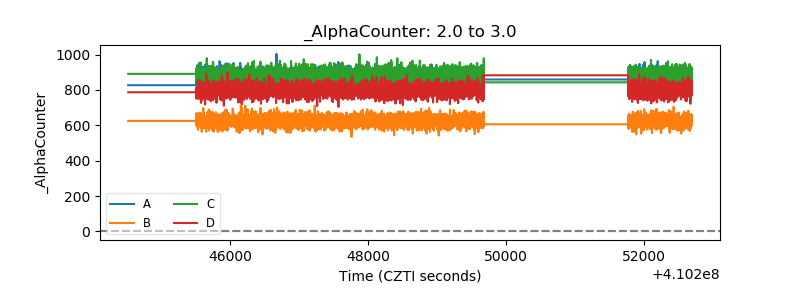 |
| _CPM_Rate | 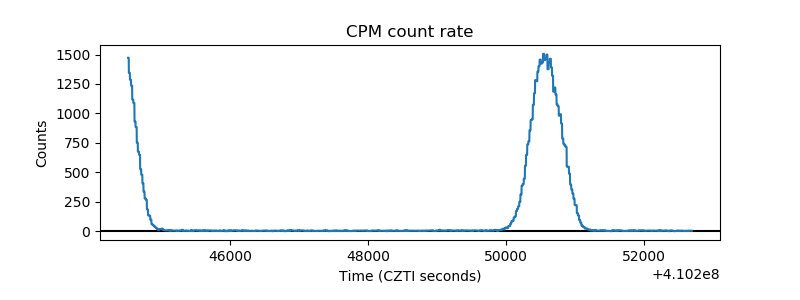 |
| CZT Counter | 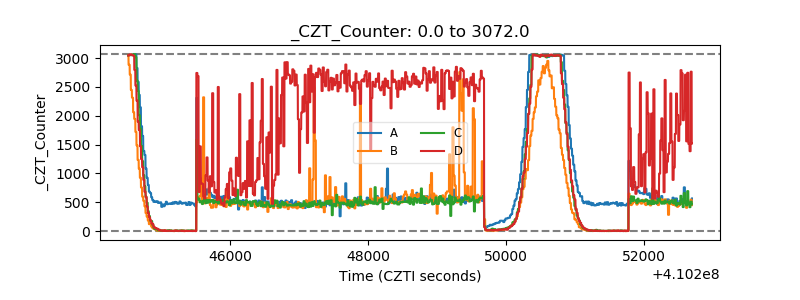 |
| +2.5 Volts monitor | 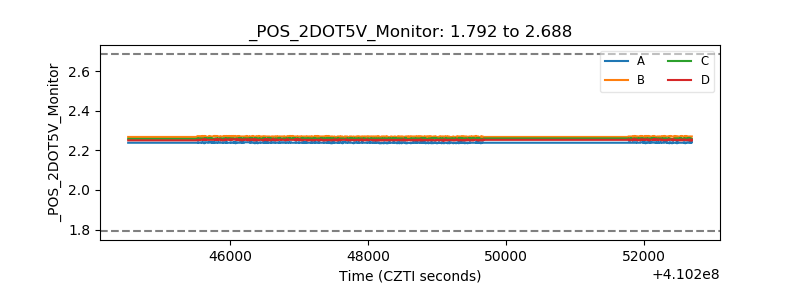 |
| +5 Volts monitor | 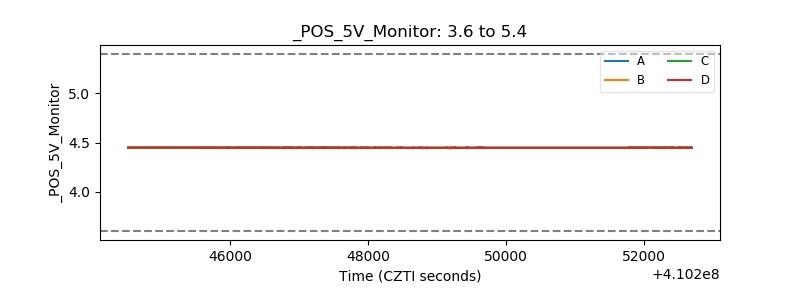 |
| _ROLL_ROT | 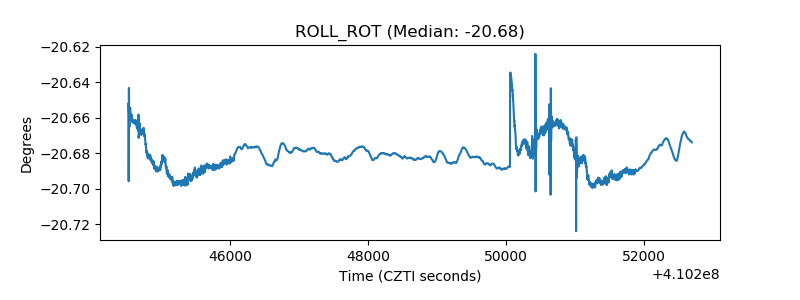 |
| _Roll_DEC | 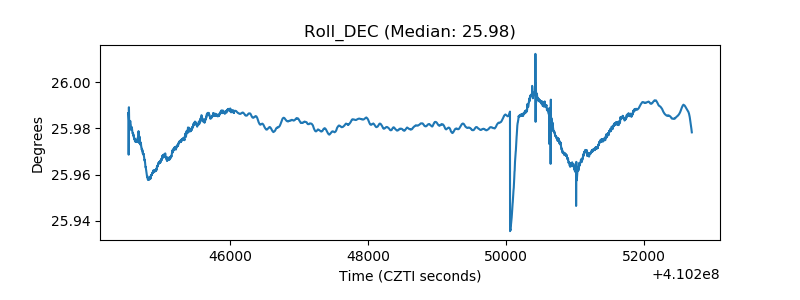 |
| _Roll_RA | 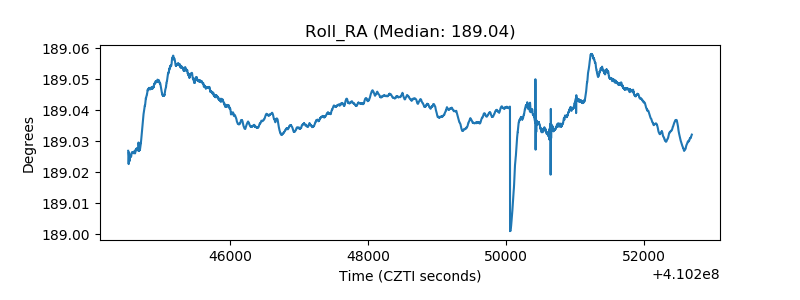 |
| Veto Counter | 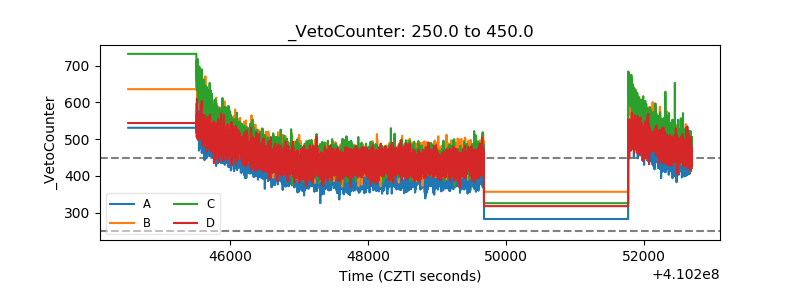 |