| Param | Original file | Final file |
|---|---|---|
| Filename | modeM0/AS1A12_093T02_9000005452_39259cztM0_level2.fits | modeM0/AS1A12_093T02_9000005452_39259cztM0_level2_quad_clean.evt |
| Size (bytes) | 513,017,280 | 79,234,560 |
| Size | 489.3 MB | 75.6 MB |
| Events in quadrant A | 2,718,321 | 615,536 |
| Events in quadrant B | 3,017,823 | 623,439 |
| Events in quadrant C | 2,480,801 | 597,832 |
| Events in quadrant D | 10,392,652 | 219,416 |
| Mode M0 | |||
|---|---|---|---|
| Quadrant | BADHDUFLAG | Total packets | Discarded packets |
| A | 0 | 10810 | 3 |
| B | 0 | 11954 | 2 |
| C | 0 | 9975 | 2 |
| D | 0 | 34217 | 2 |
| Mode SS | |||
|---|---|---|---|
| Quadrant | BADHDUFLAG | Total packets | Discarded packets |
| A | 0 | 100 | 0 |
| B | 0 | 100 | 0 |
| C | 0 | 100 | 0 |
| D | 0 | 100 | 0 |
| Mode M9 | |||
|---|---|---|---|
| Quadrant | BADHDUFLAG | Total packets | Discarded packets |
| A | 0 | 31 | 0 |
| B | 0 | 31 | 0 |
| C | 0 | 31 | 0 |
| D | 0 | 32 | 0 |
| Quadrant | Total seconds | Saturated seconds | Saturation percentage |
|---|---|---|---|
| A | 4887 | 12 | 0.245549% |
| B | 4887 | 145 | 2.967055% |
| C | 4887 | 10 | 0.204625% |
| D | 4887 | 3258 | 66.666667% |
Noise dominated data is calculated using 1-second bins in cleaned event files. If a bin has >2000 counts, and if more than 50% of those come from <1% of pixels, then it is considered to be noise-dominated and hence unusable.
| Quadrant | # 1 sec bins | Bins with >0 counts | Bins with >2000 counts | High rate bins dominated by noise | Noise dominated (total time) | Noise dominated (detector-on time) | Marked lightcurve |
|---|---|---|---|---|---|---|---|
| A | 7040 | 4888 | 6 | 6 | 0.09% | 0.12% | 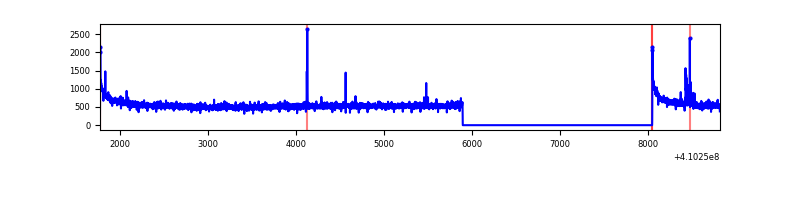 |
| B | 7040 | 4888 | 93 | 93 | 1.32% | 1.90% | 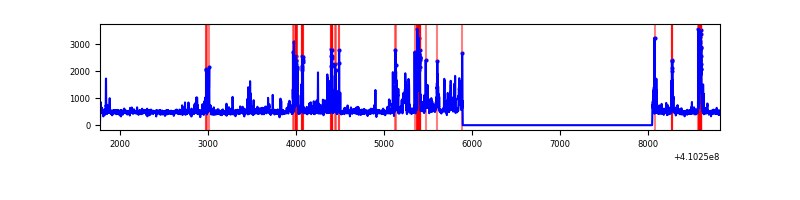 |
| C | 7040 | 4888 | 4 | 4 | 0.06% | 0.08% | 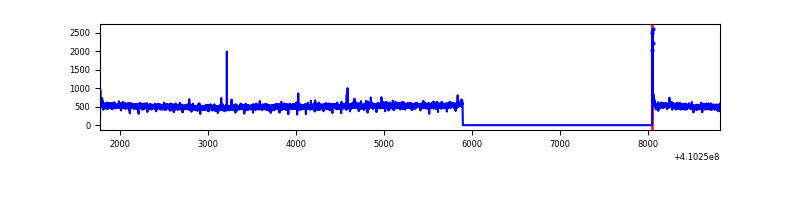 |
| D | 7040 | 4888 | 2845 | 2845 | 40.41% | 58.20% | 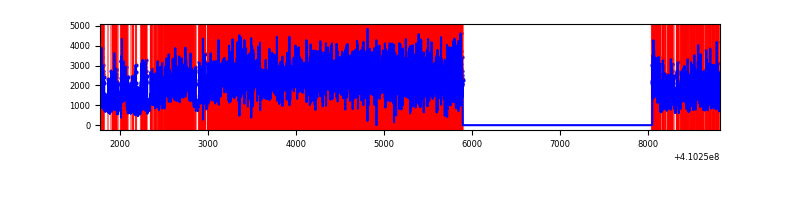 |
Top three noisy pixels from each quadrant. If the there are fewer than three noisy pixels in the level2.evt file, extra rows are filled as -1
| Pixel properties | Quadrant properties | ||||||
|---|---|---|---|---|---|---|---|
| Quadrant | DetID | PixID | Counts | Sigma | Mean | Median | Sigma |
| A | 10 | 83 | 403786 | 3396.77 | 588 | 577 | 118.7 |
| A | 13 | 248 | 32758 | 271.1 | 588 | 577 | 118.7 |
| A | 13 | 254 | 7219 | 55.95 | 588 | 577 | 118.7 |
| B | 5 | 172 | 331025 | 3020.69 | 575 | 562 | 109.4 |
| B | 5 | 255 | 290155 | 2647.11 | 575 | 562 | 109.4 |
| B | 0 | 190 | 89857 | 816.23 | 575 | 562 | 109.4 |
| C | 15 | 214 | 224426 | 1682.77 | 572 | 576 | 133.0 |
| C | 0 | 10 | 16256 | 117.87 | 572 | 576 | 133.0 |
| C | 13 | 61 | 3801 | 24.24 | 572 | 576 | 133.0 |
| D | 12 | 235 | 8347882 | 81822.14 | 414 | 402 | 102.0 |
| D | 5 | 222 | 135647 | 1325.67 | 414 | 402 | 102.0 |
| D | 2 | 120 | 128057 | 1251.28 | 414 | 402 | 102.0 |
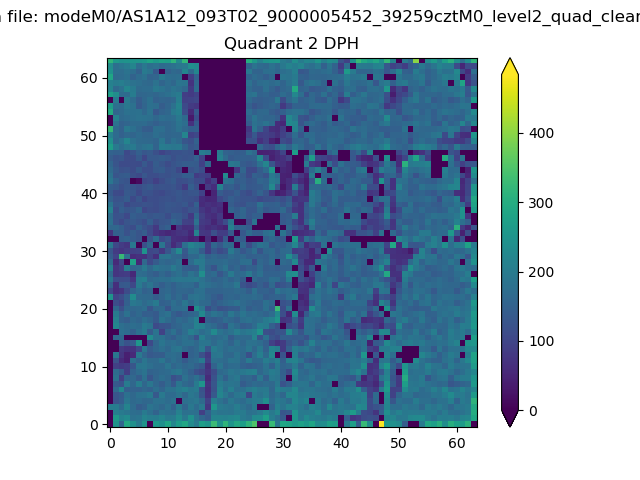
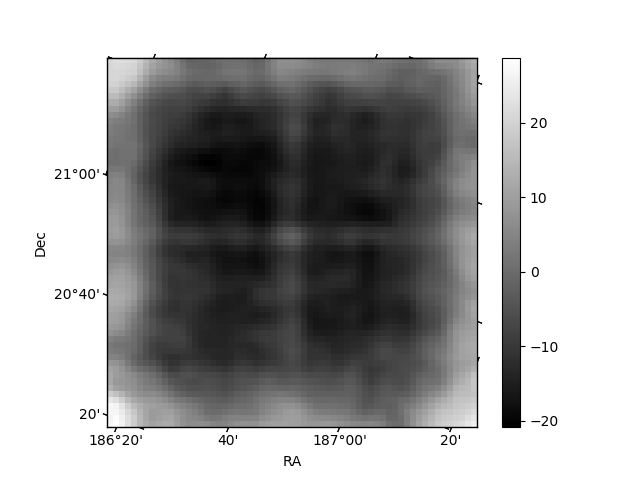
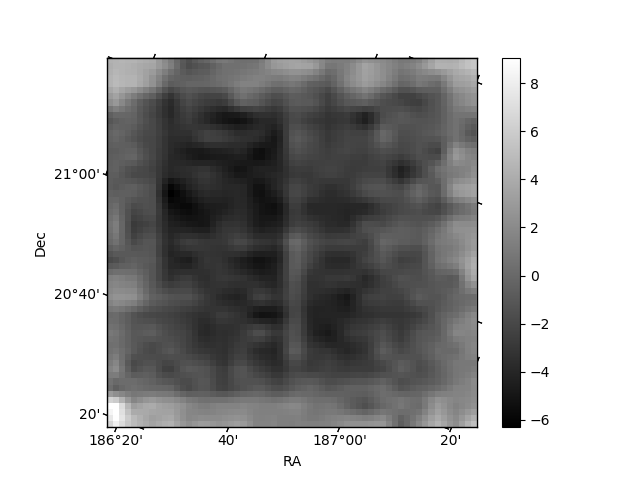
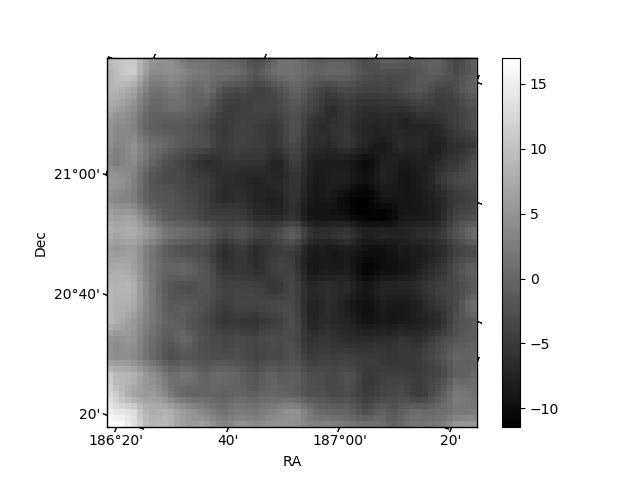
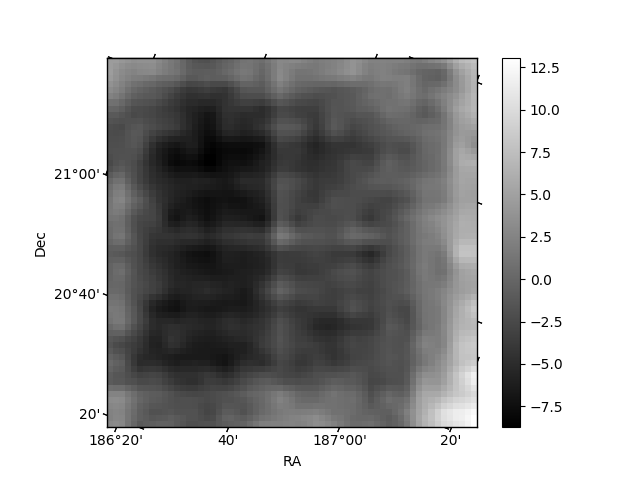
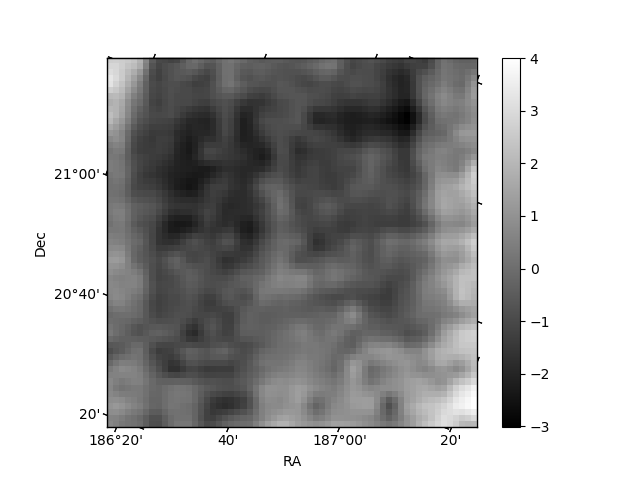
Histogram calculated using DETX and DETY for each event in the final _common_clean file
| Quadrant A | 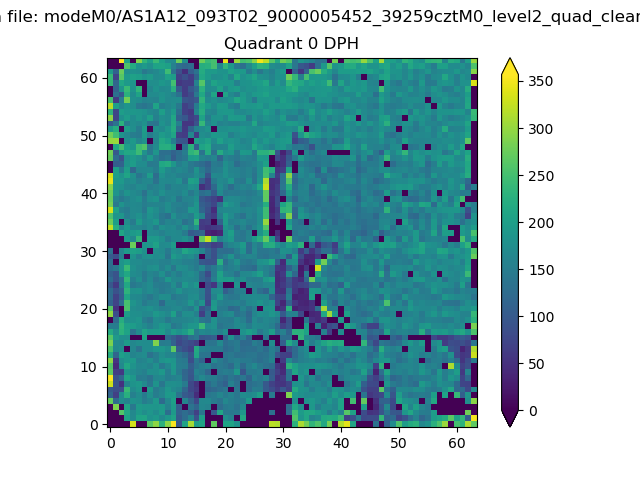 |
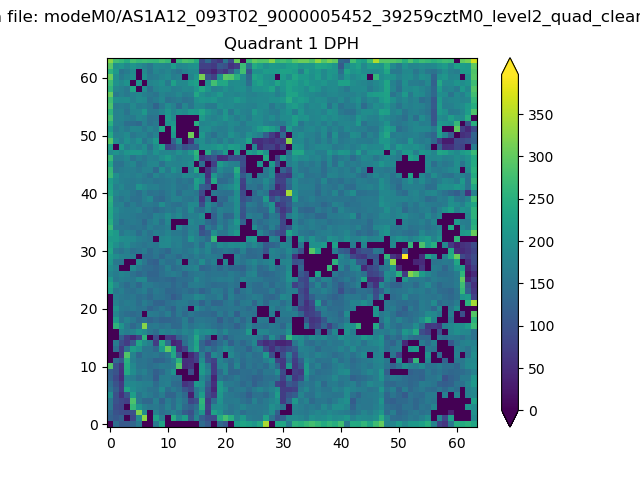 |
Quadrant B |
|---|---|---|---|
| Quadrant D | 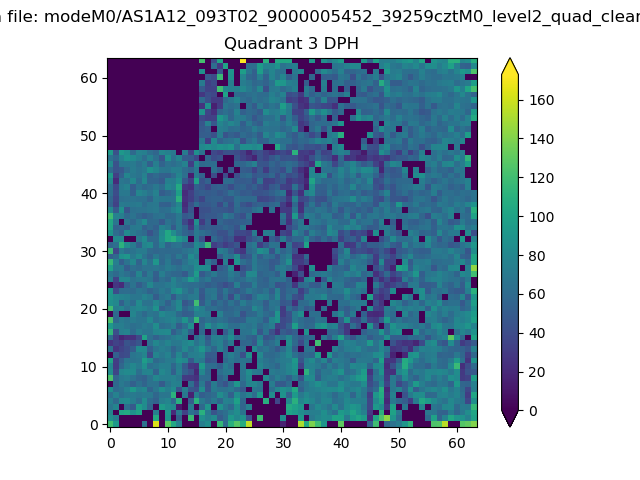 |
 |
Quadrant C |
| Plot type | Count rate plots | Images |
|---|---|---|
| Comparison with Poisson distribution Blue bars denote a histogram of data divided into 1 sec bins. Red curve is a Poisson curve with rate = median count rate of data. |
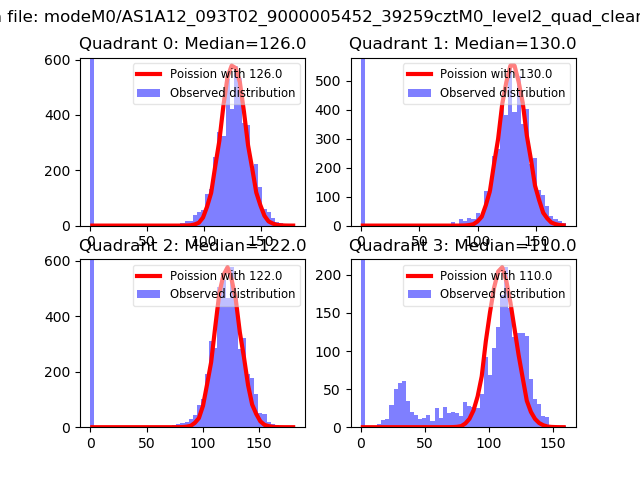 |
 |
| Quadrant-wise count rates Data is divided into 100 sec bins |
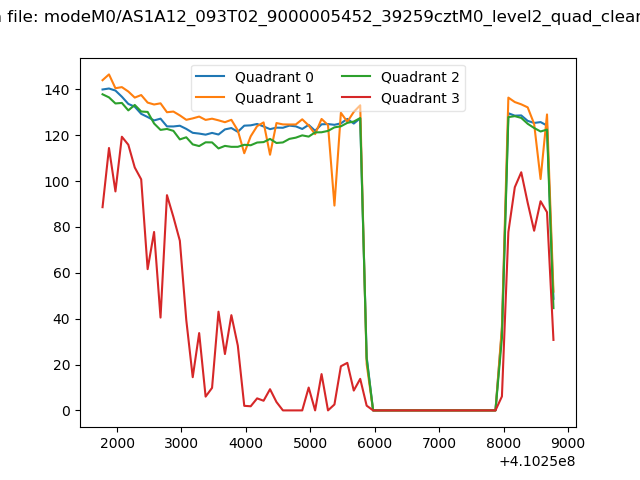 |
|
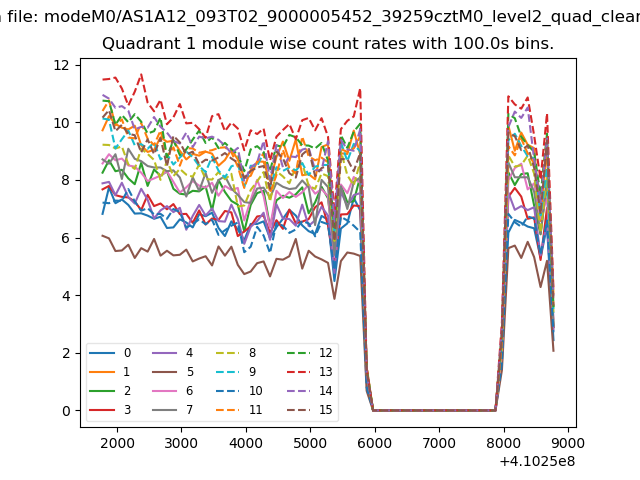
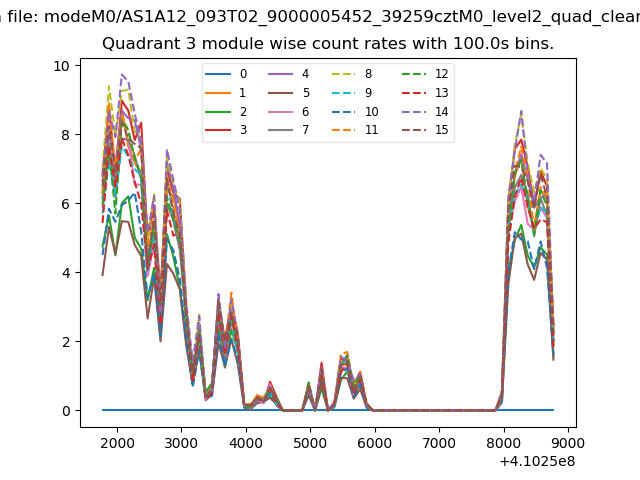
| Module-wise count rates for Quadrant A Data is divided into 100 sec bins |
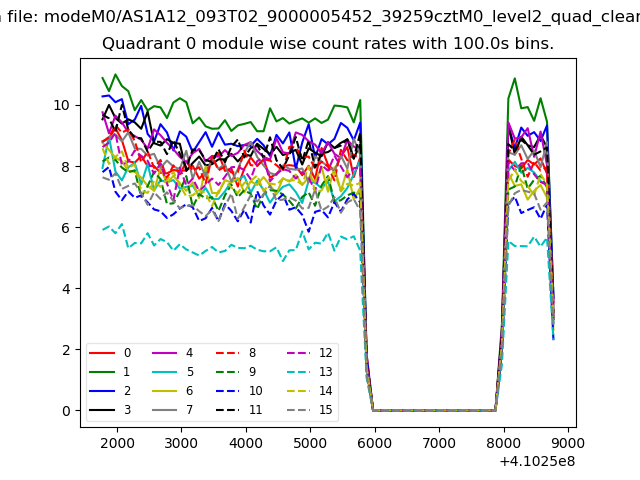 |
 |
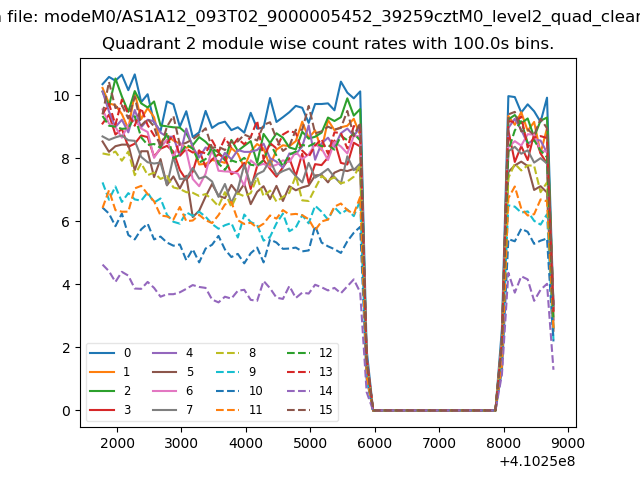
| Module-wise count rates for Quadrant B Data is divided into 100 sec bins |
 |
 |
| Module-wise count rates for Quadrant C Data is divided into 100 sec bins |
 |
 |
| Module-wise count rates for Quadrant D Data is divided into 100 sec bins |
 |
 |
| Parameter | Plot |
|---|---|
| CZT HV Monitor | 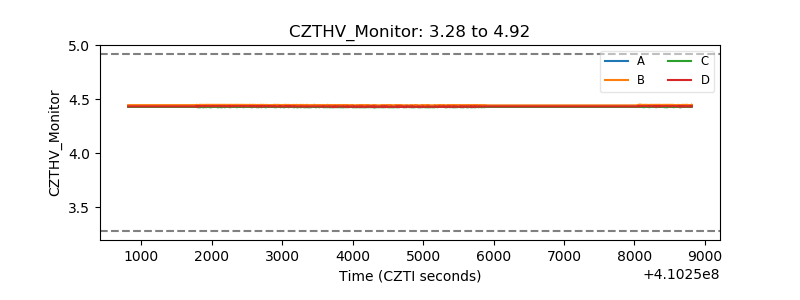 |
| D_VDD | 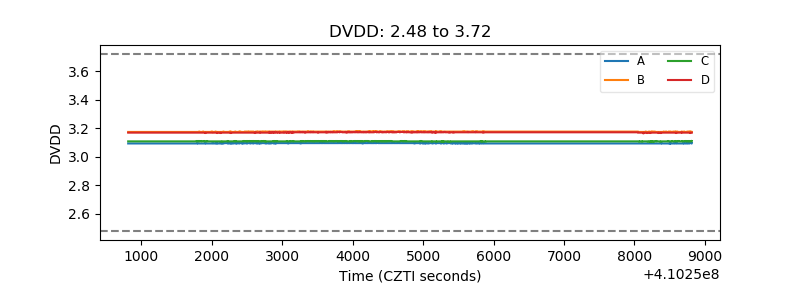 |
| Temperature 1 | 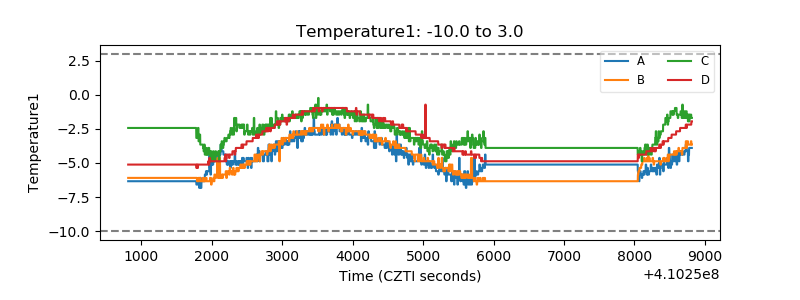 |
| Veto HV Monitor |  |
| Veto LLD | 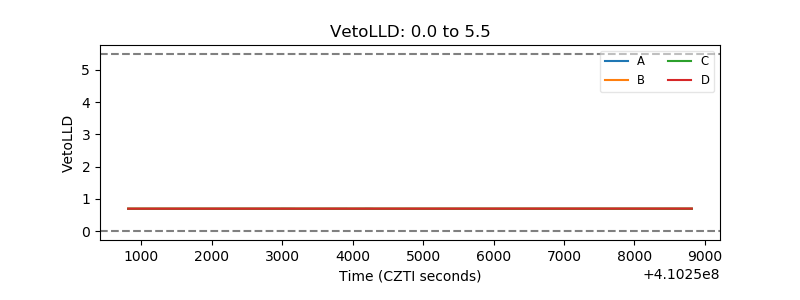 |
| Alpha Counter | 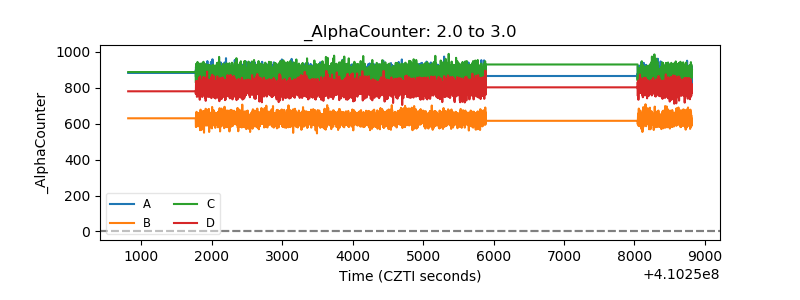 |
| _CPM_Rate | 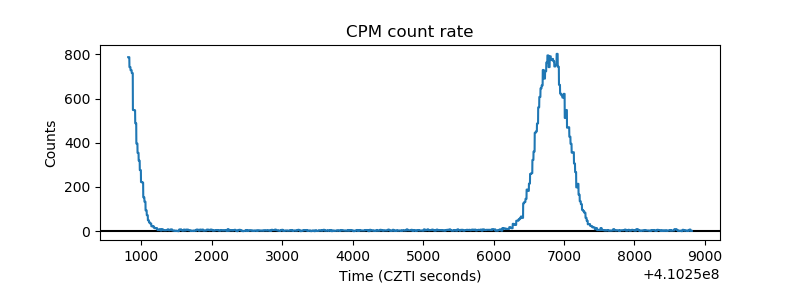 |
| CZT Counter | 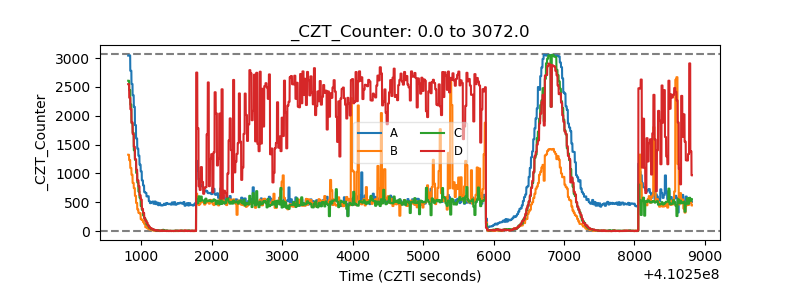 |
| +2.5 Volts monitor | 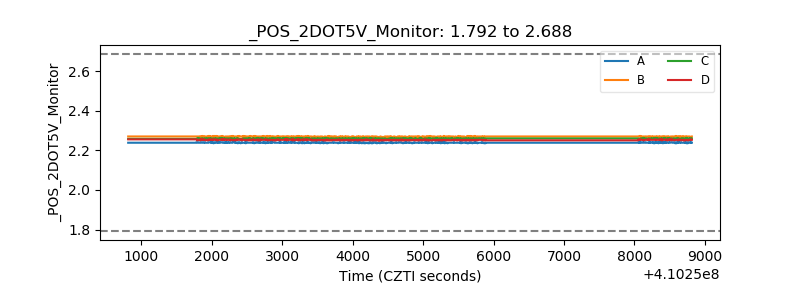 |
| +5 Volts monitor | 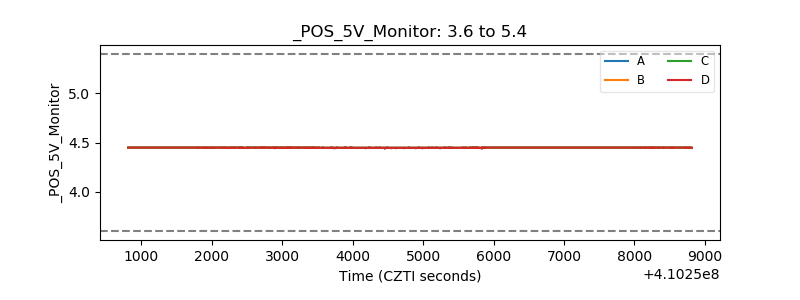 |
| _ROLL_ROT | 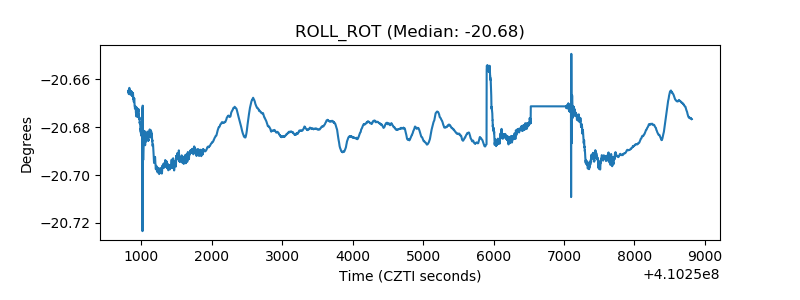 |
| _Roll_DEC | 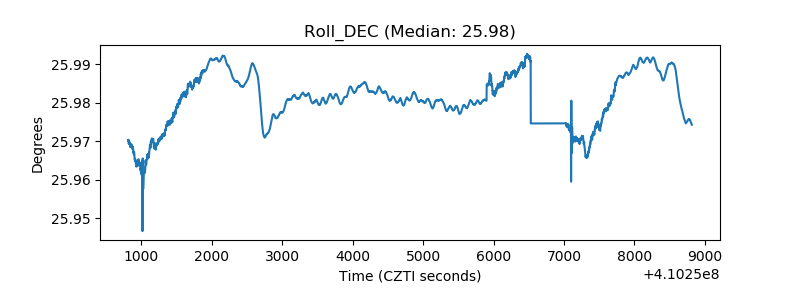 |
| _Roll_RA | 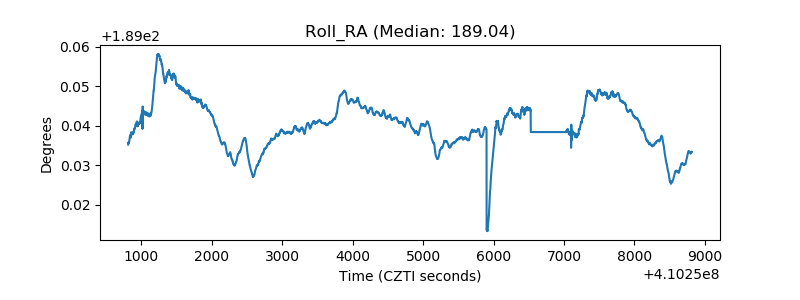 |
| Veto Counter | 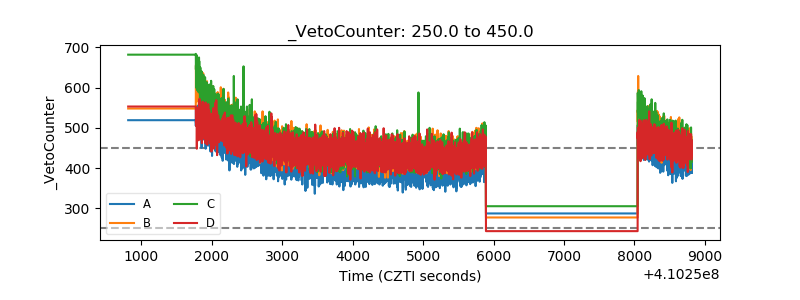 |