| Param | Original file | Final file |
|---|---|---|
| Filename | modeM0/AS1A12_093T02_9000005452_39260cztM0_level2.fits | modeM0/AS1A12_093T02_9000005452_39260cztM0_level2_quad_clean.evt |
| Size (bytes) | 528,805,440 | 73,163,520 |
| Size | 504.3 MB | 69.8 MB |
| Events in quadrant A | 2,627,161 | 585,987 |
| Events in quadrant B | 3,024,553 | 581,111 |
| Events in quadrant C | 2,427,818 | 564,018 |
| Events in quadrant D | 11,119,597 | 146,344 |
| Mode M0 | |||
|---|---|---|---|
| Quadrant | BADHDUFLAG | Total packets | Discarded packets |
| A | 0 | 10500 | 2 |
| B | 0 | 11956 | 1 |
| C | 0 | 9819 | 1 |
| D | 0 | 36356 | 1 |
| Mode SS | |||
|---|---|---|---|
| Quadrant | BADHDUFLAG | Total packets | Discarded packets |
| A | 0 | 96 | 0 |
| B | 0 | 96 | 0 |
| C | 0 | 96 | 0 |
| D | 0 | 96 | 0 |
| Mode M9 | |||
|---|---|---|---|
| Quadrant | BADHDUFLAG | Total packets | Discarded packets |
| A | 0 | 31 | 0 |
| B | 0 | 31 | 0 |
| C | 0 | 31 | 0 |
| D | 0 | 32 | 0 |
| Quadrant | Total seconds | Saturated seconds | Saturation percentage |
|---|---|---|---|
| A | 4822 | 10 | 0.207383% |
| B | 4822 | 183 | 3.795106% |
| C | 4822 | 7 | 0.145168% |
| D | 4822 | 3703 | 76.793861% |
Noise dominated data is calculated using 1-second bins in cleaned event files. If a bin has >2000 counts, and if more than 50% of those come from <1% of pixels, then it is considered to be noise-dominated and hence unusable.
| Quadrant | # 1 sec bins | Bins with >0 counts | Bins with >2000 counts | High rate bins dominated by noise | Noise dominated (total time) | Noise dominated (detector-on time) | Marked lightcurve |
|---|---|---|---|---|---|---|---|
| A | 6944 | 4823 | 3 | 3 | 0.04% | 0.06% | 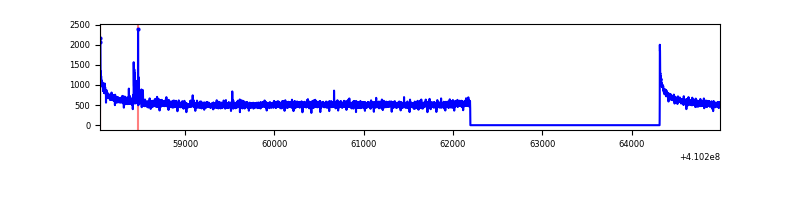 |
| B | 6944 | 4823 | 132 | 132 | 1.90% | 2.74% | 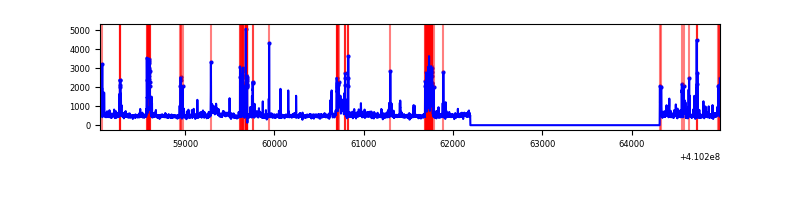 |
| C | 6944 | 4823 | 4 | 4 | 0.06% | 0.08% | 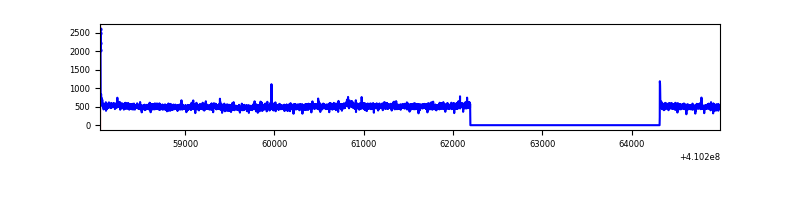 |
| D | 6944 | 4822 | 3123 | 3123 | 44.97% | 64.77% | 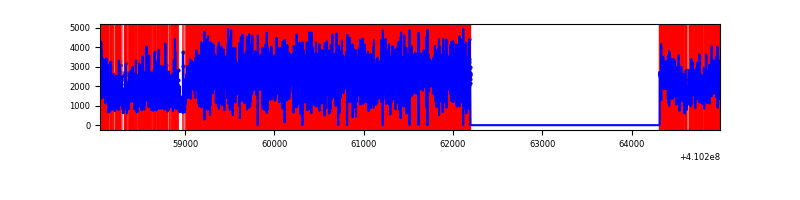 |
Top three noisy pixels from each quadrant. If the there are fewer than three noisy pixels in the level2.evt file, extra rows are filled as -1
| Pixel properties | Quadrant properties | ||||||
|---|---|---|---|---|---|---|---|
| Quadrant | DetID | PixID | Counts | Sigma | Mean | Median | Sigma |
| A | 10 | 83 | 399114 | 3454.52 | 570 | 559 | 115.4 |
| A | 13 | 248 | 25622 | 217.24 | 570 | 559 | 115.4 |
| A | 13 | 254 | 7587 | 60.92 | 570 | 559 | 115.4 |
| B | 5 | 172 | 280609 | 2633.8 | 552 | 538 | 106.3 |
| B | 5 | 184 | 228045 | 2139.48 | 552 | 538 | 106.3 |
| B | 5 | 255 | 154574 | 1448.56 | 552 | 538 | 106.3 |
| C | 15 | 214 | 224633 | 1725.38 | 554 | 558 | 129.9 |
| C | 3 | 233 | 22820 | 171.42 | 554 | 558 | 129.9 |
| C | 0 | 10 | 17608 | 131.29 | 554 | 558 | 129.9 |
| D | 12 | 235 | 9593955 | 118713.69 | 326 | 317 | 80.8 |
| D | 5 | 222 | 91042 | 1122.65 | 326 | 317 | 80.8 |
| D | 12 | 227 | 86909 | 1071.51 | 326 | 317 | 80.8 |
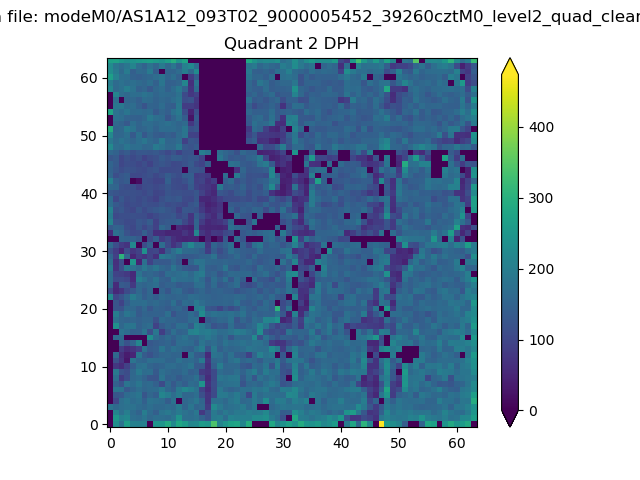
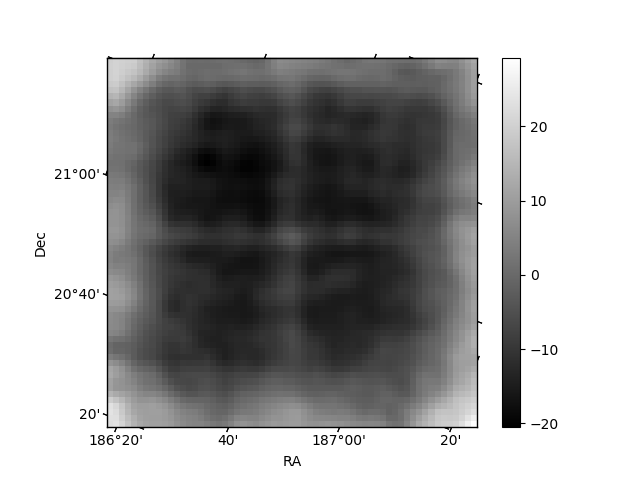
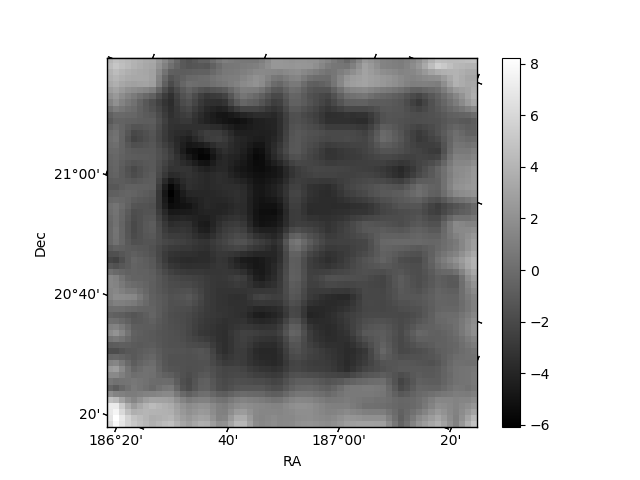
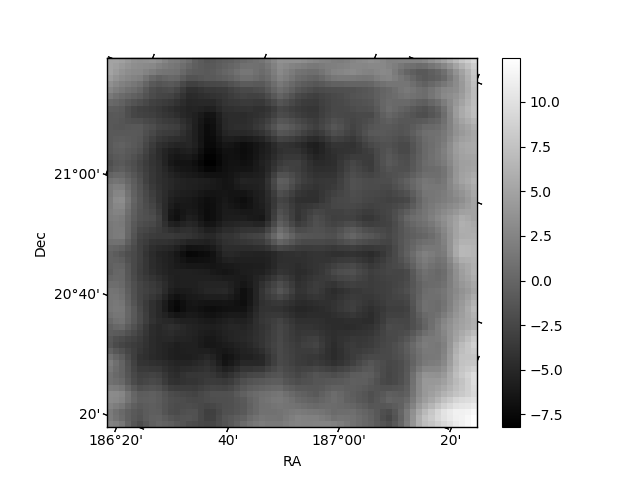
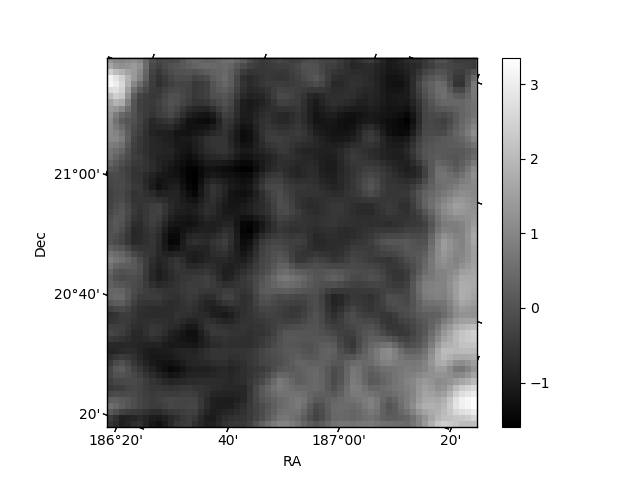
Histogram calculated using DETX and DETY for each event in the final _common_clean file
| Quadrant A | 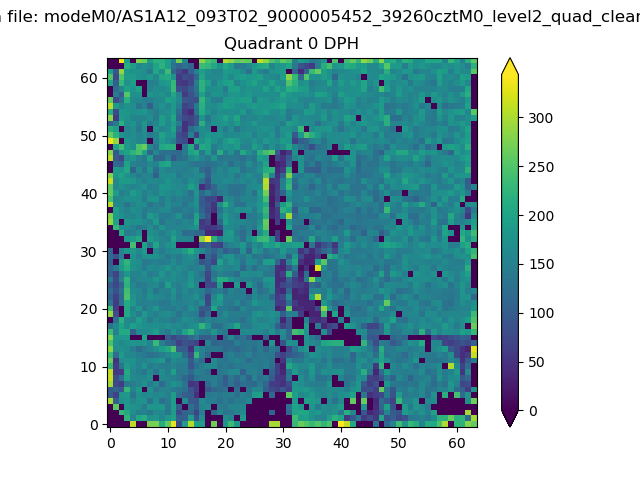 |
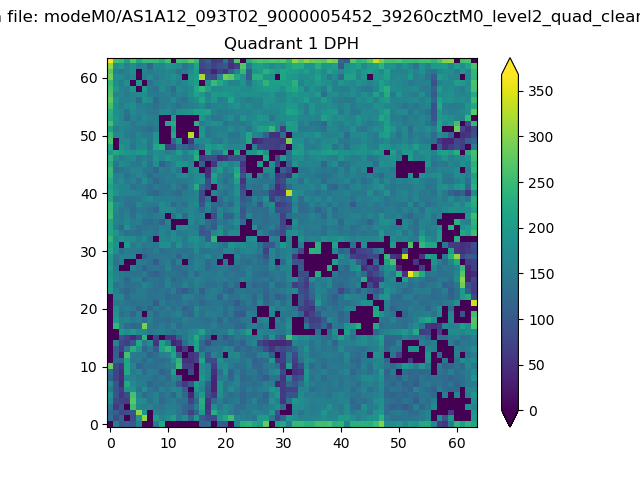 |
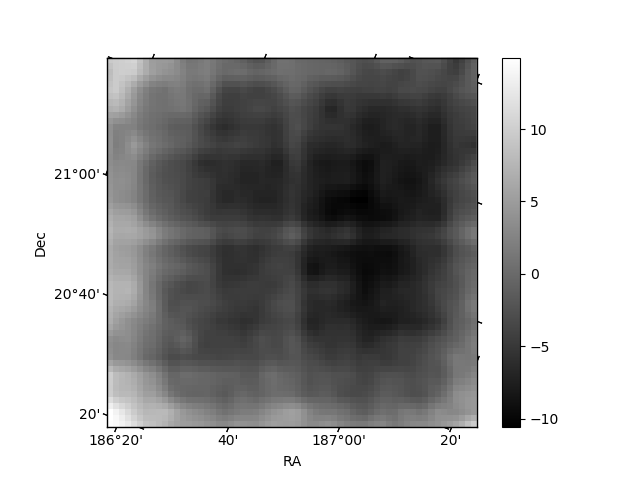
Quadrant B |
|---|---|---|---|
| Quadrant D | 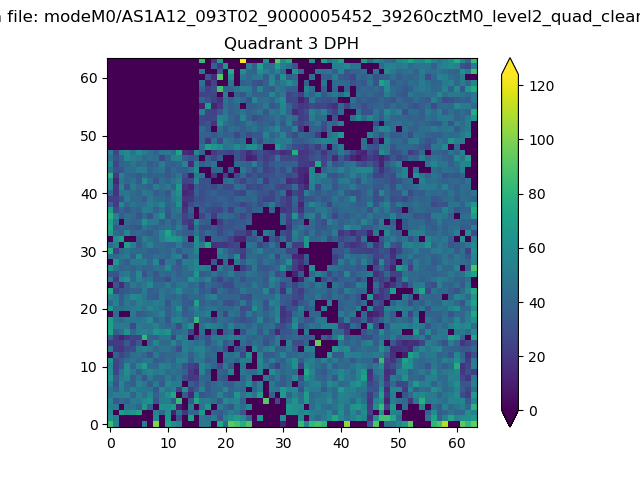 |
 |
Quadrant C |
| Plot type | Count rate plots | Images |
|---|---|---|
| Comparison with Poisson distribution Blue bars denote a histogram of data divided into 1 sec bins. Red curve is a Poisson curve with rate = median count rate of data. |
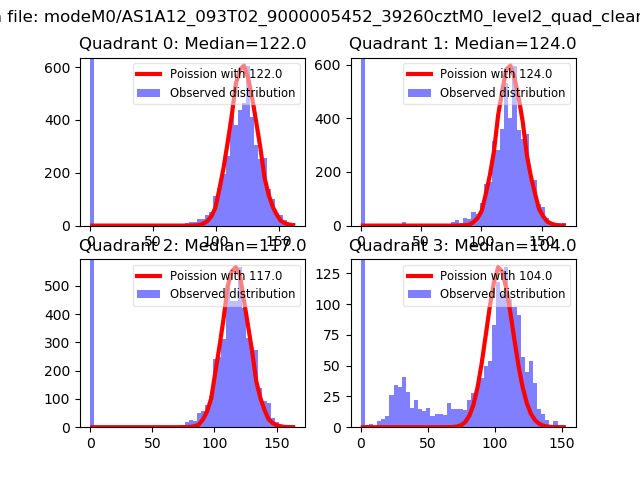 |
 |
| Quadrant-wise count rates Data is divided into 100 sec bins |
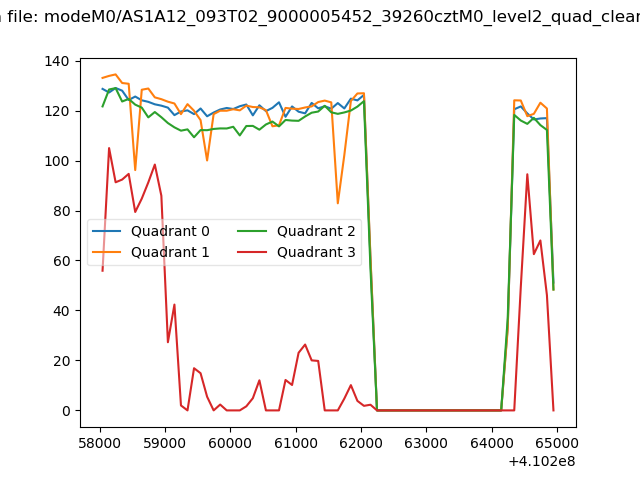 |
|
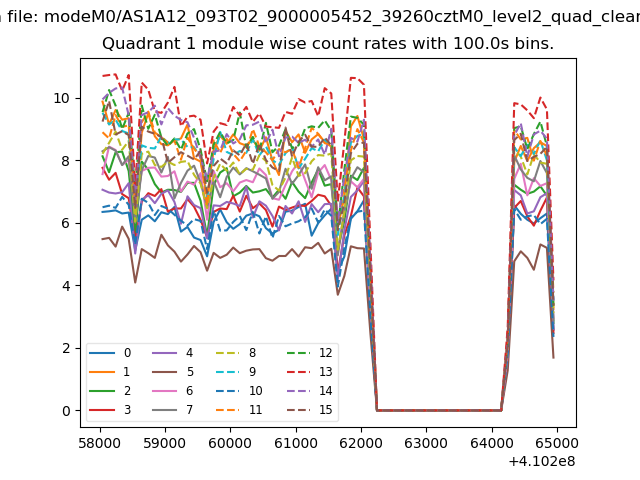
| Module-wise count rates for Quadrant A Data is divided into 100 sec bins |
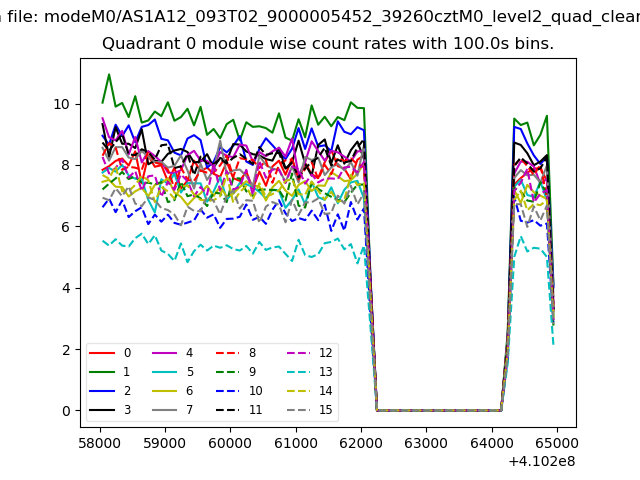 |
 |
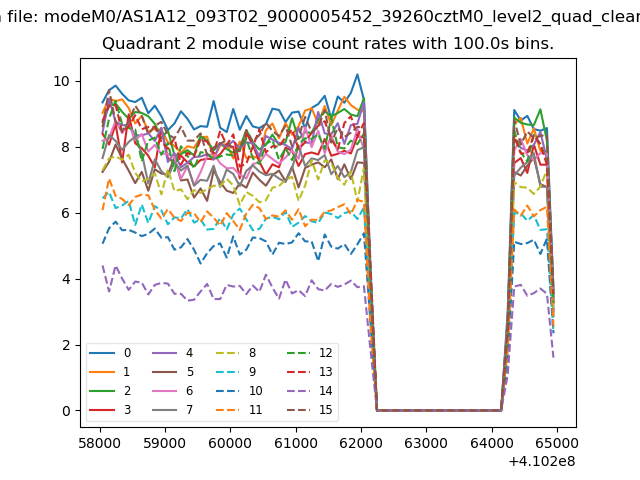
| Module-wise count rates for Quadrant B Data is divided into 100 sec bins |
 |
 |
| Module-wise count rates for Quadrant C Data is divided into 100 sec bins |
 |
 |
| Module-wise count rates for Quadrant D Data is divided into 100 sec bins |
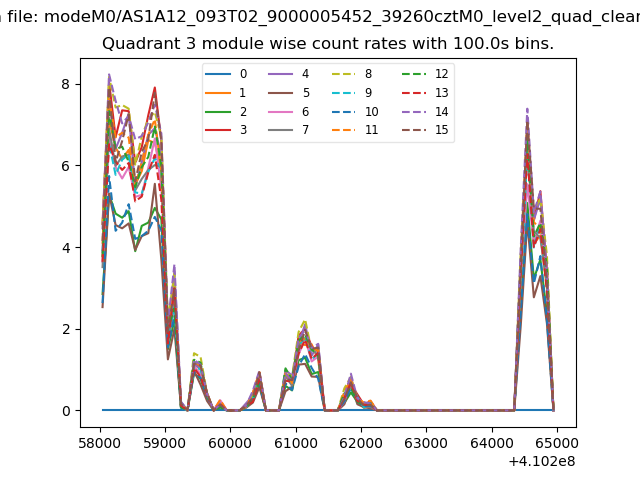 |
 |
| Parameter | Plot |
|---|---|
| CZT HV Monitor | 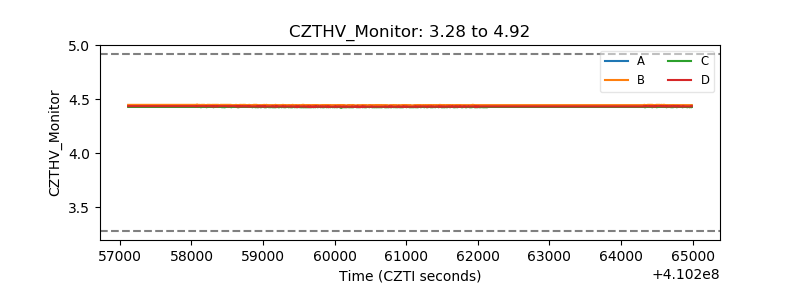 |
| D_VDD | 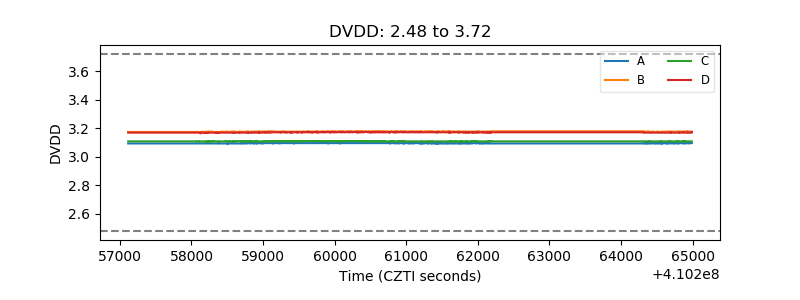 |
| Temperature 1 | 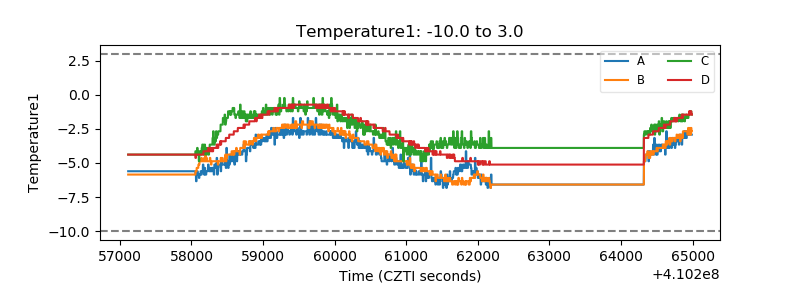 |
| Veto HV Monitor | 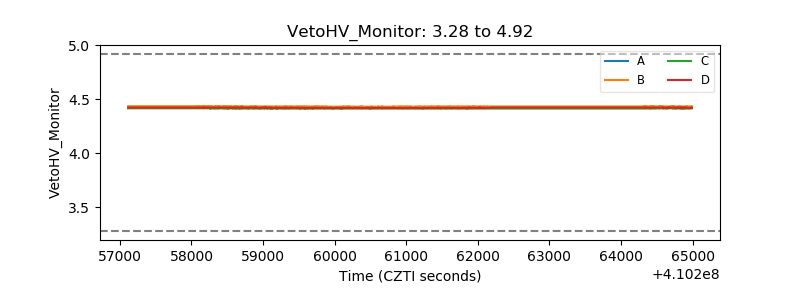 |
| Veto LLD | 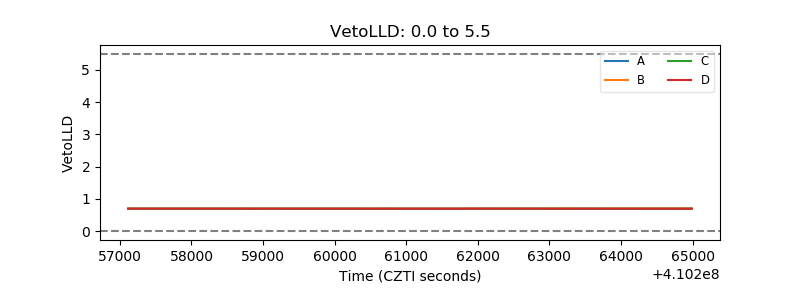 |
| Alpha Counter | 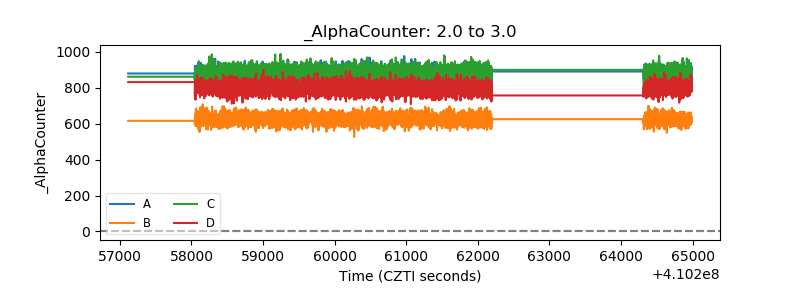 |
| _CPM_Rate | 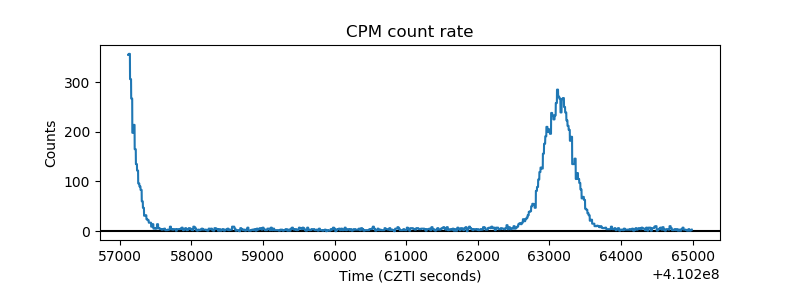 |
| CZT Counter | 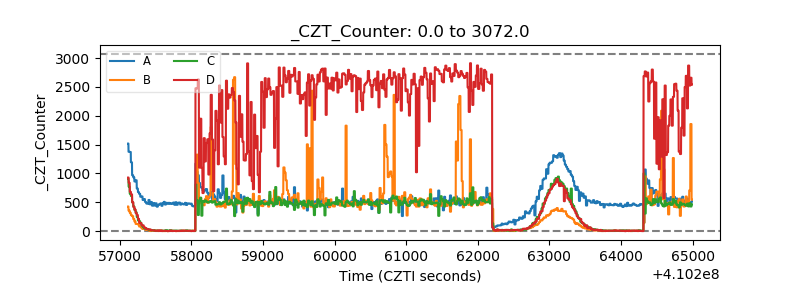 |
| +2.5 Volts monitor | 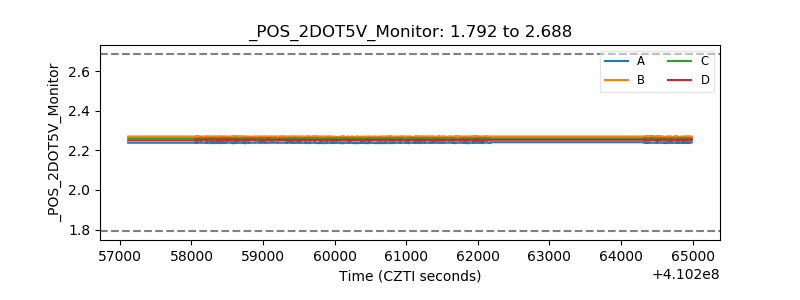 |
| +5 Volts monitor | 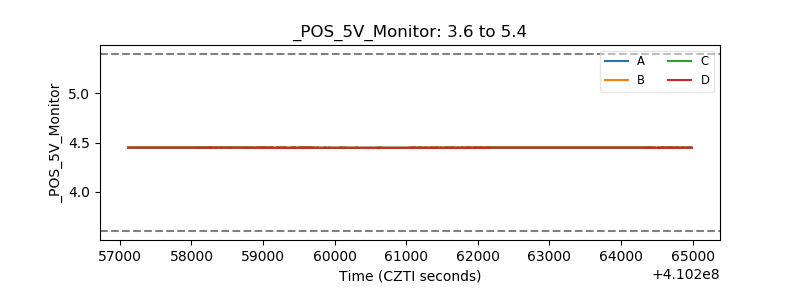 |
| _ROLL_ROT |  |
| _Roll_DEC | 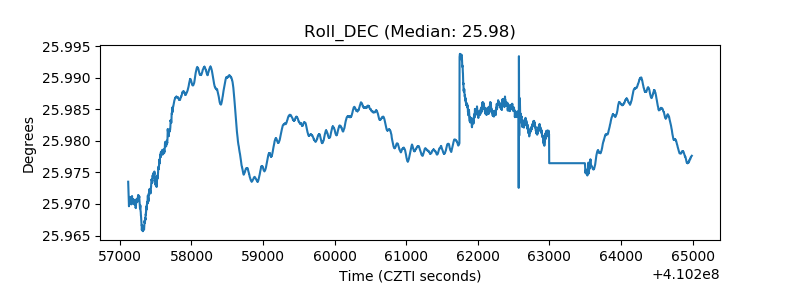 |
| _Roll_RA | 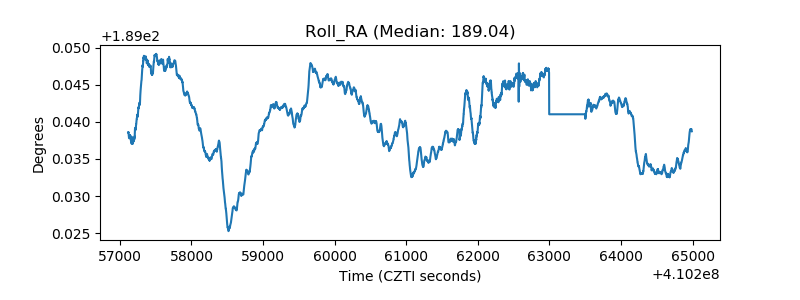 |
| Veto Counter | 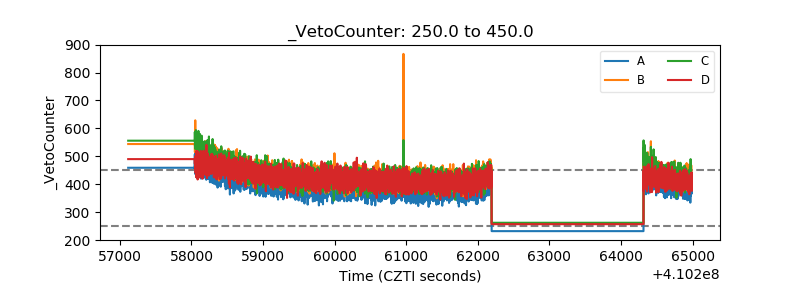 |