| Param | Original file | Final file |
|---|---|---|
| Filename | modeM0/AS1A12_093T02_9000005452_39261cztM0_level2.fits | modeM0/AS1A12_093T02_9000005452_39261cztM0_level2_quad_clean.evt |
| Size (bytes) | 546,747,840 | 74,165,760 |
| Size | 521.4 MB | 70.7 MB |
| Events in quadrant A | 2,670,813 | 587,117 |
| Events in quadrant B | 2,930,960 | 590,885 |
| Events in quadrant C | 2,486,625 | 565,840 |
| Events in quadrant D | 11,756,047 | 146,957 |
| Mode M0 | |||
|---|---|---|---|
| Quadrant | BADHDUFLAG | Total packets | Discarded packets |
| A | 0 | 10852 | 2 |
| B | 0 | 11928 | 1 |
| C | 0 | 10316 | 1 |
| D | 0 | 38423 | 1 |
| Mode SS | |||
|---|---|---|---|
| Quadrant | BADHDUFLAG | Total packets | Discarded packets |
| A | 0 | 102 | 0 |
| B | 0 | 102 | 0 |
| C | 0 | 102 | 0 |
| D | 0 | 102 | 0 |
| Mode M9 | |||
|---|---|---|---|
| Quadrant | BADHDUFLAG | Total packets | Discarded packets |
| A | 0 | 28 | 0 |
| B | 0 | 28 | 0 |
| C | 0 | 28 | 0 |
| D | 0 | 29 | 0 |
| Quadrant | Total seconds | Saturated seconds | Saturation percentage |
|---|---|---|---|
| A | 5067 | 9 | 0.177620% |
| B | 5067 | 121 | 2.388001% |
| C | 5067 | 4 | 0.078942% |
| D | 5067 | 3901 | 76.988356% |
Noise dominated data is calculated using 1-second bins in cleaned event files. If a bin has >2000 counts, and if more than 50% of those come from <1% of pixels, then it is considered to be noise-dominated and hence unusable.
| Quadrant | # 1 sec bins | Bins with >0 counts | Bins with >2000 counts | High rate bins dominated by noise | Noise dominated (total time) | Noise dominated (detector-on time) | Marked lightcurve |
|---|---|---|---|---|---|---|---|
| A | 7009 | 5068 | 2 | 2 | 0.03% | 0.04% | 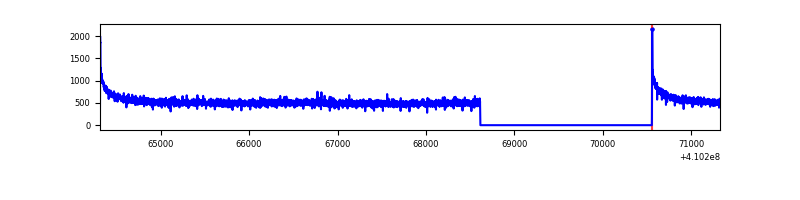 |
| B | 7009 | 5068 | 80 | 80 | 1.14% | 1.58% | 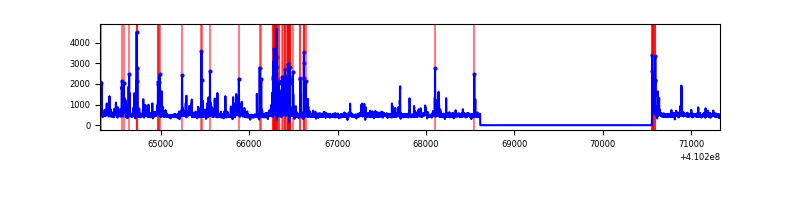 |
| C | 7009 | 5068 | 0 | 0 | 0.00% | 0.00% | 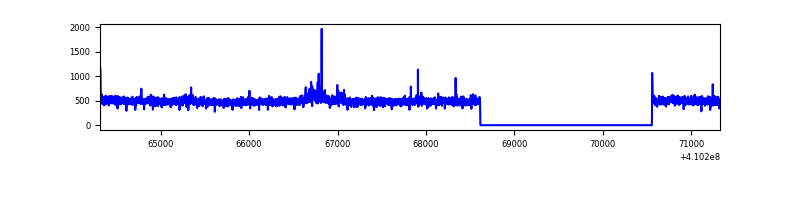 |
| D | 7009 | 5068 | 3483 | 3483 | 49.69% | 68.73% | 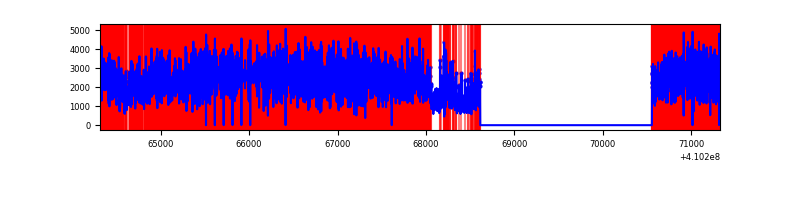 |
Top three noisy pixels from each quadrant. If the there are fewer than three noisy pixels in the level2.evt file, extra rows are filled as -1
| Pixel properties | Quadrant properties | ||||||
|---|---|---|---|---|---|---|---|
| Quadrant | DetID | PixID | Counts | Sigma | Mean | Median | Sigma |
| A | 10 | 83 | 422129 | 3581.29 | 581 | 570 | 117.7 |
| A | 13 | 254 | 6870 | 53.52 | 581 | 570 | 117.7 |
| A | 3 | 137 | 6200 | 47.83 | 581 | 570 | 117.7 |
| B | 5 | 172 | 473410 | 4288.38 | 570 | 555 | 110.3 |
| B | 5 | 255 | 88289 | 795.67 | 570 | 555 | 110.3 |
| B | 5 | 184 | 83325 | 750.65 | 570 | 555 | 110.3 |
| C | 15 | 214 | 232979 | 1748.67 | 566 | 570 | 132.9 |
| C | 3 | 233 | 29542 | 217.99 | 566 | 570 | 132.9 |
| C | 0 | 10 | 6343 | 43.44 | 566 | 570 | 132.9 |
| D | 12 | 235 | 9653583 | 113987.61 | 335 | 324 | 84.7 |
| D | 12 | 227 | 246176 | 2903.07 | 335 | 324 | 84.7 |
| D | 12 | 233 | 183275 | 2160.32 | 335 | 324 | 84.7 |
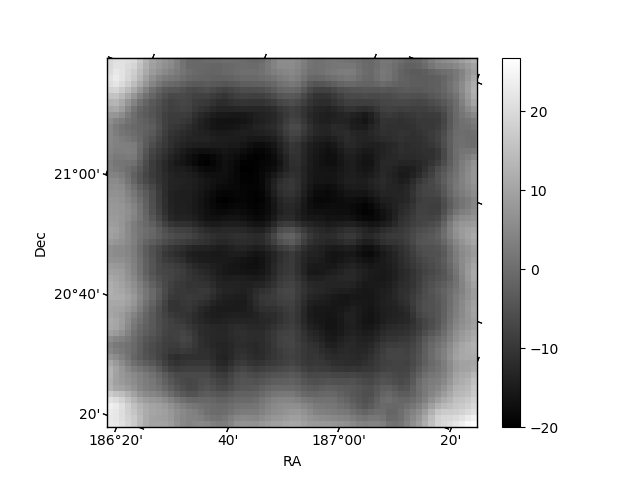
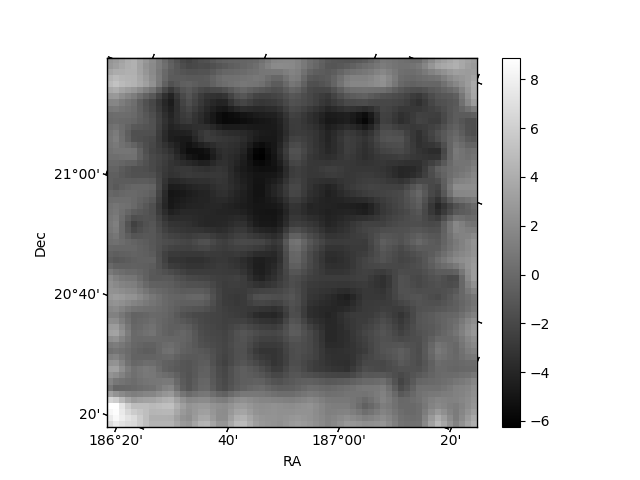
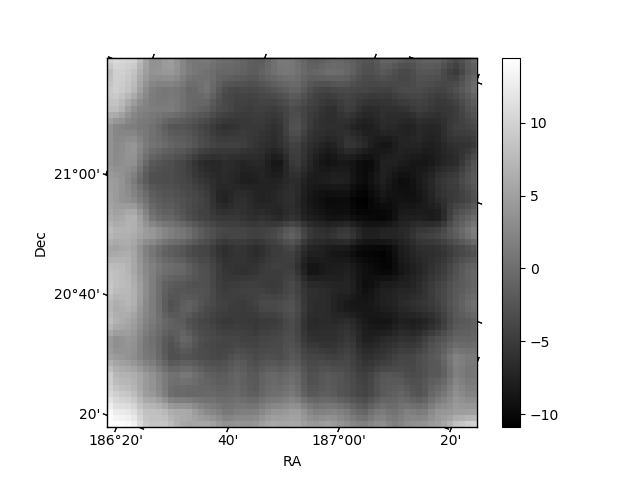
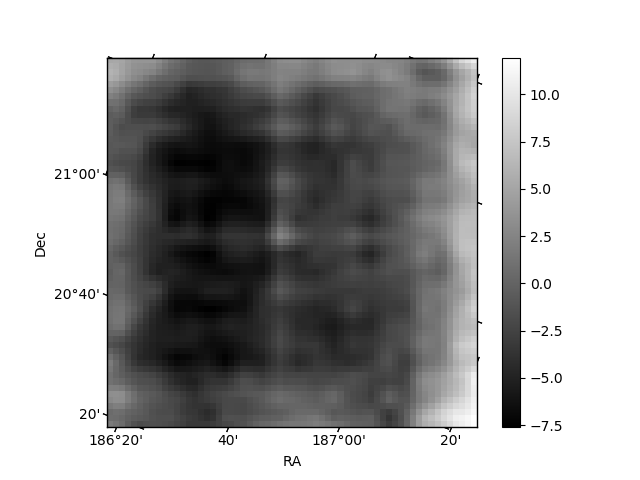
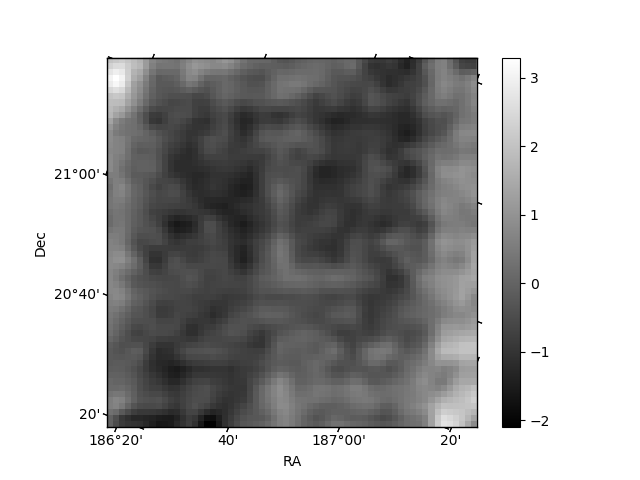
Histogram calculated using DETX and DETY for each event in the final _common_clean file
| Quadrant A | 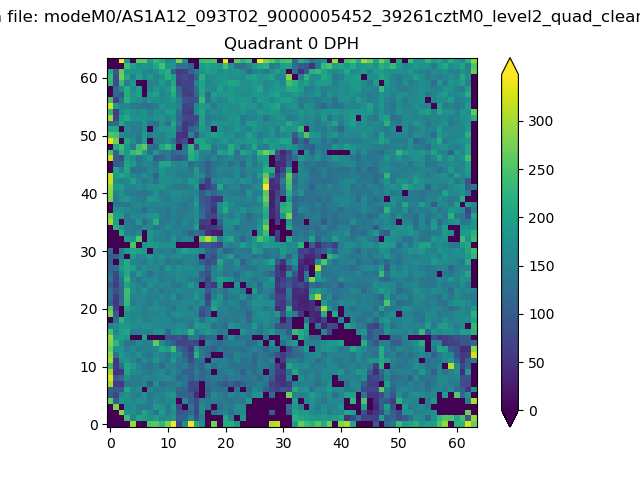 |
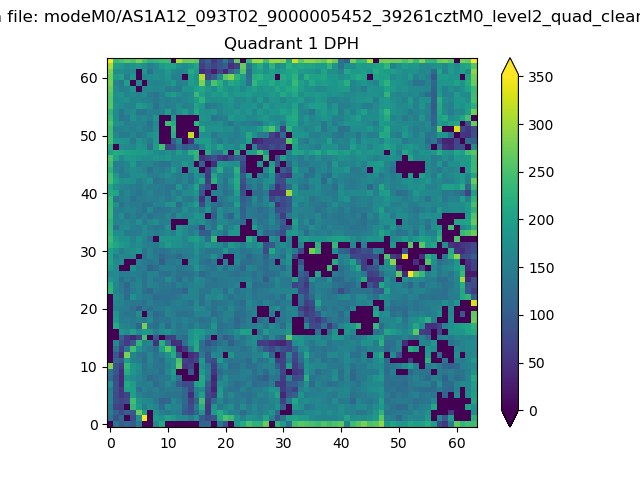 |
Quadrant B |
|---|---|---|---|
| Quadrant D | 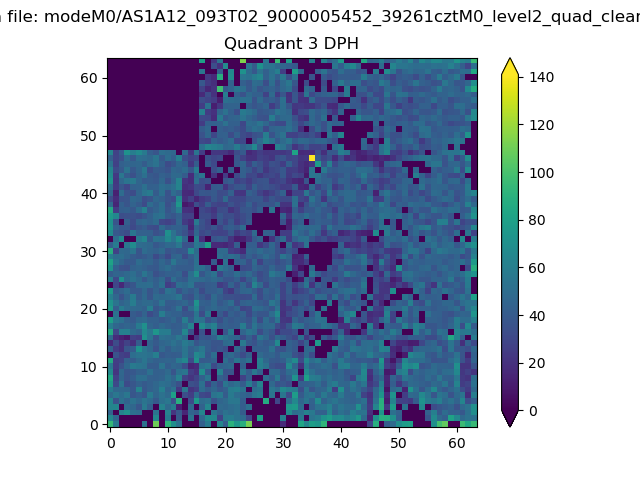 |
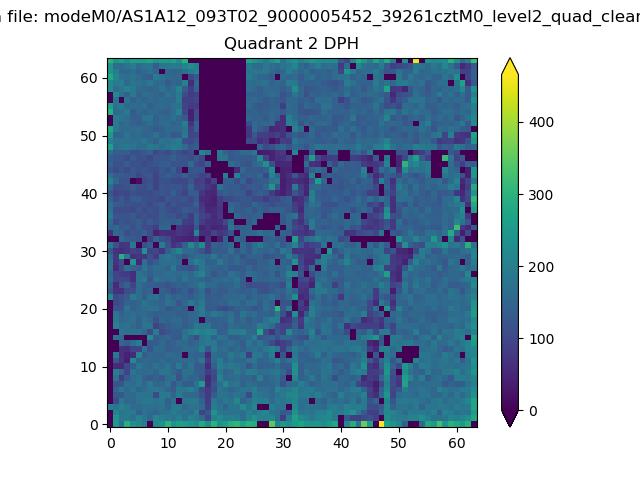 |
Quadrant C |
| Plot type | Count rate plots | Images |
|---|---|---|
| Comparison with Poisson distribution Blue bars denote a histogram of data divided into 1 sec bins. Red curve is a Poisson curve with rate = median count rate of data. |
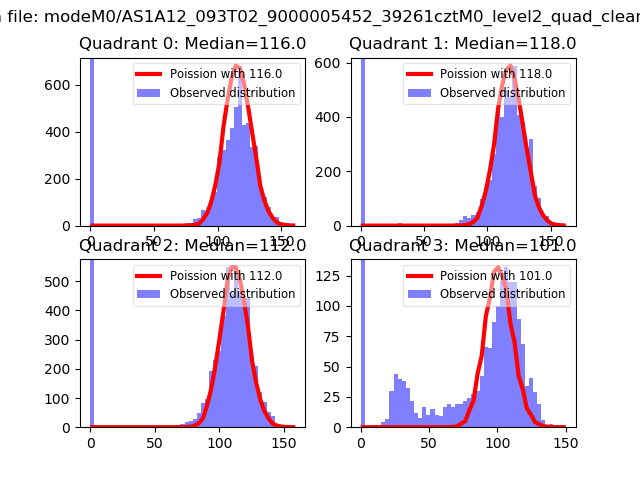 |
 |
| Quadrant-wise count rates Data is divided into 100 sec bins |
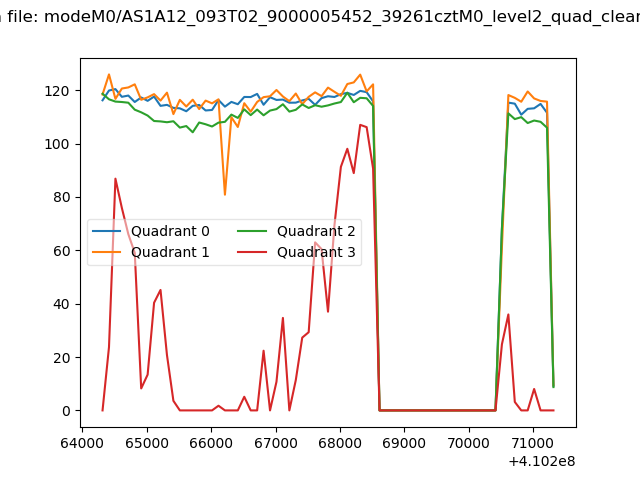 |
|
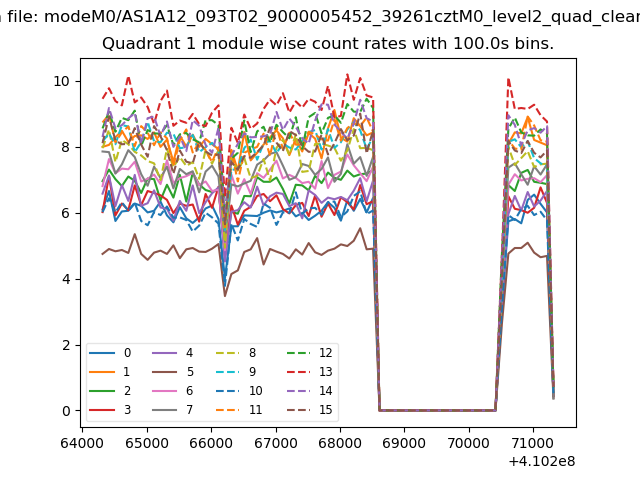
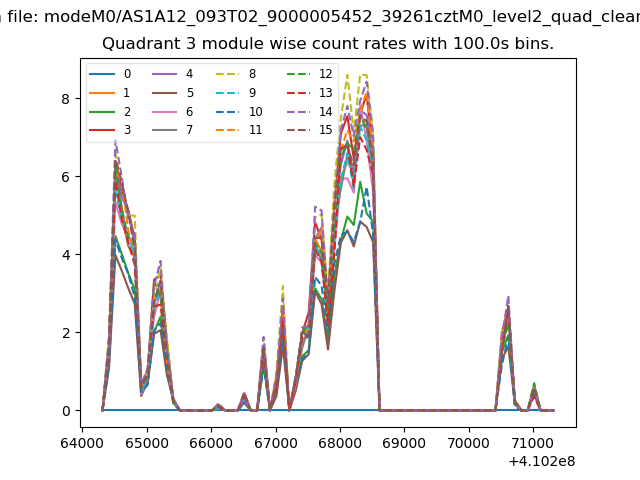
| Module-wise count rates for Quadrant A Data is divided into 100 sec bins |
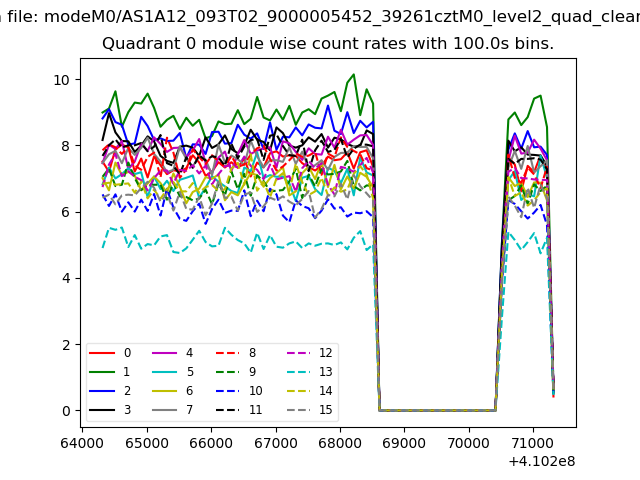 |
 |
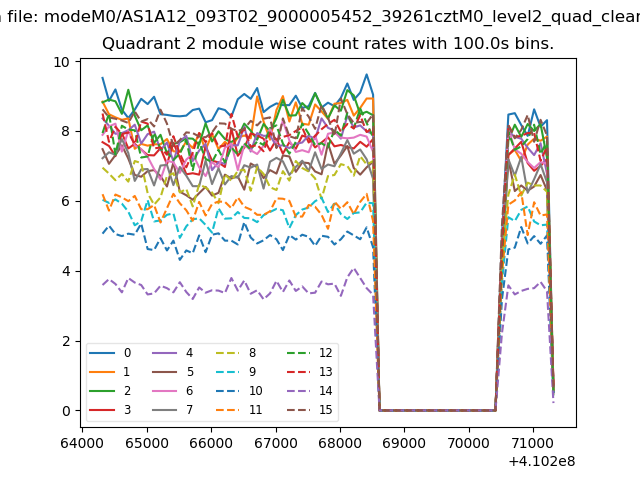
| Module-wise count rates for Quadrant B Data is divided into 100 sec bins |
 |
 |
| Module-wise count rates for Quadrant C Data is divided into 100 sec bins |
 |
 |
| Module-wise count rates for Quadrant D Data is divided into 100 sec bins |
 |
 |
| Parameter | Plot |
|---|---|
| CZT HV Monitor | 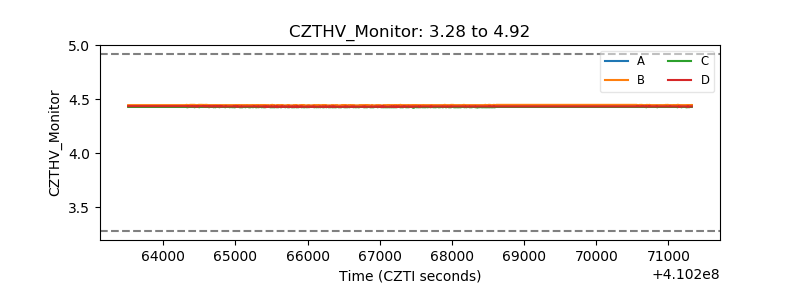 |
| D_VDD | 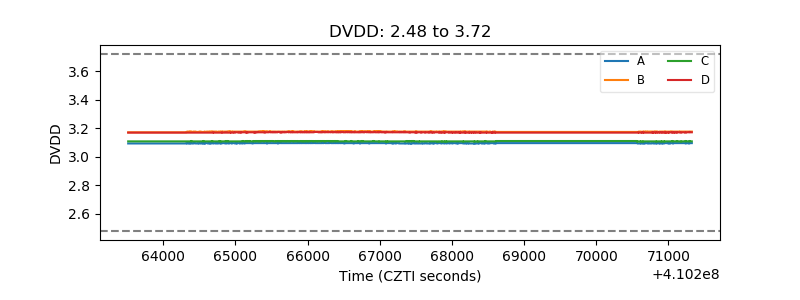 |
| Temperature 1 | 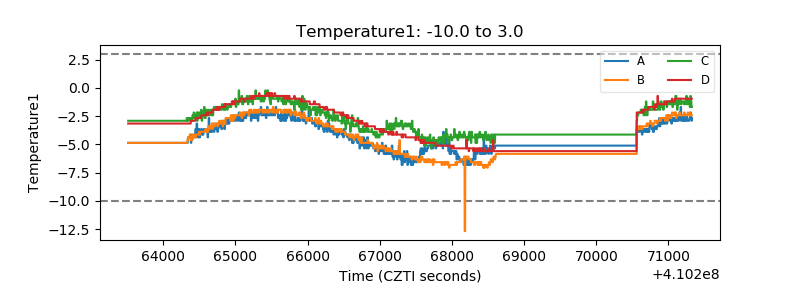 |
| Veto HV Monitor | 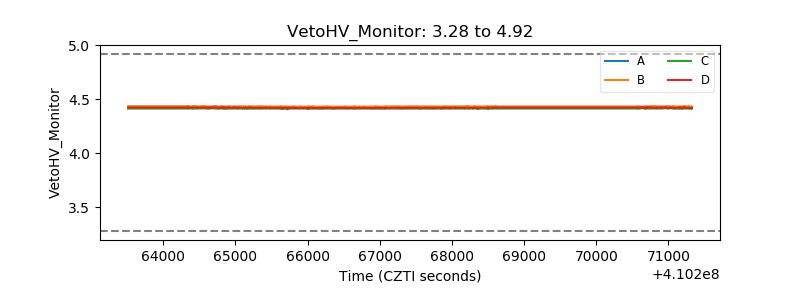 |
| Veto LLD | 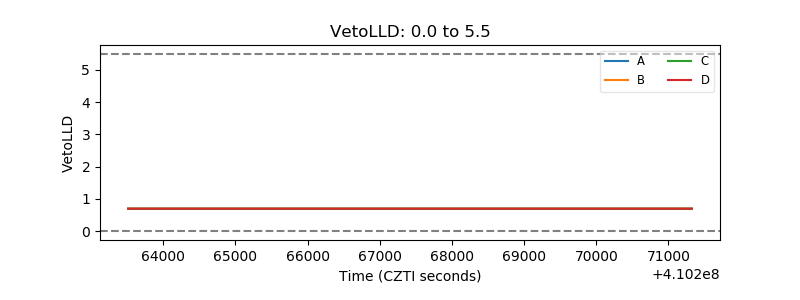 |
| Alpha Counter | 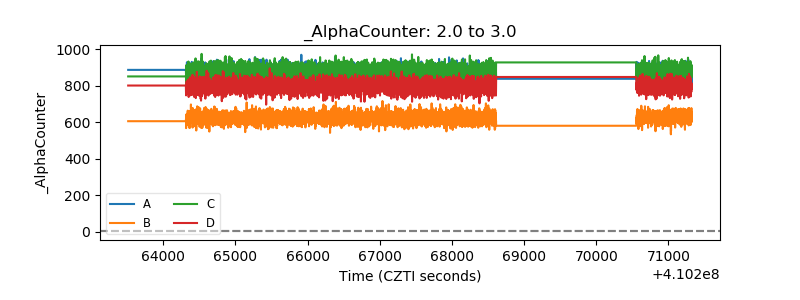 |
| _CPM_Rate | 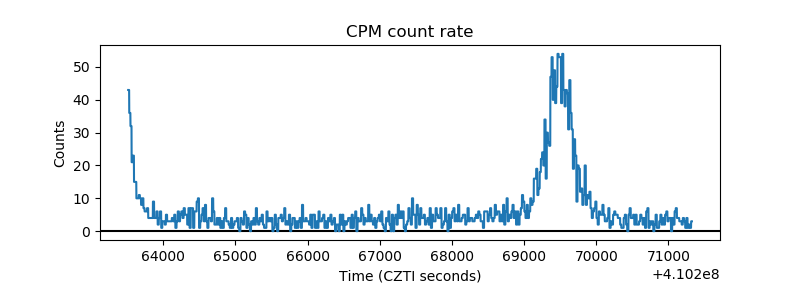 |
| CZT Counter | 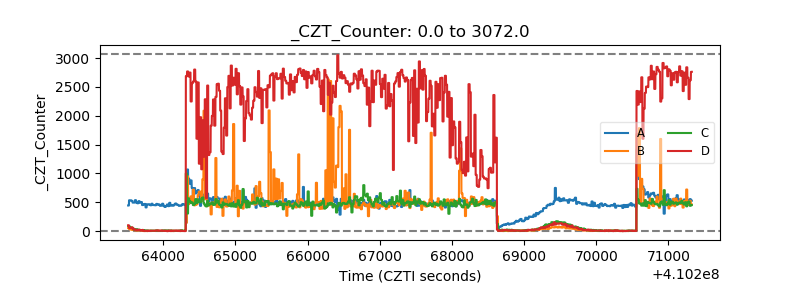 |
| +2.5 Volts monitor |  |
| +5 Volts monitor | 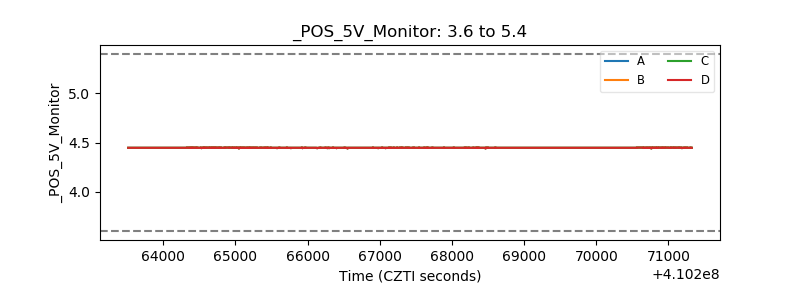 |
| _ROLL_ROT | 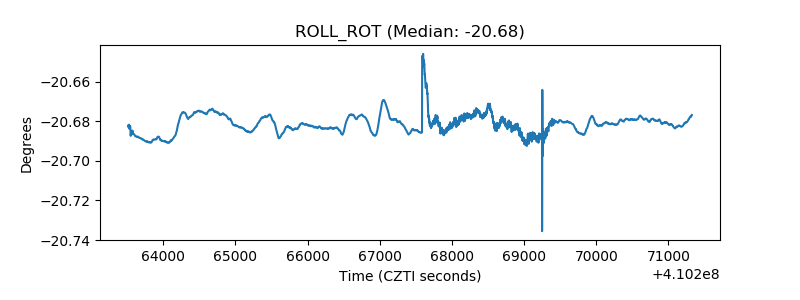 |
| _Roll_DEC |  |
| _Roll_RA | 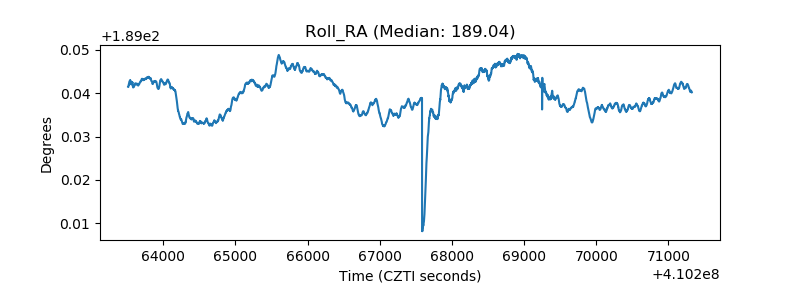 |
| Veto Counter | 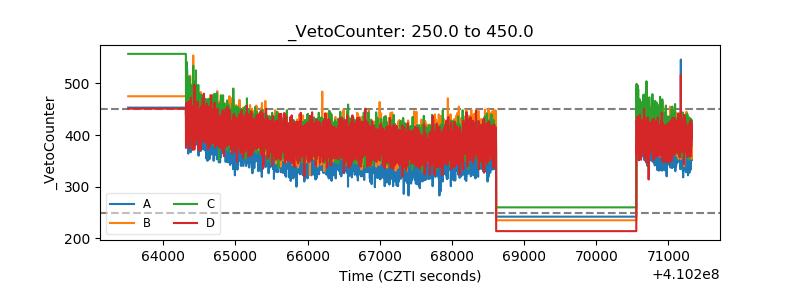 |