| Param | Original file | Final file |
|---|---|---|
| Filename | modeM0/AS1A12_093T02_9000005452_39262cztM0_level2.fits | modeM0/AS1A12_093T02_9000005452_39262cztM0_level2_quad_clean.evt |
| Size (bytes) | 360,656,640 | 44,187,840 |
| Size | 343.9 MB | 42.1 MB |
| Events in quadrant A | 1,641,718 | 361,380 |
| Events in quadrant B | 1,916,914 | 355,566 |
| Events in quadrant C | 1,581,955 | 346,605 |
| Events in quadrant D | 7,957,101 | 45,643 |
| Mode M0 | |||
|---|---|---|---|
| Quadrant | BADHDUFLAG | Total packets | Discarded packets |
| A | 0 | 6801 | 1 |
| B | 0 | 7816 | 1 |
| C | 0 | 6603 | 1 |
| D | 0 | 25834 | 1 |
| Mode SS | |||
|---|---|---|---|
| Quadrant | BADHDUFLAG | Total packets | Discarded packets |
| A | 0 | 64 | 0 |
| B | 0 | 64 | 0 |
| C | 0 | 64 | 0 |
| D | 0 | 64 | 0 |
| Mode M9 | |||
|---|---|---|---|
| Quadrant | BADHDUFLAG | Total packets | Discarded packets |
| A | 0 | 7 | 0 |
| B | 0 | 7 | 0 |
| C | 0 | 7 | 0 |
| D | 0 | 8 | 0 |
| Quadrant | Total seconds | Saturated seconds | Saturation percentage |
|---|---|---|---|
| A | 3222 | 3 | 0.093110% |
| B | 3222 | 130 | 4.034761% |
| C | 3222 | 2 | 0.062073% |
| D | 3222 | 2887 | 89.602731% |
Noise dominated data is calculated using 1-second bins in cleaned event files. If a bin has >2000 counts, and if more than 50% of those come from <1% of pixels, then it is considered to be noise-dominated and hence unusable.
| Quadrant | # 1 sec bins | Bins with >0 counts | Bins with >2000 counts | High rate bins dominated by noise | Noise dominated (total time) | Noise dominated (detector-on time) | Marked lightcurve |
|---|---|---|---|---|---|---|---|
| A | 3222 | 3222 | 2 | 2 | 0.06% | 0.06% | 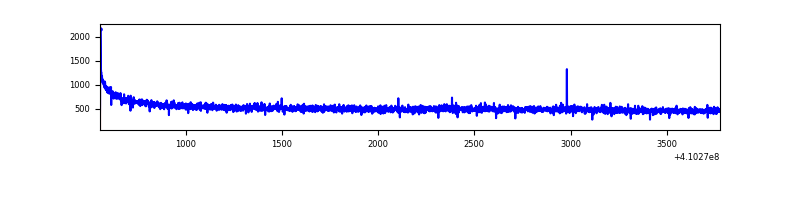 |
| B | 3222 | 3222 | 88 | 88 | 2.73% | 2.73% | 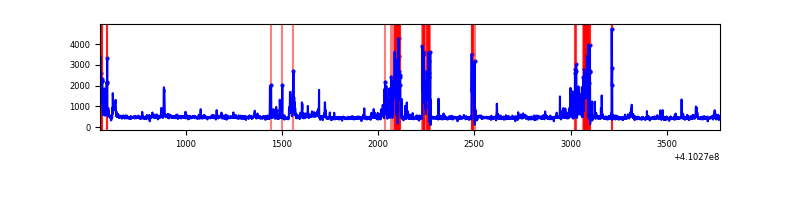 |
| C | 3222 | 3222 | 0 | 0 | 0.00% | 0.00% | 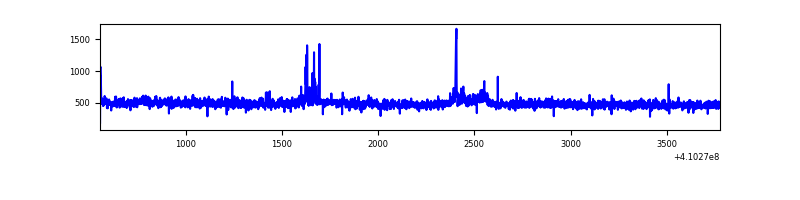 |
| D | 3222 | 3222 | 2546 | 2546 | 79.02% | 79.02% | 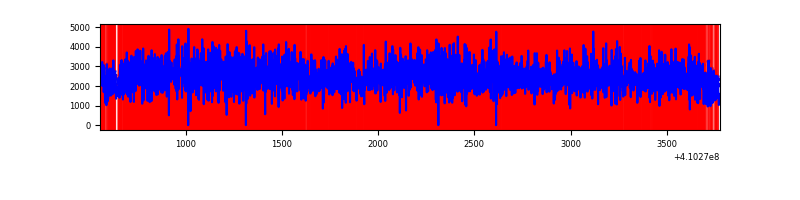 |
Top three noisy pixels from each quadrant. If the there are fewer than three noisy pixels in the level2.evt file, extra rows are filled as -1
| Pixel properties | Quadrant properties | ||||||
|---|---|---|---|---|---|---|---|
| Quadrant | DetID | PixID | Counts | Sigma | Mean | Median | Sigma |
| A | 10 | 83 | 244252 | 3231.62 | 361 | 353 | 75.5 |
| A | 13 | 254 | 4963 | 61.08 | 361 | 353 | 75.5 |
| A | 3 | 137 | 3795 | 45.61 | 361 | 353 | 75.5 |
| B | 5 | 172 | 206171 | 2969.02 | 351 | 340 | 69.3 |
| B | 15 | 35 | 144178 | 2074.8 | 351 | 340 | 69.3 |
| B | 5 | 255 | 109634 | 1576.52 | 351 | 340 | 69.3 |
| C | 15 | 214 | 143758 | 1714.9 | 352 | 354 | 83.6 |
| C | 3 | 233 | 57764 | 686.54 | 352 | 354 | 83.6 |
| C | 0 | 10 | 2662 | 27.6 | 352 | 354 | 83.6 |
| D | 12 | 235 | 6672968 | 129736.24 | 201 | 194 | 51.4 |
| D | 12 | 227 | 276556 | 5373.2 | 201 | 194 | 51.4 |
| D | 2 | 120 | 143530 | 2786.83 | 201 | 194 | 51.4 |
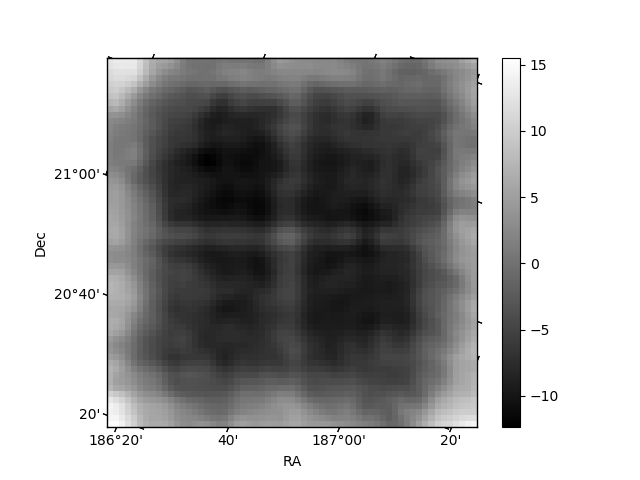
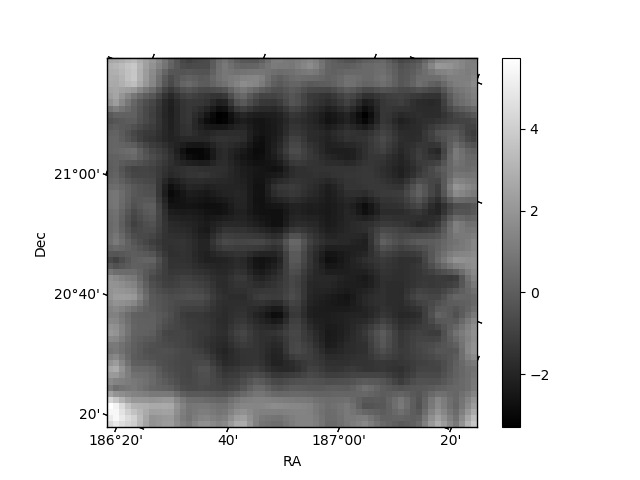
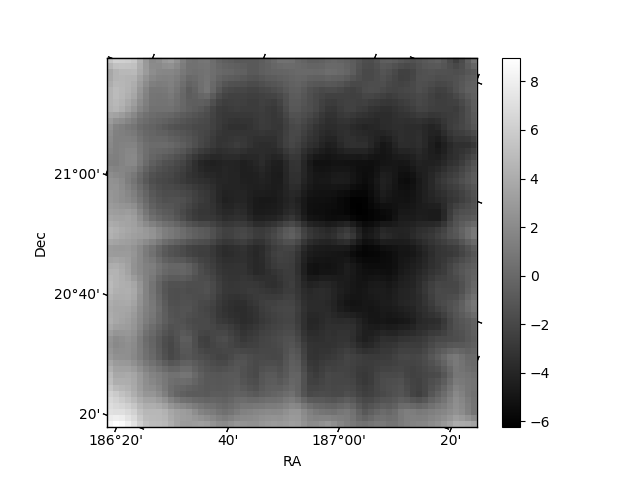
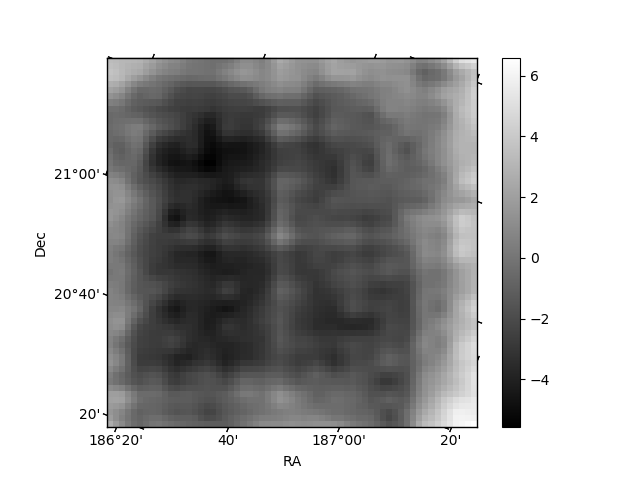
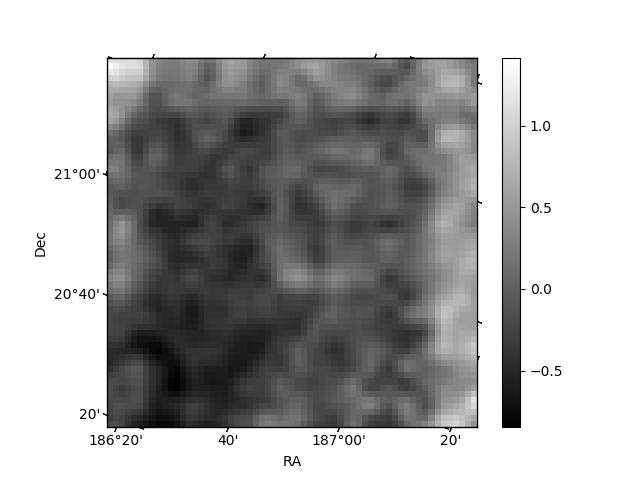
Histogram calculated using DETX and DETY for each event in the final _common_clean file
| Quadrant A | 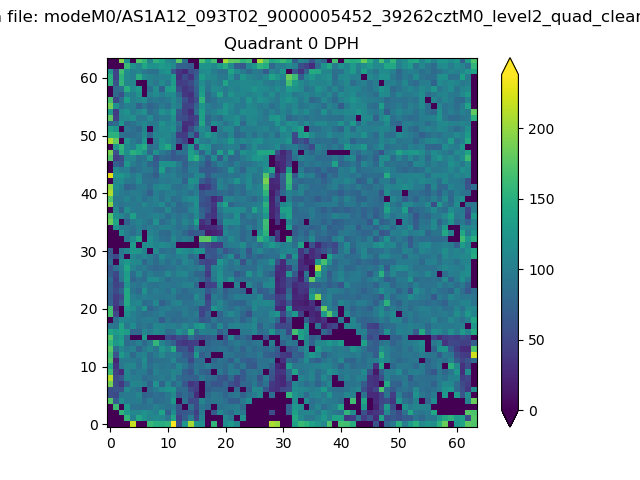 |
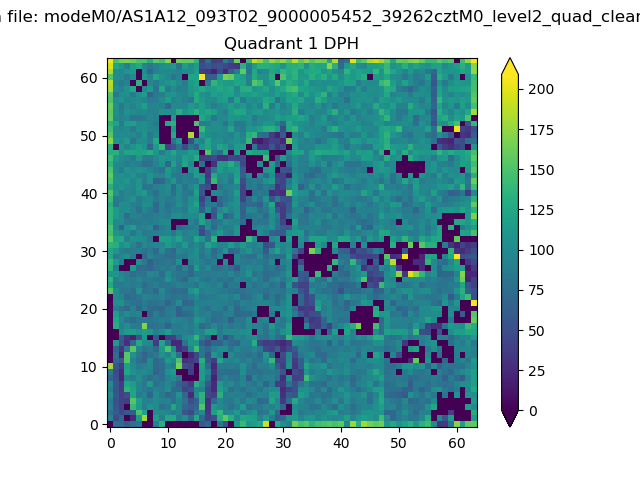 |
Quadrant B |
|---|---|---|---|
| Quadrant D | 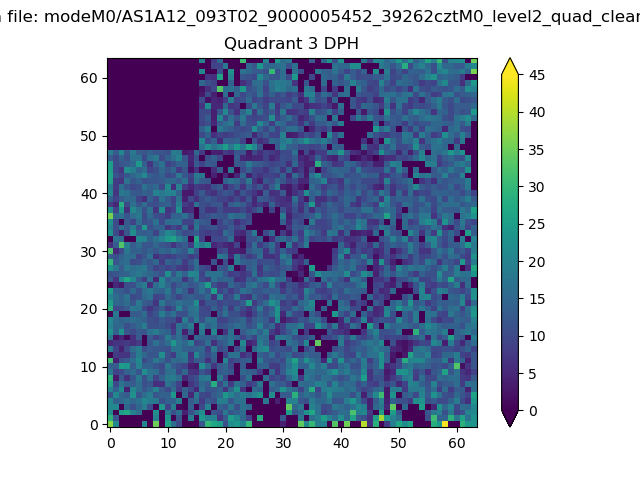 |
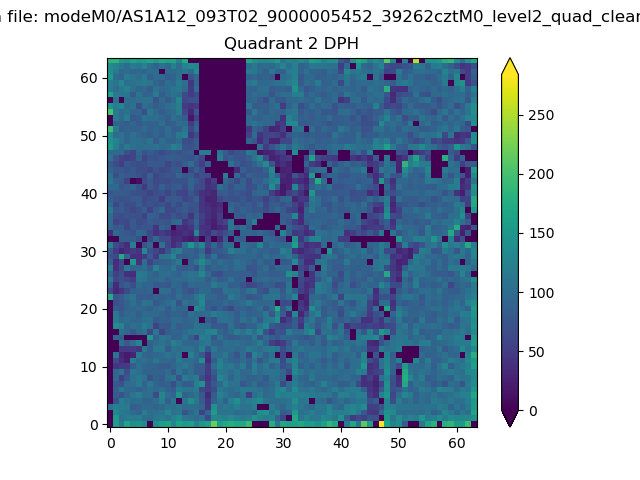 |
Quadrant C |
| Plot type | Count rate plots | Images |
|---|---|---|
| Comparison with Poisson distribution Blue bars denote a histogram of data divided into 1 sec bins. Red curve is a Poisson curve with rate = median count rate of data. |
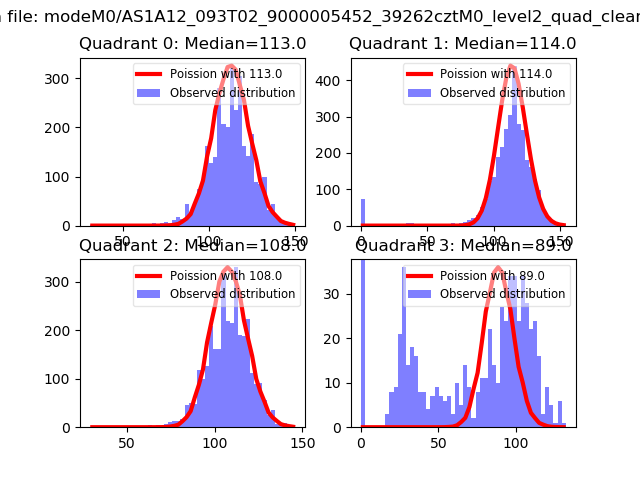 |
 |
| Quadrant-wise count rates Data is divided into 100 sec bins |
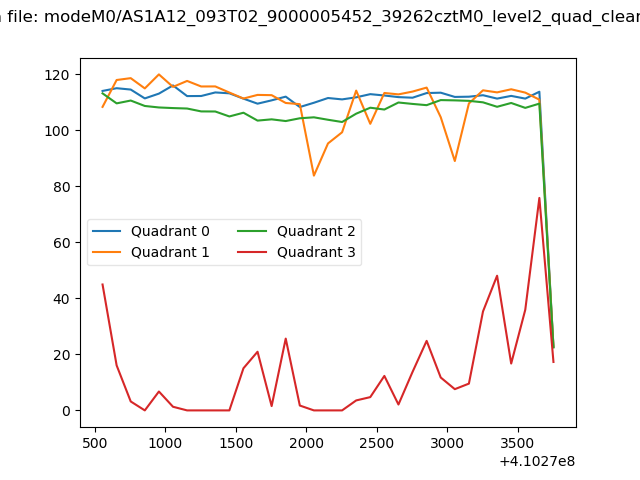 |
|
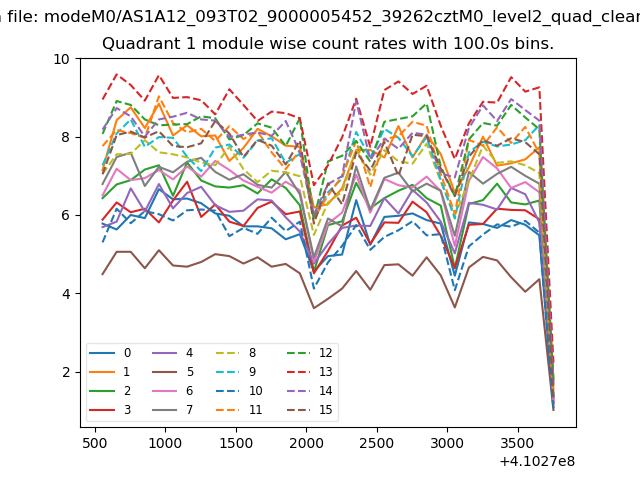
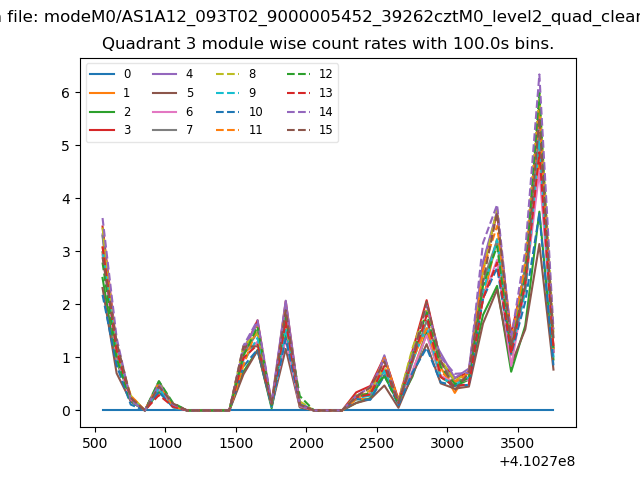
| Module-wise count rates for Quadrant A Data is divided into 100 sec bins |
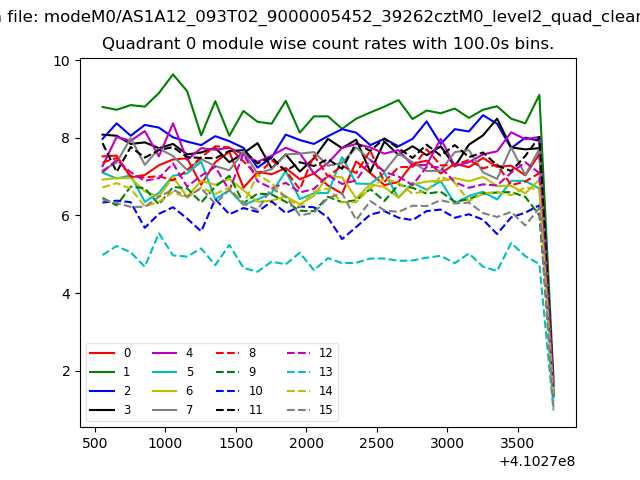 |
 |
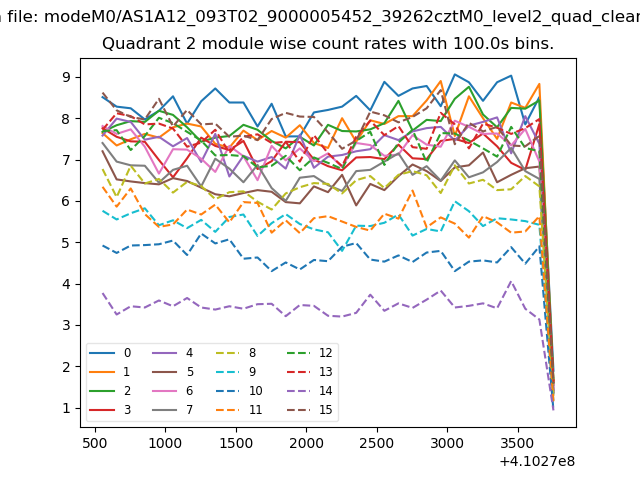
| Module-wise count rates for Quadrant B Data is divided into 100 sec bins |
 |
 |
| Module-wise count rates for Quadrant C Data is divided into 100 sec bins |
 |
 |
| Module-wise count rates for Quadrant D Data is divided into 100 sec bins |
 |
 |
| Parameter | Plot |
|---|---|
| CZT HV Monitor | 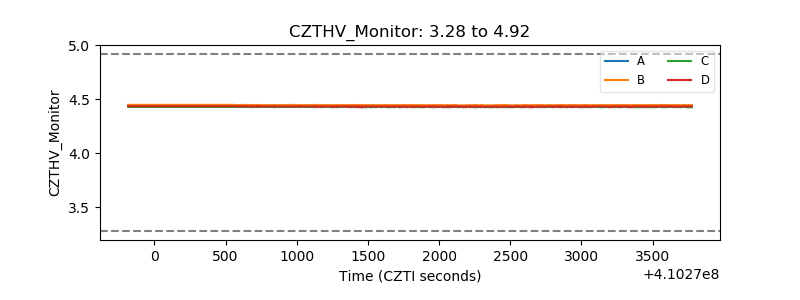 |
| D_VDD | 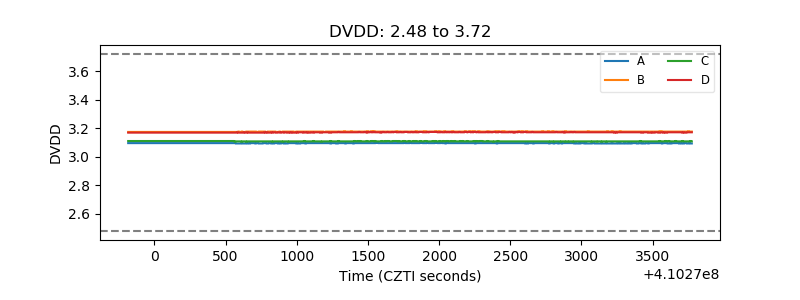 |
| Temperature 1 | 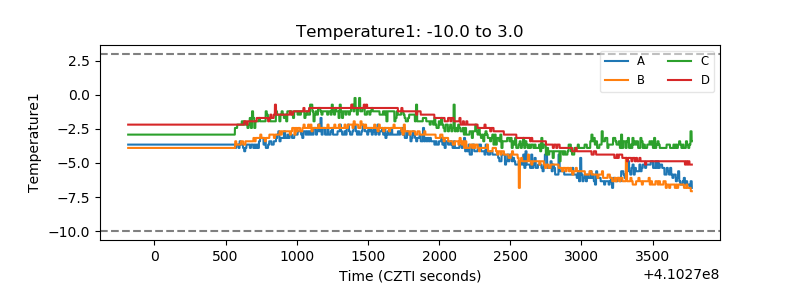 |
| Veto HV Monitor | 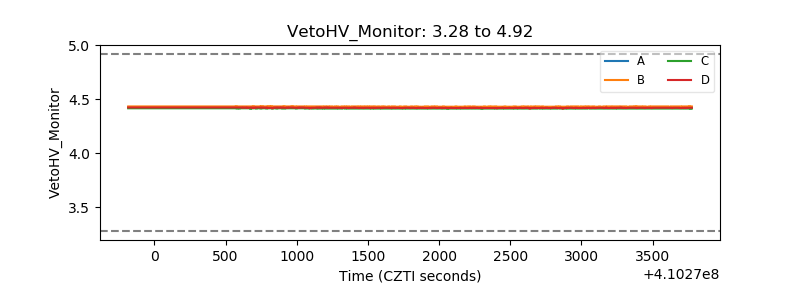 |
| Veto LLD | 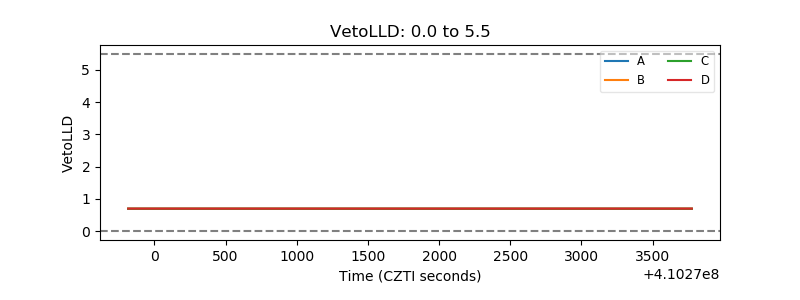 |
| Alpha Counter | 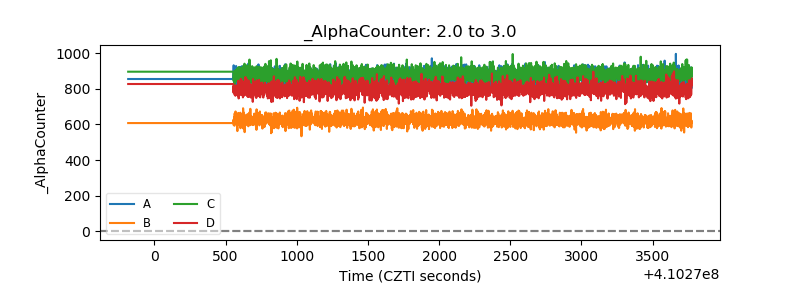 |
| _CPM_Rate | 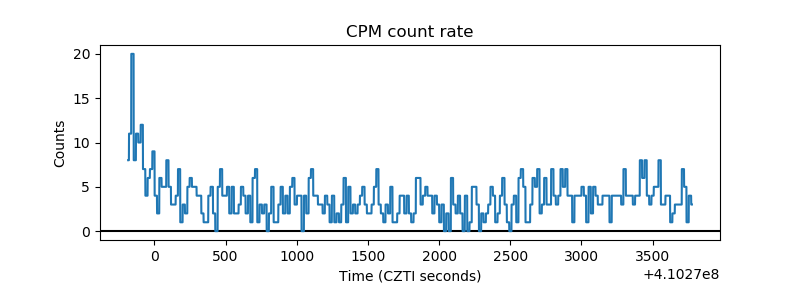 |
| CZT Counter | 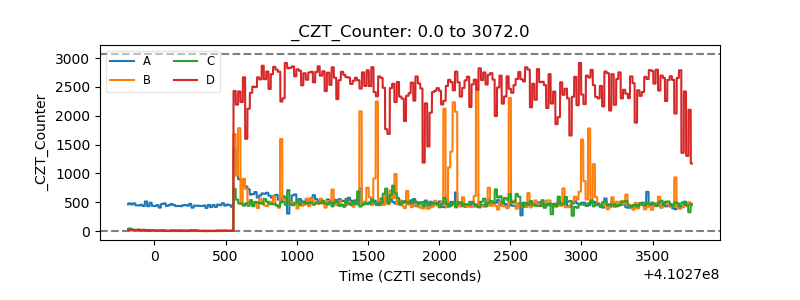 |
| +2.5 Volts monitor | 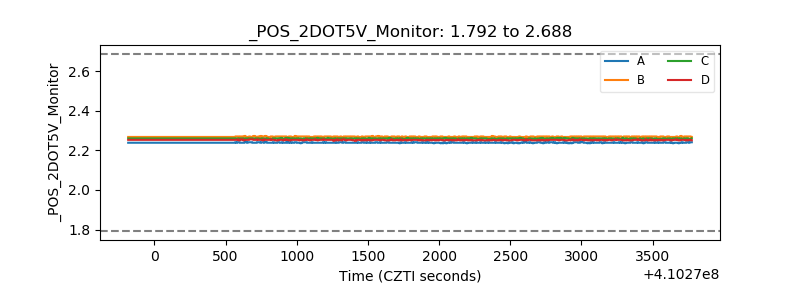 |
| +5 Volts monitor | 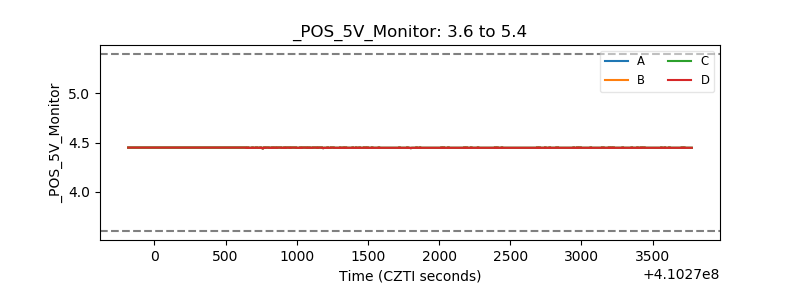 |
| _ROLL_ROT | 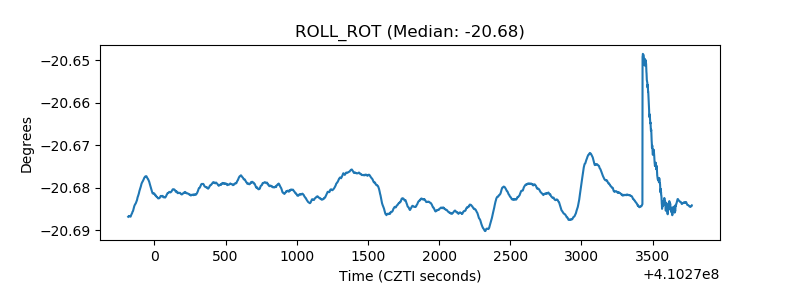 |
| _Roll_DEC | 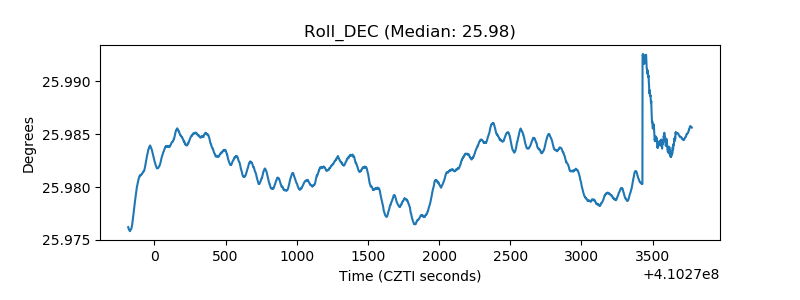 |
| _Roll_RA | 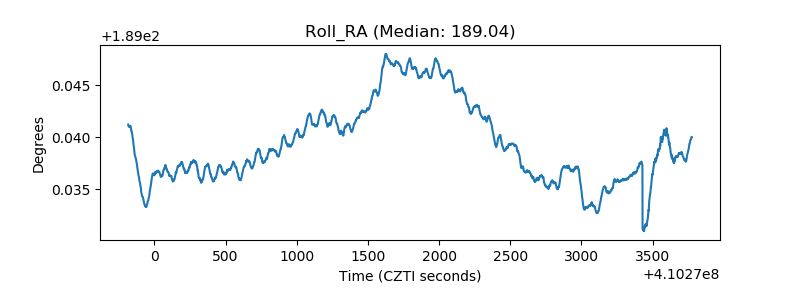 |
| Veto Counter | 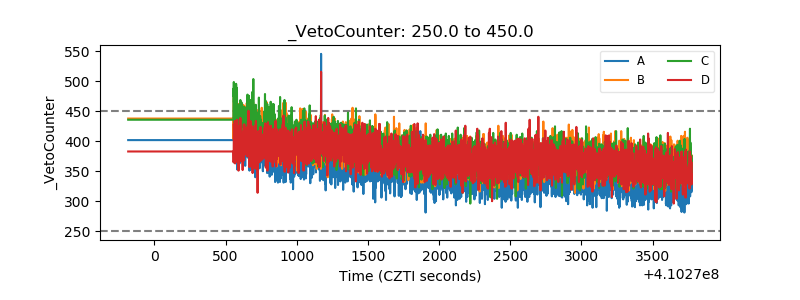 |