| Param | Original file | Final file |
|---|---|---|
| Filename | modeM0/AS1A12_025T11_9000005454_39262cztM0_level2.fits | modeM0/AS1A12_025T11_9000005454_39262cztM0_level2_quad_clean.evt |
| Size (bytes) | 221,106,240 | 31,104,000 |
| Size | 210.9 MB | 29.7 MB |
| Events in quadrant A | 1,128,195 | 240,875 |
| Events in quadrant B | 1,329,475 | 233,581 |
| Events in quadrant C | 1,156,509 | 229,240 |
| Events in quadrant D | 4,407,306 | 88,408 |
| Mode M0 | |||
|---|---|---|---|
| Quadrant | BADHDUFLAG | Total packets | Discarded packets |
| A | 0 | 4568 | 2 |
| B | 0 | 5268 | 1 |
| C | 0 | 4707 | 1 |
| D | 0 | 14511 | 1 |
| Mode SS | |||
|---|---|---|---|
| Quadrant | BADHDUFLAG | Total packets | Discarded packets |
| A | 0 | 42 | 0 |
| B | 0 | 42 | 0 |
| C | 0 | 42 | 0 |
| D | 0 | 42 | 0 |
| Mode M9 | |||
|---|---|---|---|
| Quadrant | BADHDUFLAG | Total packets | Discarded packets |
| A | 0 | 17 | 0 |
| B | 0 | 17 | 0 |
| C | 0 | 17 | 0 |
| D | 0 | 17 | 0 |
| Quadrant | Total seconds | Saturated seconds | Saturation percentage |
|---|---|---|---|
| A | 2069 | 5 | 0.241663% |
| B | 2069 | 110 | 5.316578% |
| C | 2069 | 4 | 0.193330% |
| D | 2069 | 1338 | 64.668922% |
Noise dominated data is calculated using 1-second bins in cleaned event files. If a bin has >2000 counts, and if more than 50% of those come from <1% of pixels, then it is considered to be noise-dominated and hence unusable.
| Quadrant | # 1 sec bins | Bins with >0 counts | Bins with >2000 counts | High rate bins dominated by noise | Noise dominated (total time) | Noise dominated (detector-on time) | Marked lightcurve |
|---|---|---|---|---|---|---|---|
| A | 3680 | 2070 | 2 | 2 | 0.05% | 0.10% | 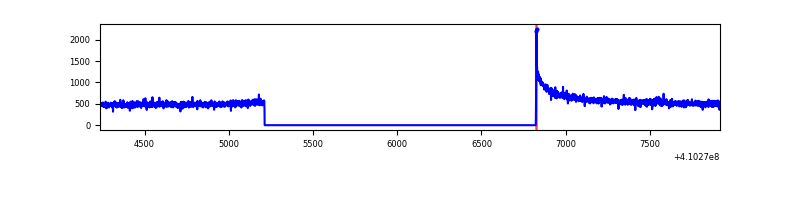 |
| B | 3680 | 2069 | 75 | 75 | 2.04% | 3.62% | 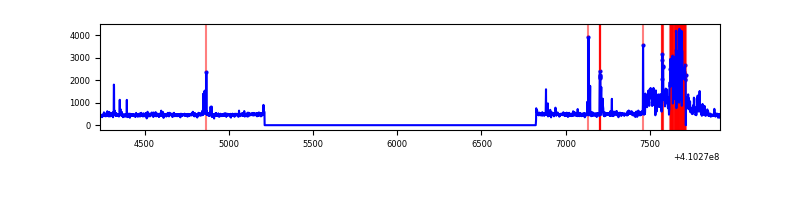 |
| C | 3680 | 2070 | 0 | 0 | 0.00% | 0.00% | 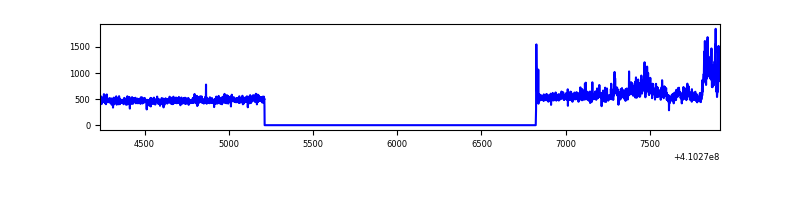 |
| D | 3680 | 2070 | 1212 | 1212 | 32.93% | 58.55% | 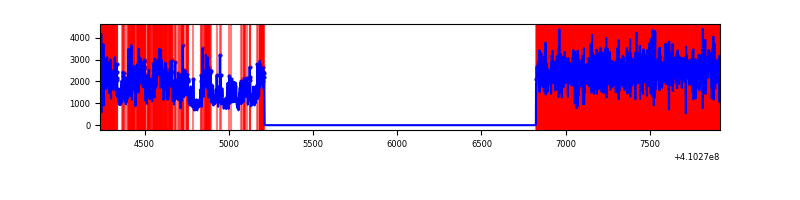 |
Top three noisy pixels from each quadrant. If the there are fewer than three noisy pixels in the level2.evt file, extra rows are filled as -1
| Pixel properties | Quadrant properties | ||||||
|---|---|---|---|---|---|---|---|
| Quadrant | DetID | PixID | Counts | Sigma | Mean | Median | Sigma |
| A | 10 | 83 | 191340 | 3752.78 | 242 | 237 | 50.9 |
| A | 13 | 254 | 2835 | 51.02 | 242 | 237 | 50.9 |
| A | 3 | 137 | 2599 | 46.38 | 242 | 237 | 50.9 |
| B | 5 | 172 | 357442 | 7658.45 | 232 | 226 | 46.6 |
| B | 0 | 190 | 17514 | 370.64 | 232 | 226 | 46.6 |
| B | 15 | 85 | 16211 | 342.71 | 232 | 226 | 46.6 |
| C | 3 | 233 | 146855 | 2595.89 | 233 | 234 | 56.5 |
| C | 15 | 214 | 94631 | 1671.27 | 233 | 234 | 56.5 |
| C | 0 | 10 | 3752 | 62.29 | 233 | 234 | 56.5 |
| D | 12 | 235 | 3272425 | 79802.06 | 161 | 156 | 41.0 |
| D | 12 | 227 | 365118 | 8900.47 | 161 | 156 | 41.0 |
| D | 2 | 120 | 50004 | 1215.66 | 161 | 156 | 41.0 |
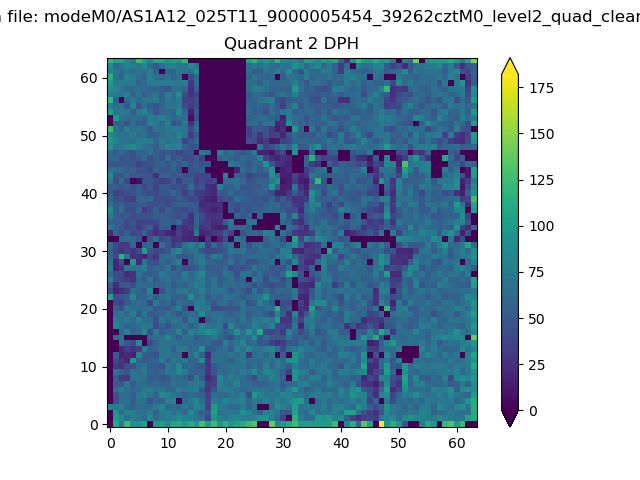
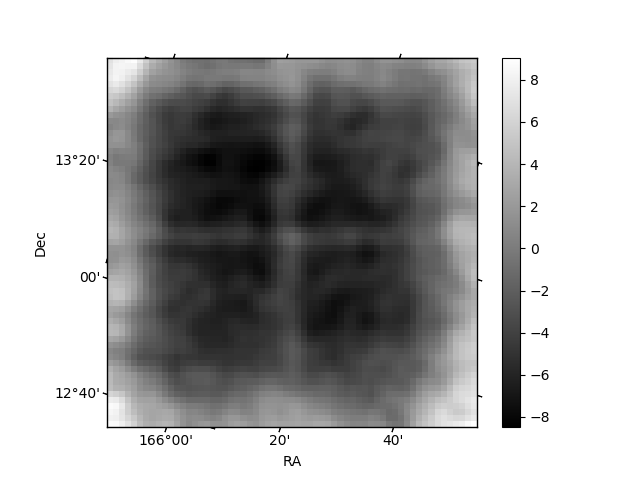
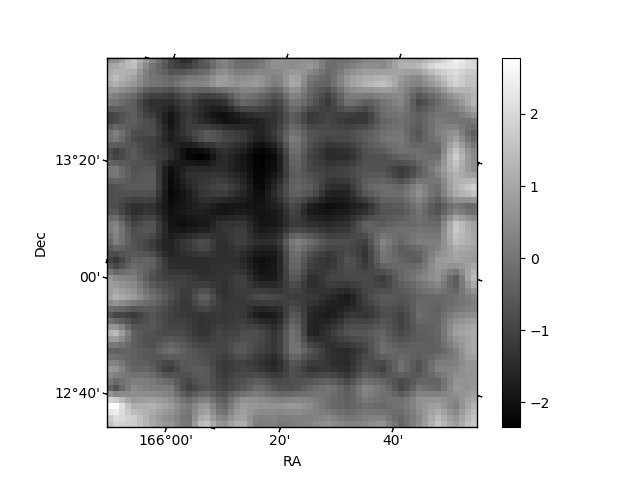
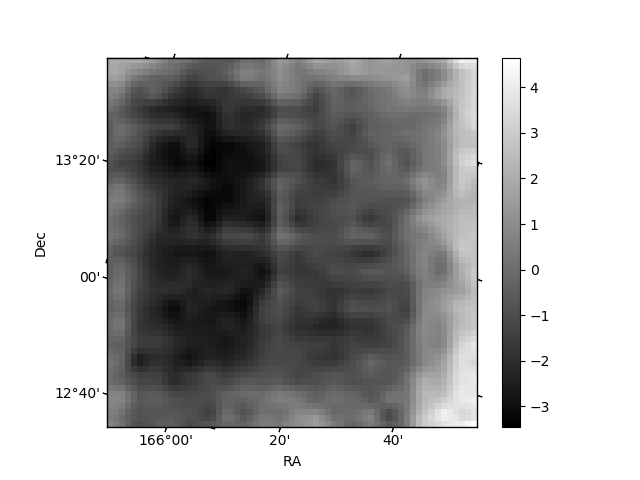
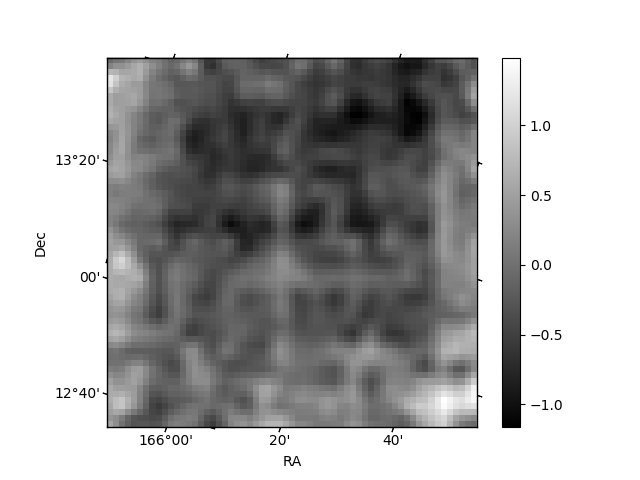
Histogram calculated using DETX and DETY for each event in the final _common_clean file
| Quadrant A | 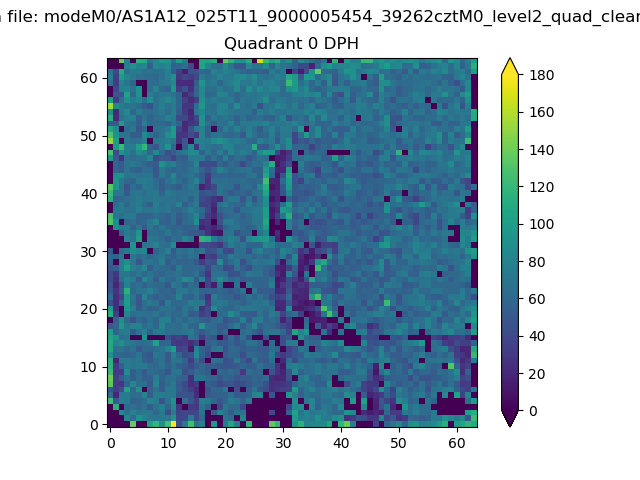 |
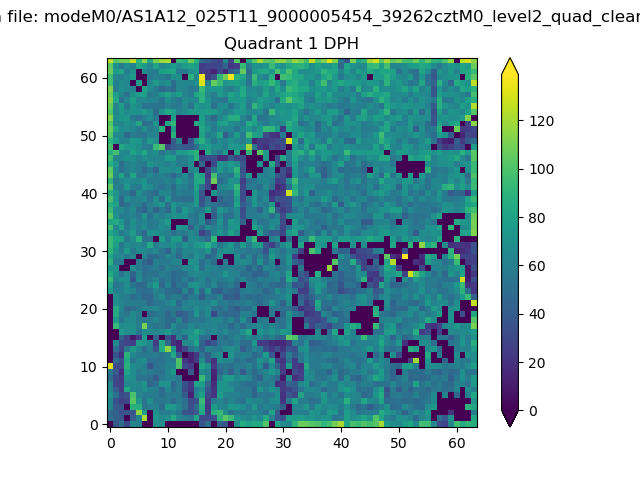 |
Quadrant B |
|---|---|---|---|
| Quadrant D | 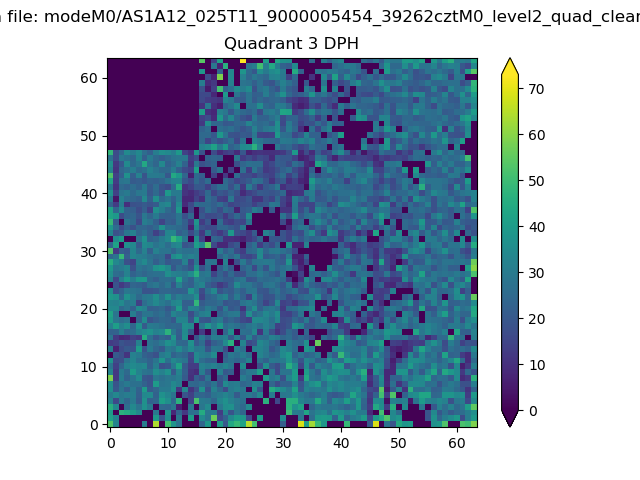 |
 |
Quadrant C |
| Plot type | Count rate plots | Images |
|---|---|---|
| Comparison with Poisson distribution Blue bars denote a histogram of data divided into 1 sec bins. Red curve is a Poisson curve with rate = median count rate of data. |
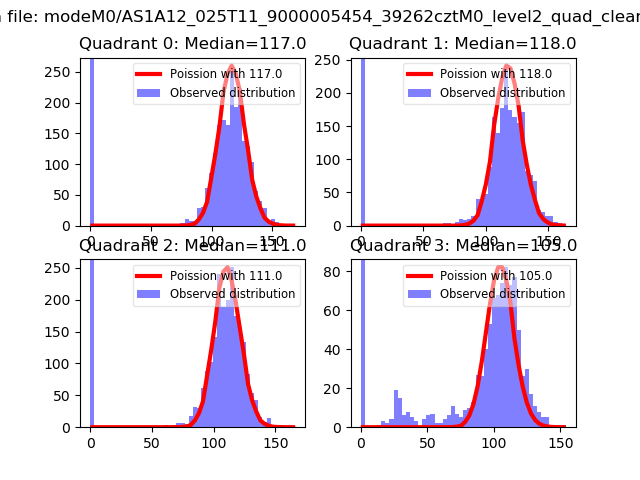 |
 |
| Quadrant-wise count rates Data is divided into 100 sec bins |
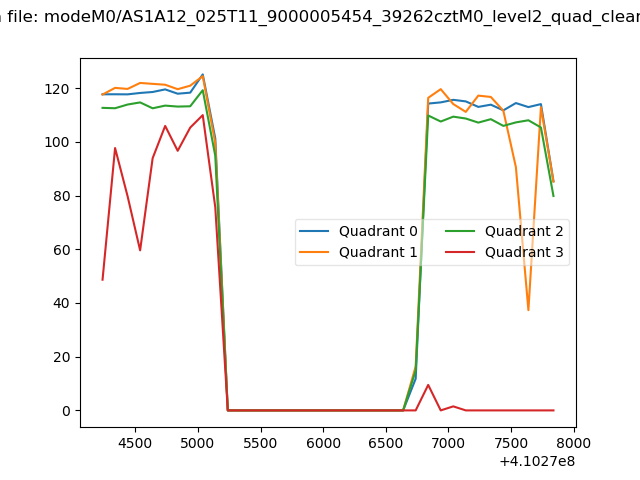 |
|
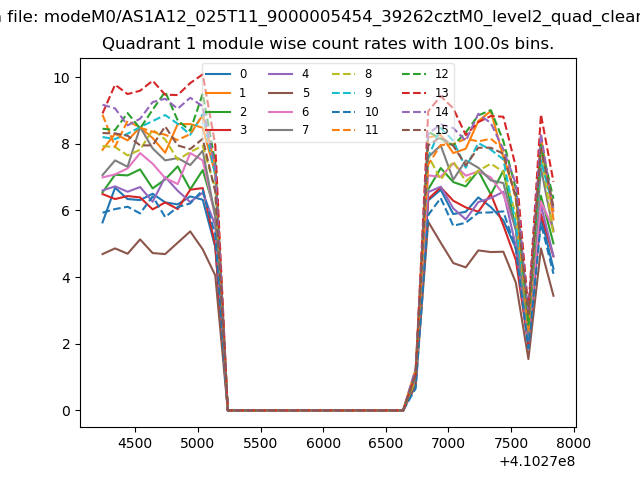
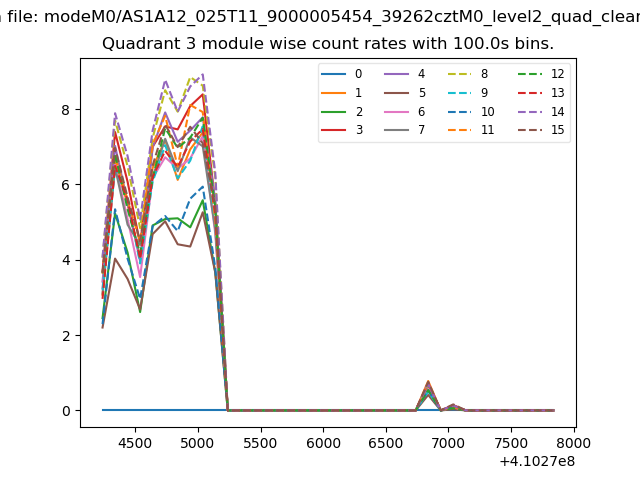
| Module-wise count rates for Quadrant A Data is divided into 100 sec bins |
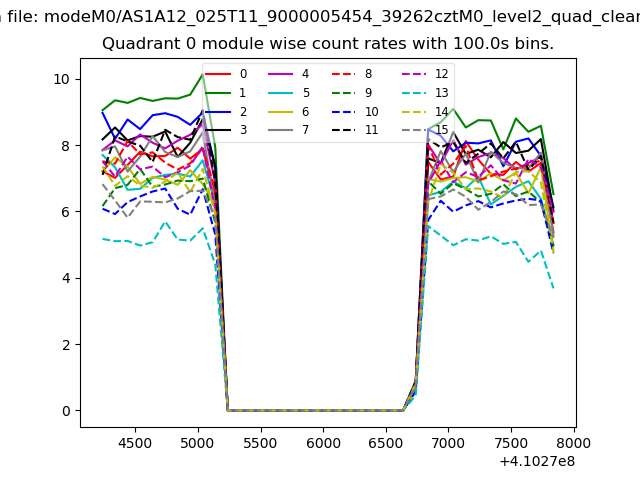 |
 |
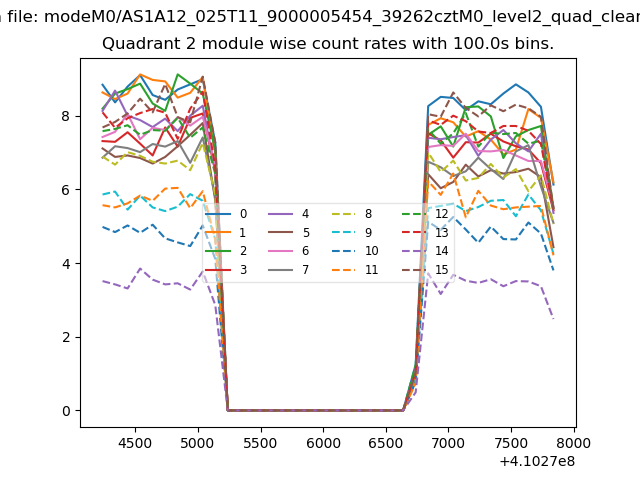
| Module-wise count rates for Quadrant B Data is divided into 100 sec bins |
 |
 |
| Module-wise count rates for Quadrant C Data is divided into 100 sec bins |
 |
 |
| Module-wise count rates for Quadrant D Data is divided into 100 sec bins |
 |
 |
| Parameter | Plot |
|---|---|
| CZT HV Monitor | 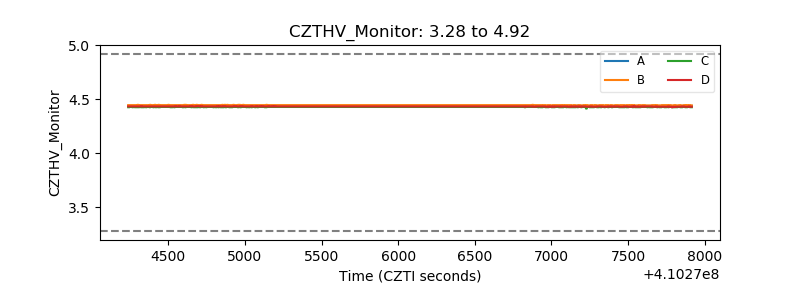 |
| D_VDD | 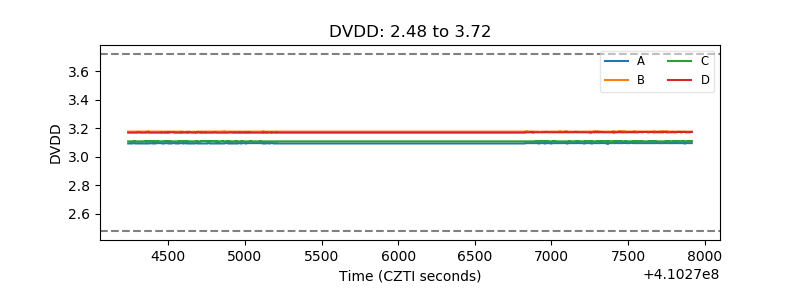 |
| Temperature 1 | 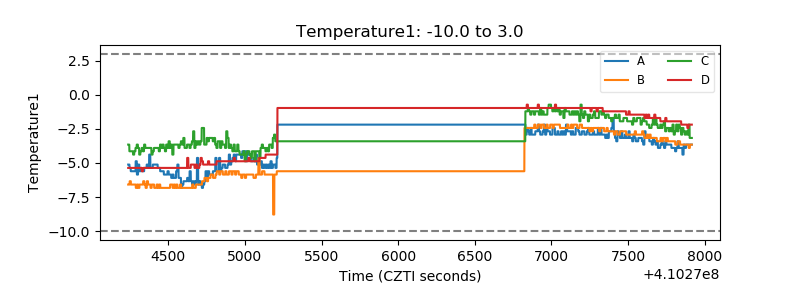 |
| Veto HV Monitor | 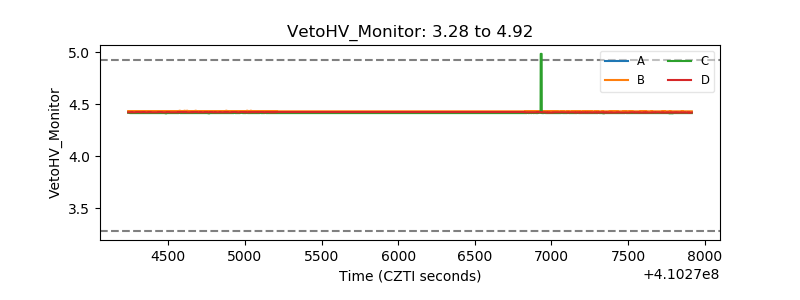 |
| Veto LLD | 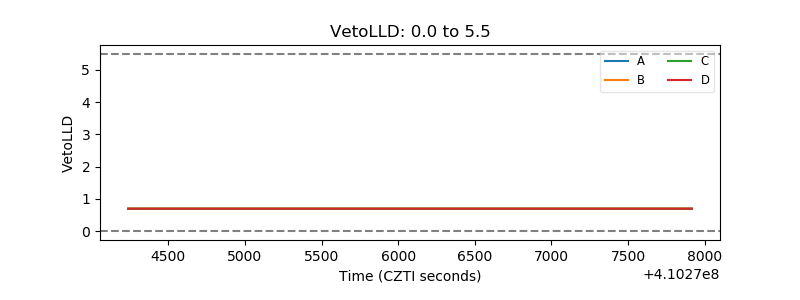 |
| Alpha Counter | 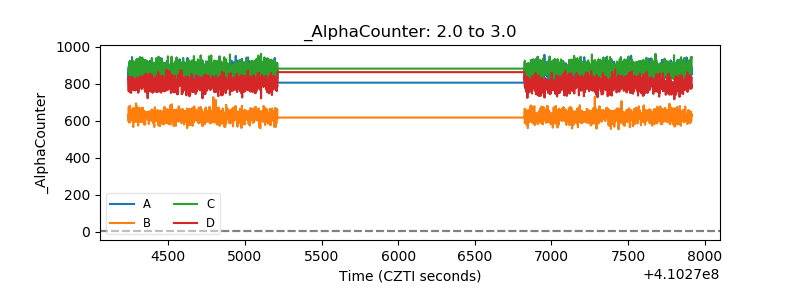 |
| _CPM_Rate | 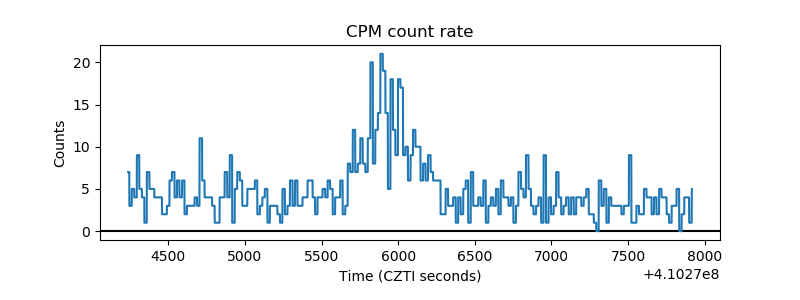 |
| CZT Counter | 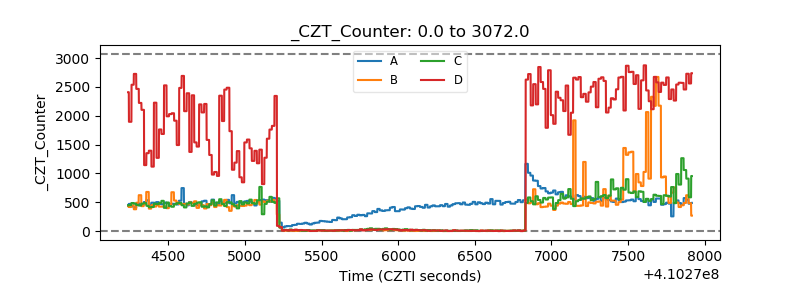 |
| +2.5 Volts monitor | 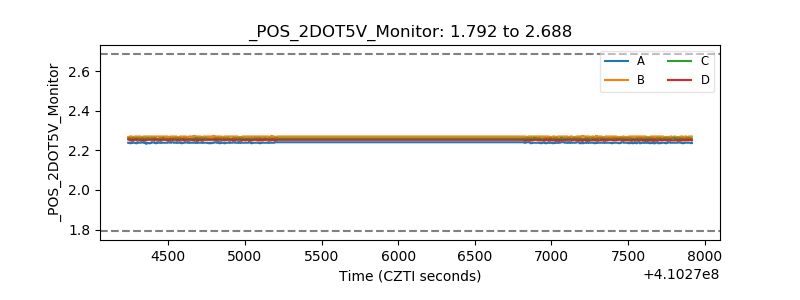 |
| +5 Volts monitor | 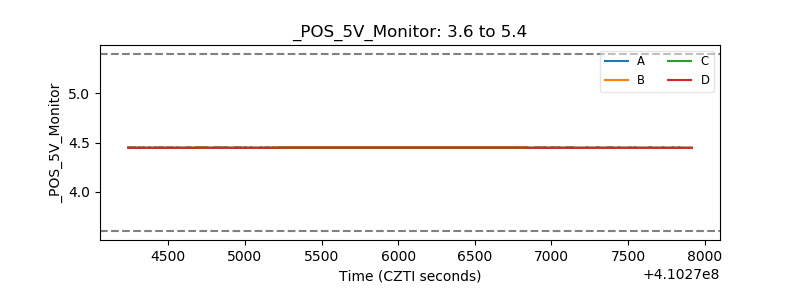 |
| _ROLL_ROT | 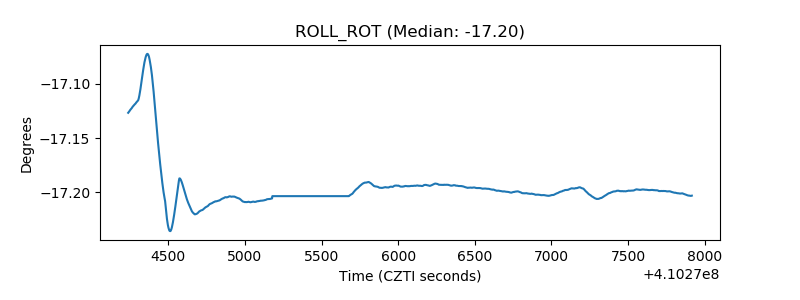 |
| _Roll_DEC | 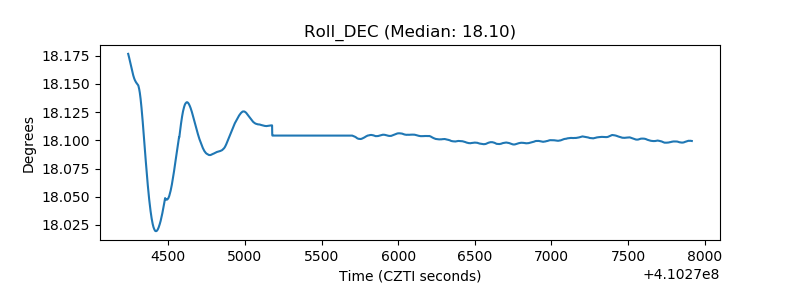 |
| _Roll_RA | 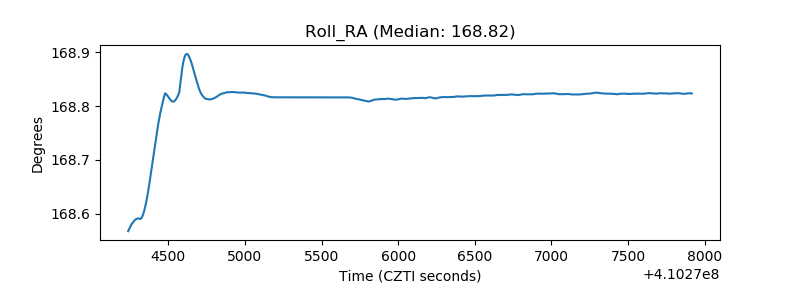 |
| Veto Counter | 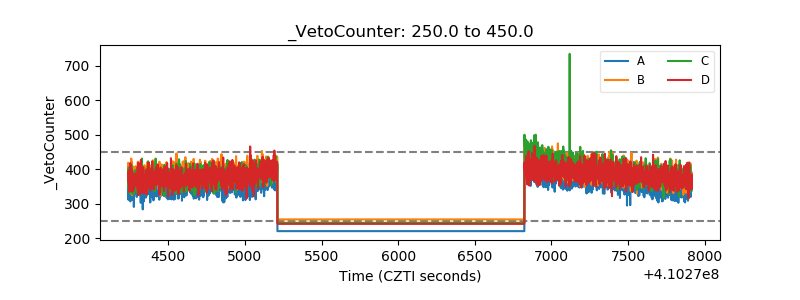 |