| Param | Original file | Final file |
|---|---|---|
| Filename | modeM0/AS1A12_025T11_9000005454_39263cztM0_level2.fits | modeM0/AS1A12_025T11_9000005454_39263cztM0_level2_quad_clean.evt |
| Size (bytes) | 657,829,440 | 83,134,080 |
| Size | 627.4 MB | 79.3 MB |
| Events in quadrant A | 3,061,337 | 668,387 |
| Events in quadrant B | 3,792,862 | 647,844 |
| Events in quadrant C | 3,051,407 | 645,967 |
| Events in quadrant D | 13,984,540 | 140,761 |
| Mode M0 | |||
|---|---|---|---|
| Quadrant | BADHDUFLAG | Total packets | Discarded packets |
| A | 0 | 12724 | 3 |
| B | 0 | 15182 | 2 |
| C | 0 | 12769 | 2 |
| D | 0 | 45576 | 2 |
| Mode SS | |||
|---|---|---|---|
| Quadrant | BADHDUFLAG | Total packets | Discarded packets |
| A | 0 | 122 | 0 |
| B | 0 | 122 | 0 |
| C | 0 | 122 | 0 |
| D | 0 | 122 | 0 |
| Mode M9 | |||
|---|---|---|---|
| Quadrant | BADHDUFLAG | Total packets | Discarded packets |
| A | 0 | 24 | 0 |
| B | 0 | 24 | 0 |
| C | 0 | 24 | 0 |
| D | 0 | 25 | 0 |
| Quadrant | Total seconds | Saturated seconds | Saturation percentage |
|---|---|---|---|
| A | 5923 | 11 | 0.185717% |
| B | 5923 | 284 | 4.794867% |
| C | 5923 | 8 | 0.135067% |
| D | 5923 | 4817 | 81.327030% |
Noise dominated data is calculated using 1-second bins in cleaned event files. If a bin has >2000 counts, and if more than 50% of those come from <1% of pixels, then it is considered to be noise-dominated and hence unusable.
| Quadrant | # 1 sec bins | Bins with >0 counts | Bins with >2000 counts | High rate bins dominated by noise | Noise dominated (total time) | Noise dominated (detector-on time) | Marked lightcurve |
|---|---|---|---|---|---|---|---|
| A | 7295 | 5924 | 4 | 4 | 0.05% | 0.07% | 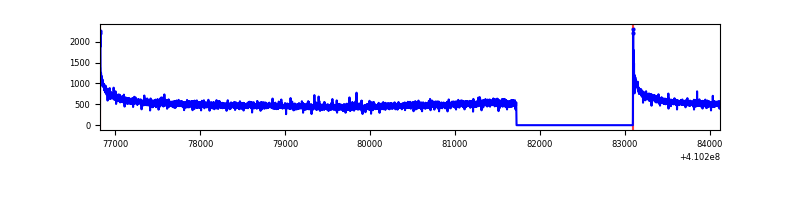 |
| B | 7295 | 5923 | 188 | 188 | 2.58% | 3.17% | 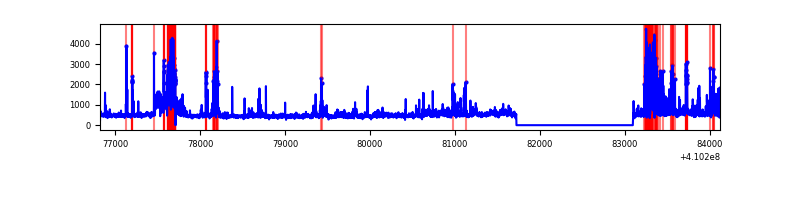 |
| C | 7295 | 5924 | 0 | 0 | 0.00% | 0.00% | 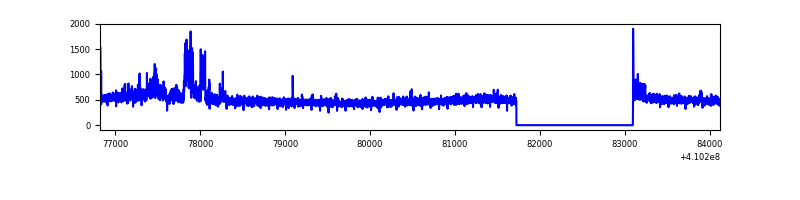 |
| D | 7294 | 5923 | 4286 | 4286 | 58.76% | 72.36% | 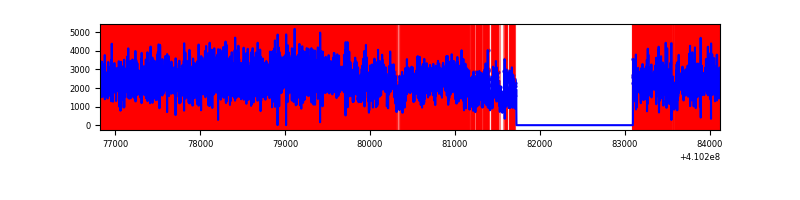 |
Top three noisy pixels from each quadrant. If the there are fewer than three noisy pixels in the level2.evt file, extra rows are filled as -1
| Pixel properties | Quadrant properties | ||||||
|---|---|---|---|---|---|---|---|
| Quadrant | DetID | PixID | Counts | Sigma | Mean | Median | Sigma |
| A | 10 | 83 | 470648 | 3432.12 | 670 | 656 | 136.9 |
| A | 13 | 254 | 8058 | 54.05 | 670 | 656 | 136.9 |
| A | 3 | 137 | 7397 | 49.23 | 670 | 656 | 136.9 |
| B | 5 | 172 | 795492 | 6273.45 | 647 | 628 | 126.7 |
| B | 0 | 189 | 201270 | 1583.56 | 647 | 628 | 126.7 |
| B | 0 | 190 | 146735 | 1153.15 | 647 | 628 | 126.7 |
| C | 15 | 214 | 265546 | 1719.36 | 652 | 654 | 154.1 |
| C | 3 | 233 | 228929 | 1481.69 | 652 | 654 | 154.1 |
| C | 0 | 10 | 9443 | 57.05 | 652 | 654 | 154.1 |
| D | 12 | 235 | 11160607 | 106113.39 | 416 | 402 | 105.2 |
| D | 12 | 227 | 420432 | 3993.73 | 416 | 402 | 105.2 |
| D | 12 | 217 | 420106 | 3990.63 | 416 | 402 | 105.2 |
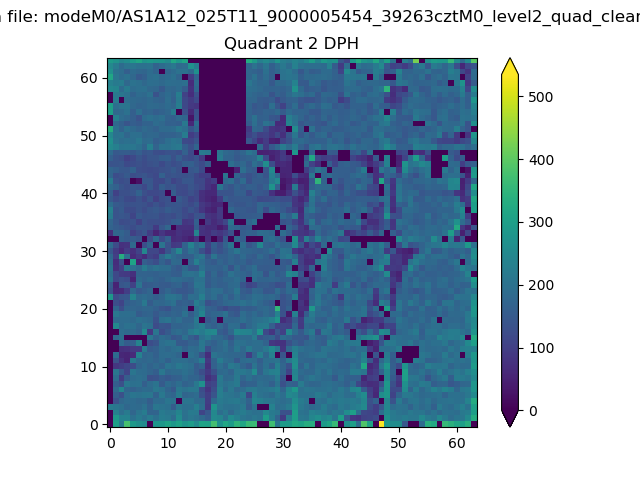
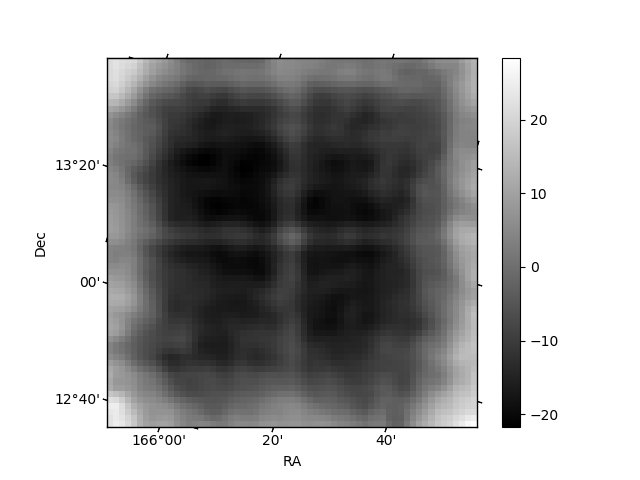
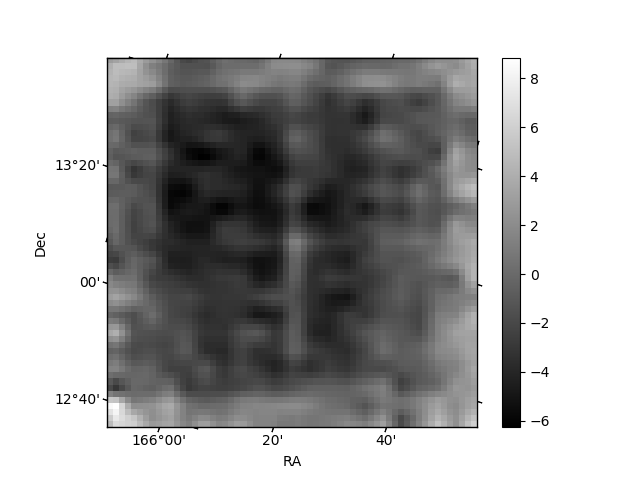
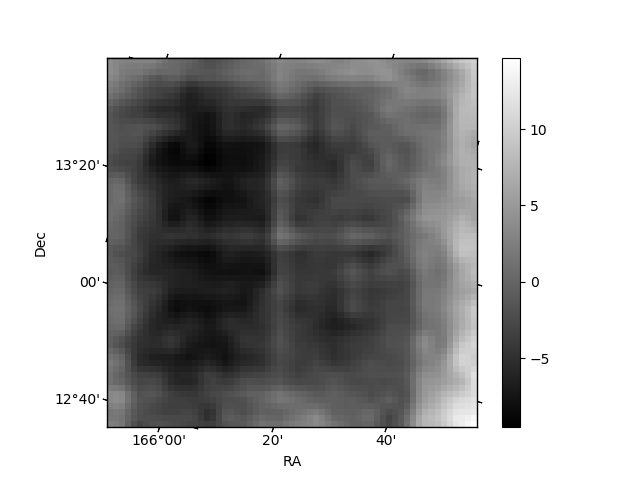
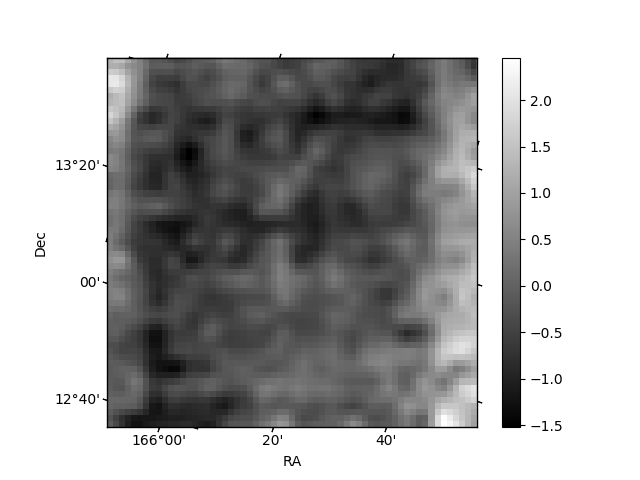
Histogram calculated using DETX and DETY for each event in the final _common_clean file
| Quadrant A | 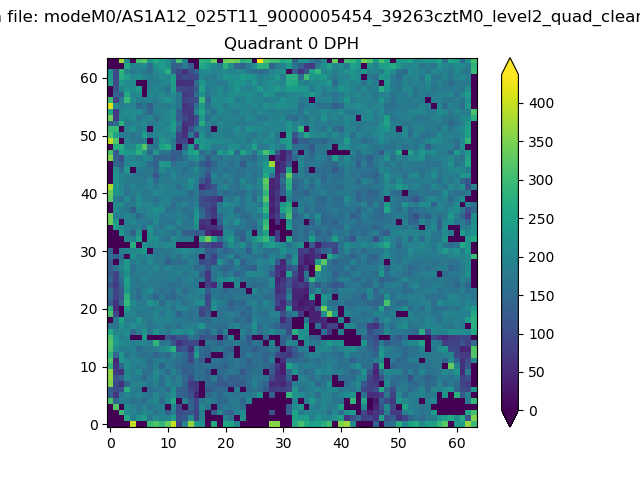 |
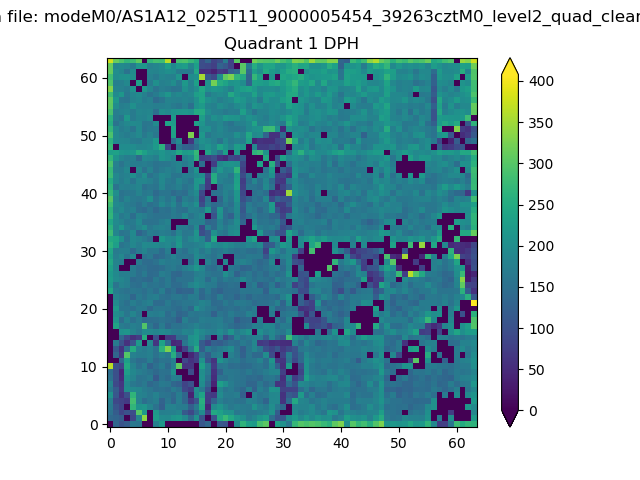 |
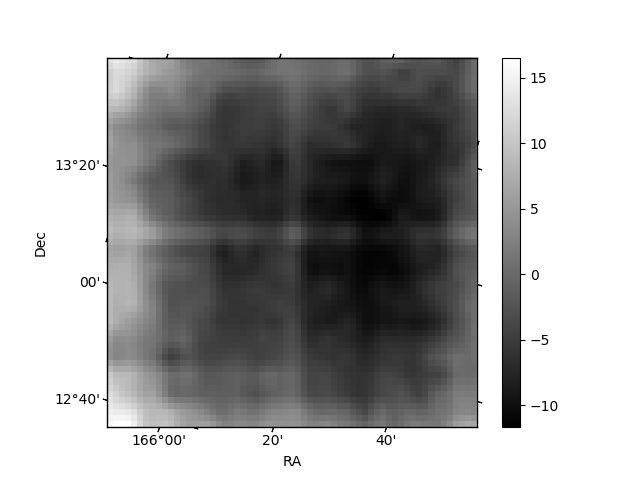
Quadrant B |
|---|---|---|---|
| Quadrant D | 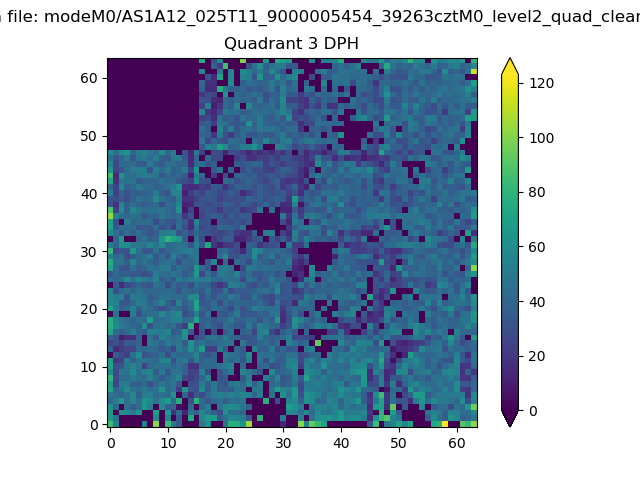 |
 |
Quadrant C |
| Plot type | Count rate plots | Images |
|---|---|---|
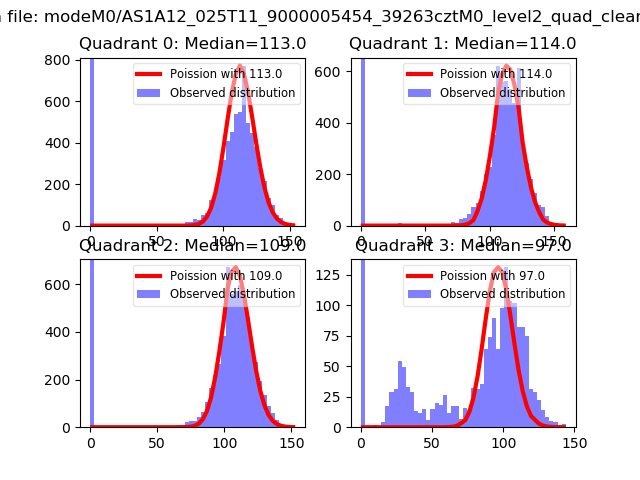
| Comparison with Poisson distribution Blue bars denote a histogram of data divided into 1 sec bins. Red curve is a Poisson curve with rate = median count rate of data. |
 |
 |
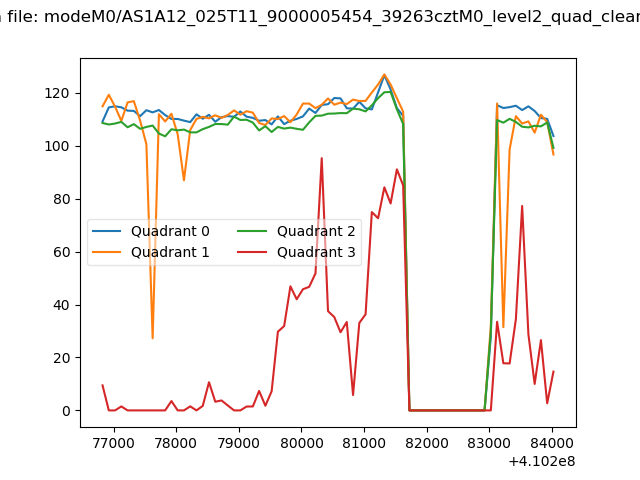
| Quadrant-wise count rates Data is divided into 100 sec bins |
 |
|
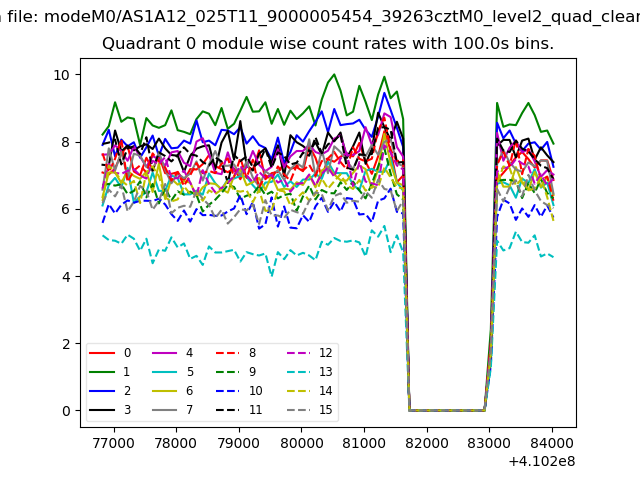
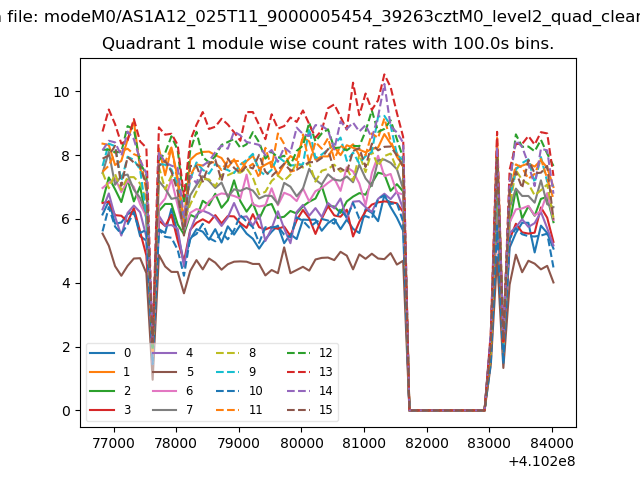
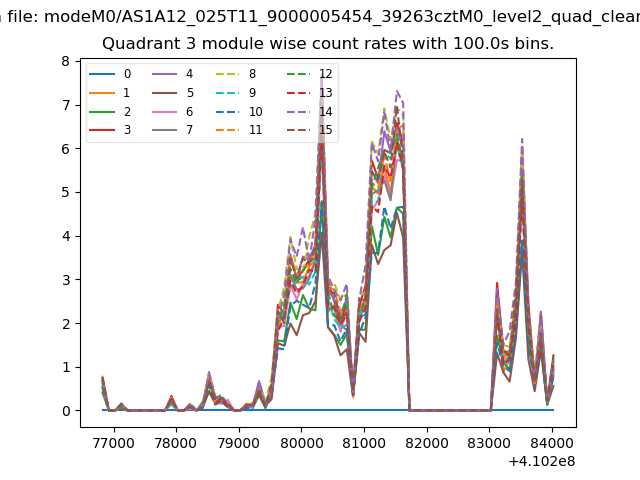
| Module-wise count rates for Quadrant A Data is divided into 100 sec bins |
 |
 |
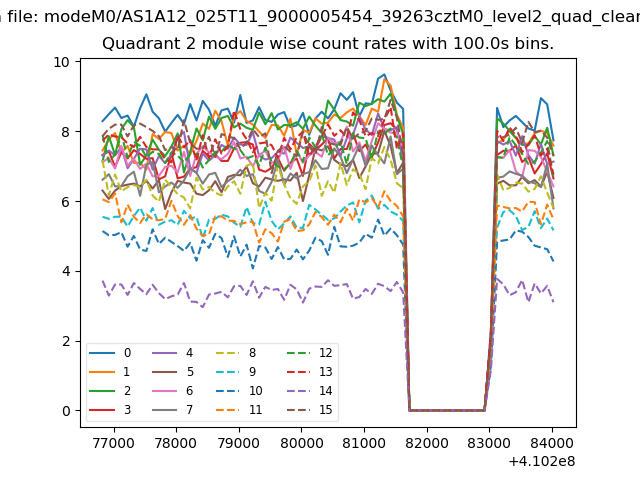
| Module-wise count rates for Quadrant B Data is divided into 100 sec bins |
 |
 |
| Module-wise count rates for Quadrant C Data is divided into 100 sec bins |
 |
 |
| Module-wise count rates for Quadrant D Data is divided into 100 sec bins |
 |
 |
| Parameter | Plot |
|---|---|
| CZT HV Monitor | 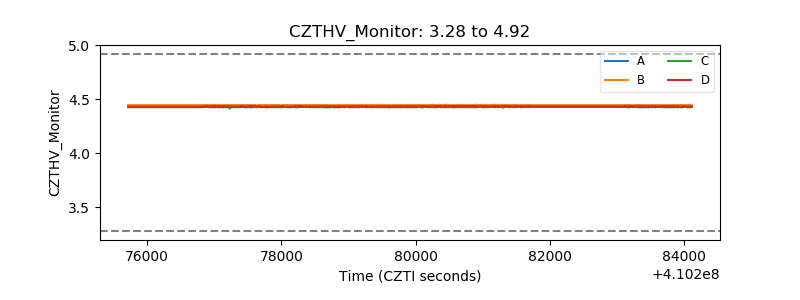 |
| D_VDD | 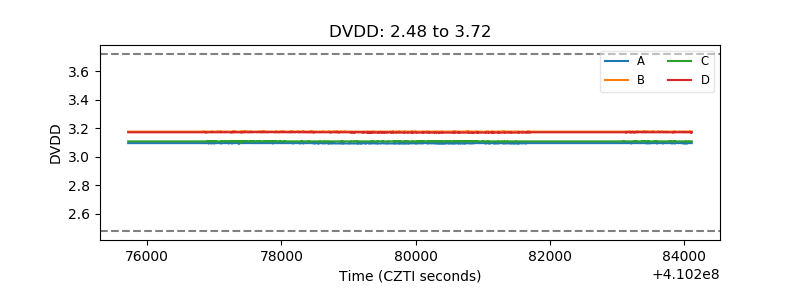 |
| Temperature 1 | 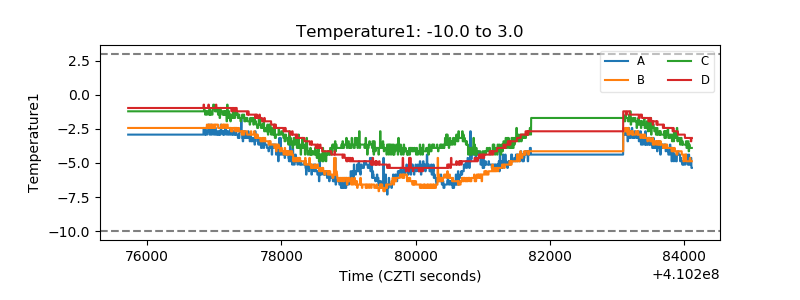 |
| Veto HV Monitor | 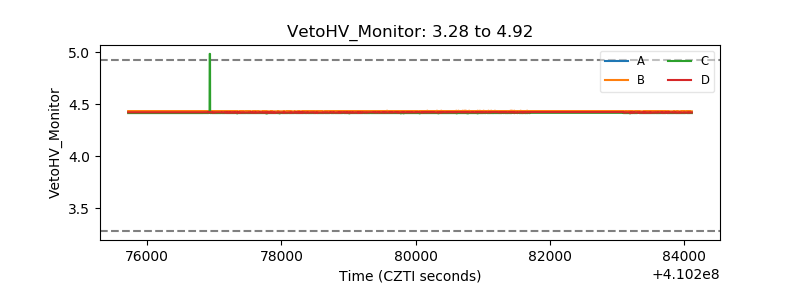 |
| Veto LLD | 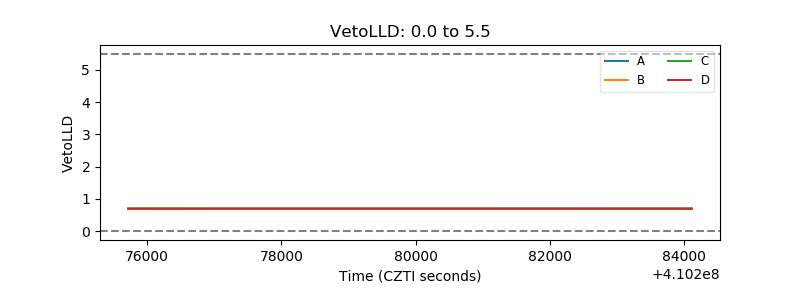 |
| Alpha Counter | 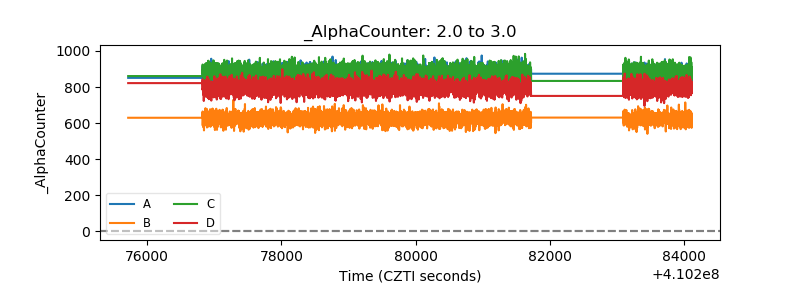 |
| _CPM_Rate | 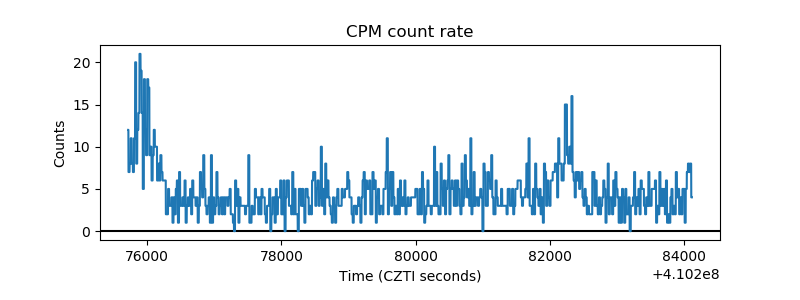 |
| CZT Counter | 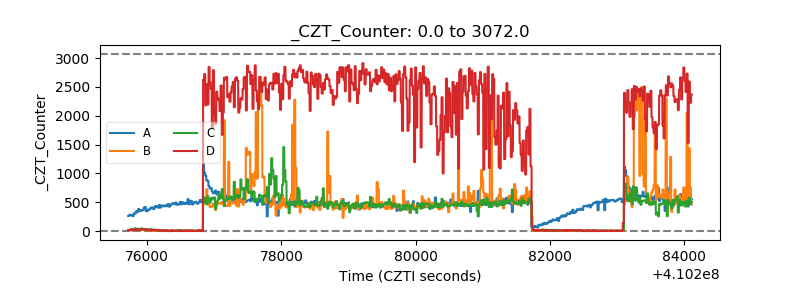 |
| +2.5 Volts monitor | 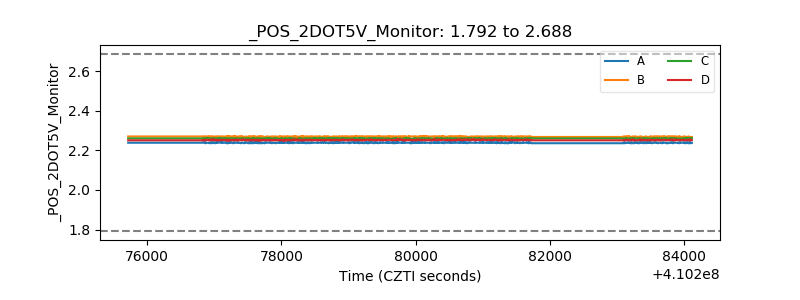 |
| +5 Volts monitor | 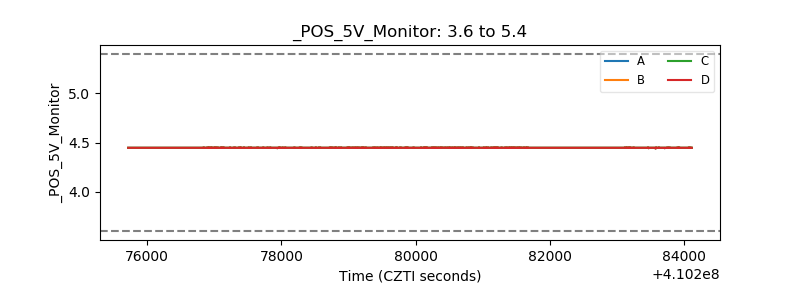 |
| _ROLL_ROT | 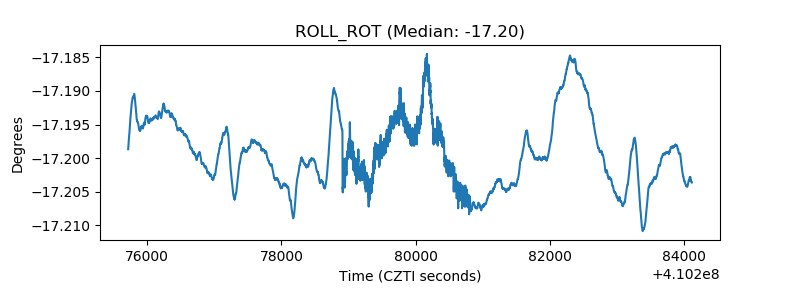 |
| _Roll_DEC | 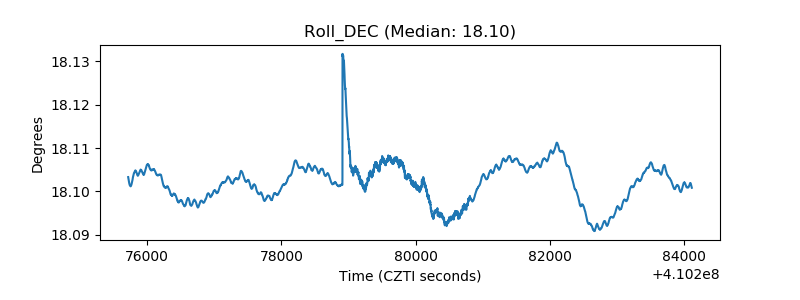 |
| _Roll_RA | 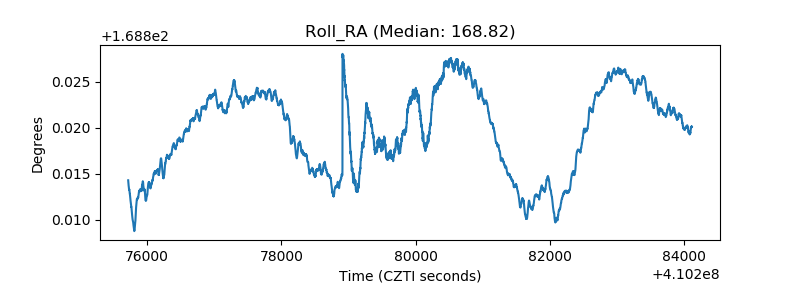 |
| Veto Counter | 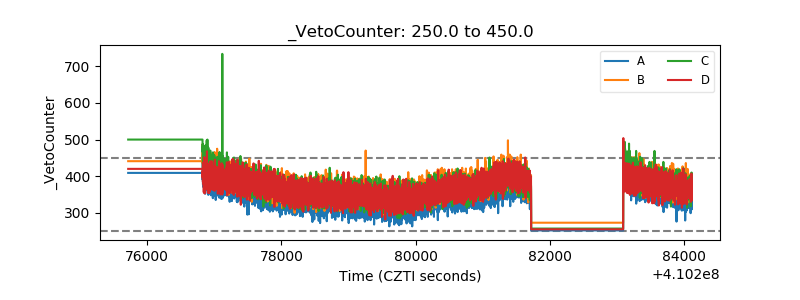 |