| Param | Original file | Final file |
|---|---|---|
| Filename | modeM0/AS1A12_025T11_9000005454_39264cztM0_level2.fits | modeM0/AS1A12_025T11_9000005454_39264cztM0_level2_quad_clean.evt |
| Size (bytes) | 576,622,080 | 90,213,120 |
| Size | 549.9 MB | 86.0 MB |
| Events in quadrant A | 3,032,772 | 659,894 |
| Events in quadrant B | 4,464,774 | 627,967 |
| Events in quadrant C | 2,858,611 | 642,814 |
| Events in quadrant D | 10,531,458 | 389,026 |
| Mode M0 | |||
|---|---|---|---|
| Quadrant | BADHDUFLAG | Total packets | Discarded packets |
| A | 0 | 12671 | 3 |
| B | 0 | 17108 | 2 |
| C | 0 | 12074 | 2 |
| D | 0 | 35368 | 2 |
| Mode SS | |||
|---|---|---|---|
| Quadrant | BADHDUFLAG | Total packets | Discarded packets |
| A | 0 | 120 | 0 |
| B | 0 | 120 | 0 |
| C | 0 | 120 | 0 |
| D | 0 | 120 | 0 |
| Mode M9 | |||
|---|---|---|---|
| Quadrant | BADHDUFLAG | Total packets | Discarded packets |
| A | 0 | 24 | 0 |
| B | 0 | 24 | 0 |
| C | 0 | 24 | 0 |
| D | 0 | 25 | 0 |
| Quadrant | Total seconds | Saturated seconds | Saturation percentage |
|---|---|---|---|
| A | 5890 | 13 | 0.220713% |
| B | 5890 | 463 | 7.860781% |
| C | 5890 | 8 | 0.135823% |
| D | 5890 | 2460 | 41.765705% |
Noise dominated data is calculated using 1-second bins in cleaned event files. If a bin has >2000 counts, and if more than 50% of those come from <1% of pixels, then it is considered to be noise-dominated and hence unusable.
| Quadrant | # 1 sec bins | Bins with >0 counts | Bins with >2000 counts | High rate bins dominated by noise | Noise dominated (total time) | Noise dominated (detector-on time) | Marked lightcurve |
|---|---|---|---|---|---|---|---|
| A | 7172 | 5891 | 4 | 4 | 0.06% | 0.07% | 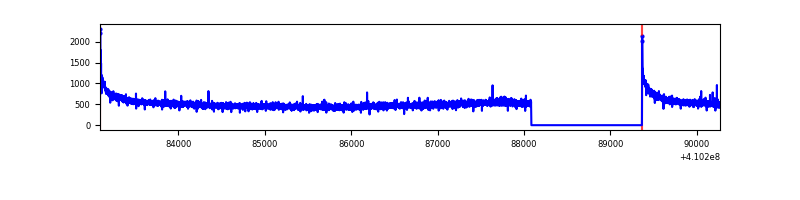 |
| B | 7172 | 5890 | 324 | 324 | 4.52% | 5.50% | 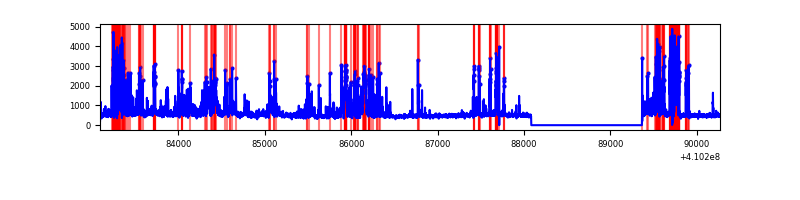 |
| C | 7172 | 5891 | 6 | 6 | 0.08% | 0.10% | 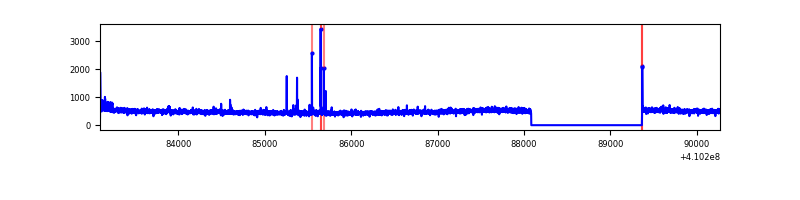 |
| D | 7172 | 5891 | 2324 | 2324 | 32.40% | 39.45% | 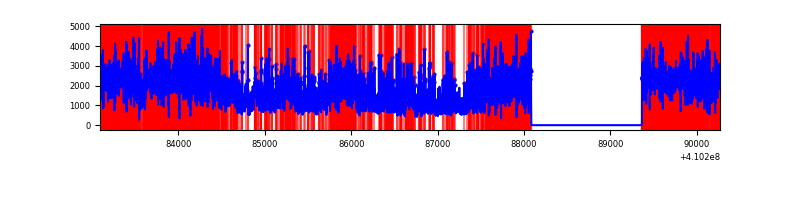 |
Top three noisy pixels from each quadrant. If the there are fewer than three noisy pixels in the level2.evt file, extra rows are filled as -1
| Pixel properties | Quadrant properties | ||||||
|---|---|---|---|---|---|---|---|
| Quadrant | DetID | PixID | Counts | Sigma | Mean | Median | Sigma |
| A | 10 | 83 | 458589 | 3372.92 | 664 | 650 | 135.8 |
| A | 13 | 254 | 8088 | 54.78 | 664 | 650 | 135.8 |
| A | 3 | 137 | 7547 | 50.8 | 664 | 650 | 135.8 |
| B | 5 | 172 | 1256066 | 9982.71 | 635 | 617 | 125.8 |
| B | 5 | 255 | 280667 | 2226.82 | 635 | 617 | 125.8 |
| B | 0 | 189 | 214650 | 1701.88 | 635 | 617 | 125.8 |
| C | 15 | 214 | 264761 | 1741.98 | 647 | 650 | 151.6 |
| C | 3 | 233 | 27406 | 176.47 | 647 | 650 | 151.6 |
| C | 12 | 249 | 27209 | 175.17 | 647 | 650 | 151.6 |
| D | 12 | 235 | 7054857 | 51439.44 | 551 | 533 | 137.1 |
| D | 12 | 217 | 518754 | 3778.81 | 551 | 533 | 137.1 |
| D | 2 | 249 | 365767 | 2663.25 | 551 | 533 | 137.1 |
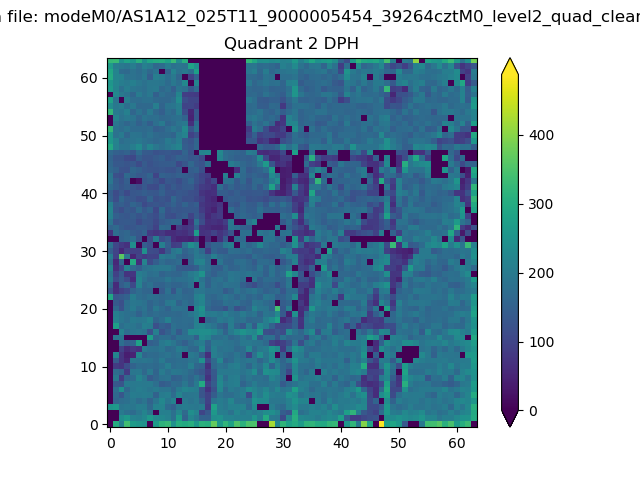
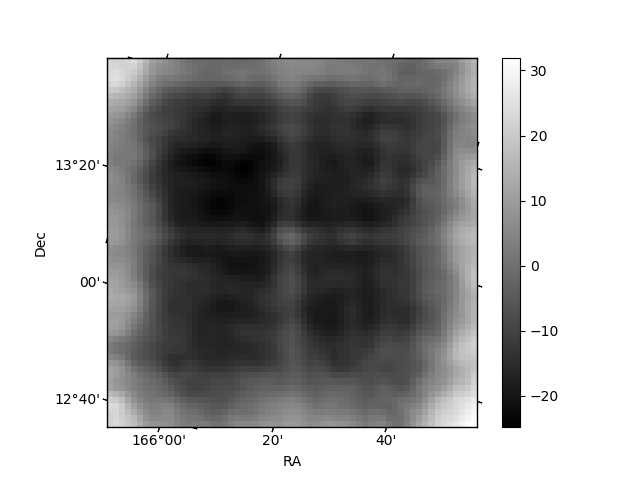
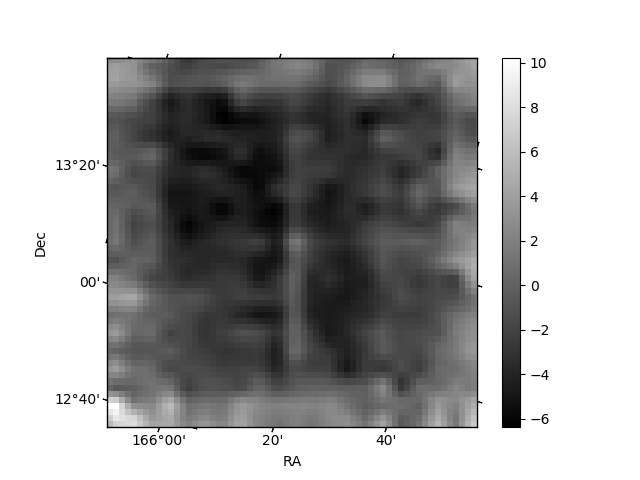
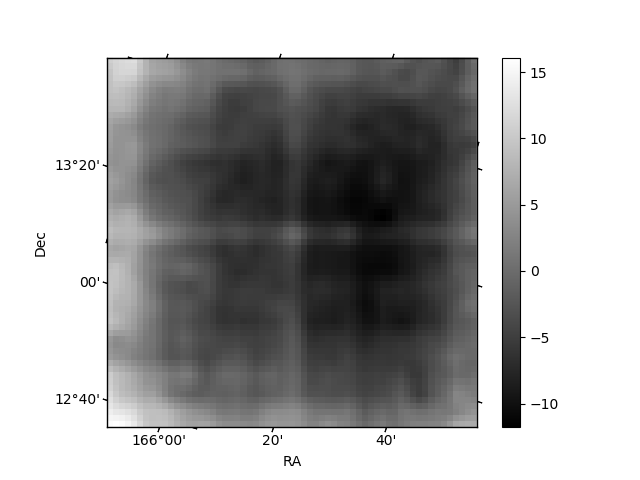
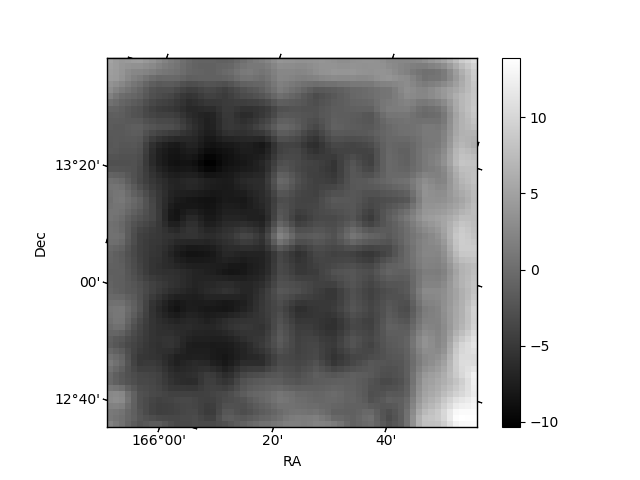
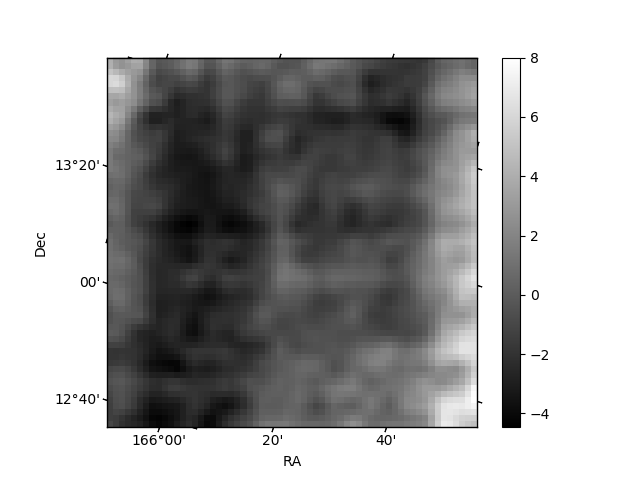
Histogram calculated using DETX and DETY for each event in the final _common_clean file
| Quadrant A | 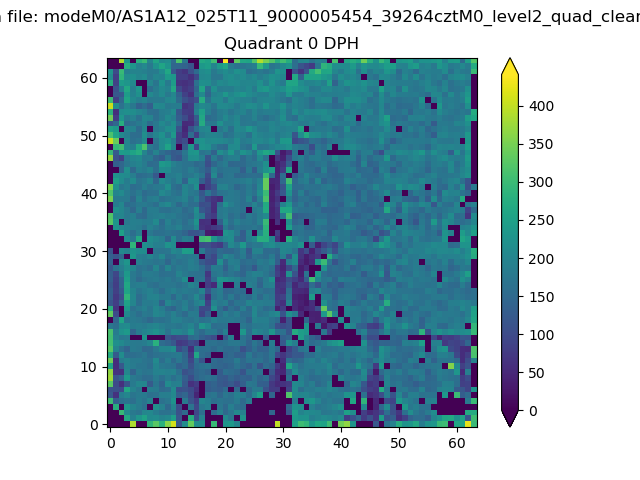 |
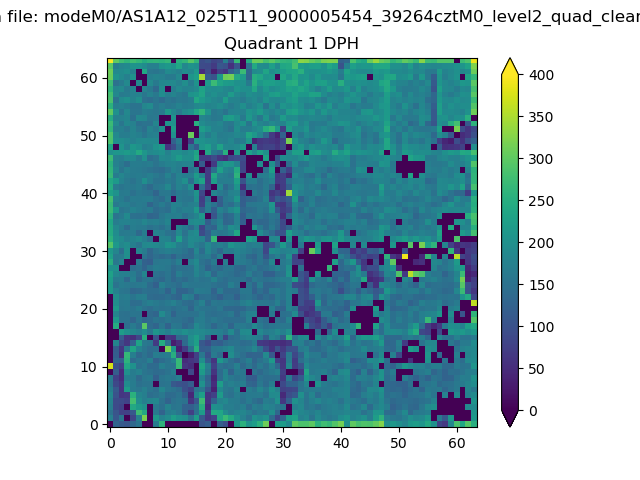 |
Quadrant B |
|---|---|---|---|
| Quadrant D | 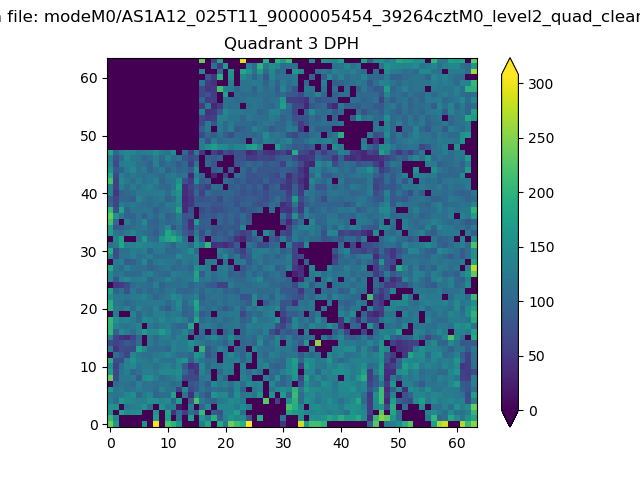 |
 |
Quadrant C |
| Plot type | Count rate plots | Images |
|---|---|---|
| Comparison with Poisson distribution Blue bars denote a histogram of data divided into 1 sec bins. Red curve is a Poisson curve with rate = median count rate of data. |
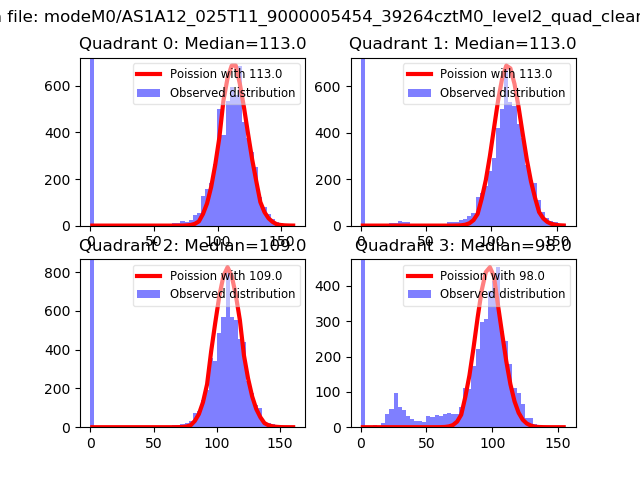 |
 |
| Quadrant-wise count rates Data is divided into 100 sec bins |
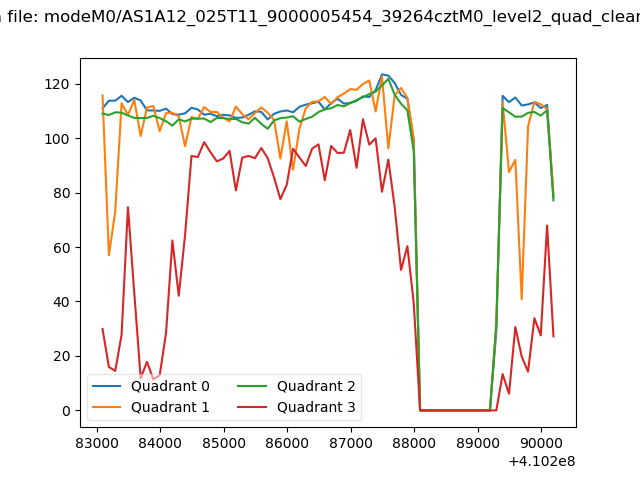 |
|
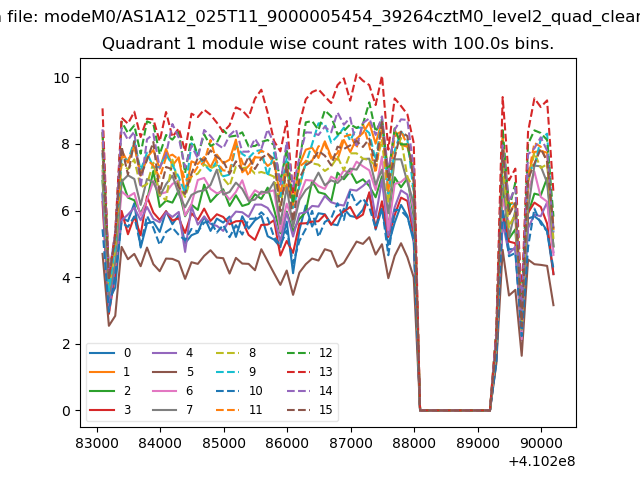
| Module-wise count rates for Quadrant A Data is divided into 100 sec bins |
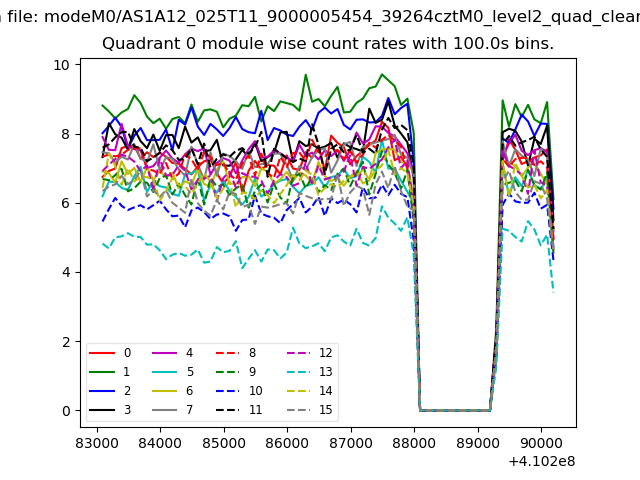 |
 |
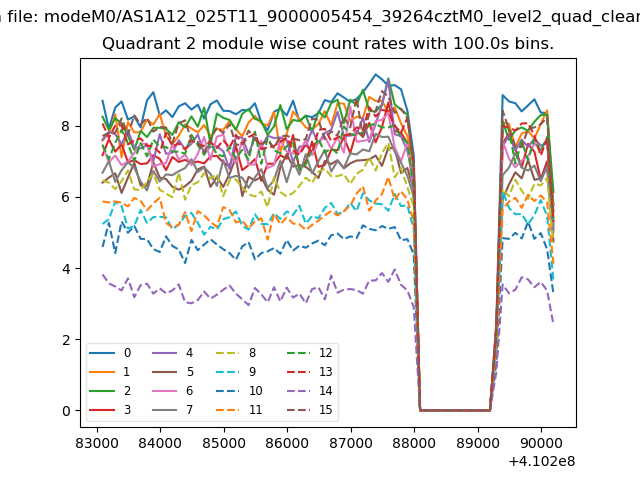
| Module-wise count rates for Quadrant B Data is divided into 100 sec bins |
 |
 |
| Module-wise count rates for Quadrant C Data is divided into 100 sec bins |
 |
 |
| Module-wise count rates for Quadrant D Data is divided into 100 sec bins |
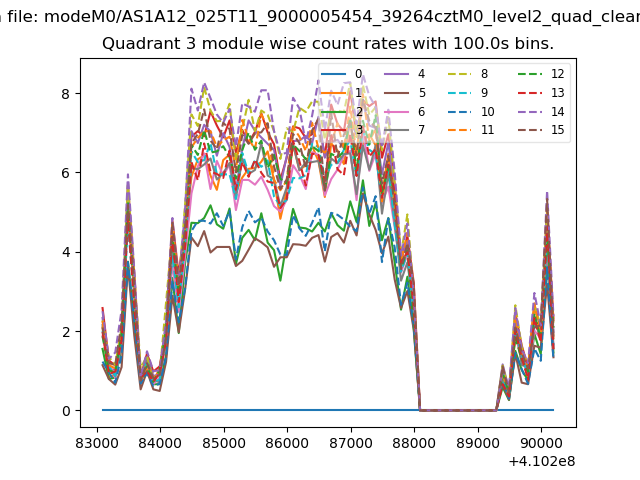 |
 |
| Parameter | Plot |
|---|---|
| CZT HV Monitor | 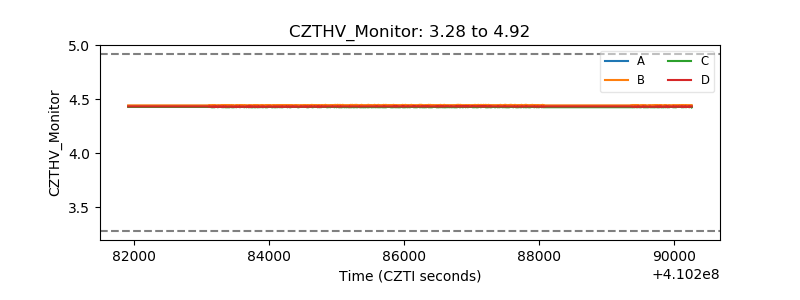 |
| D_VDD | 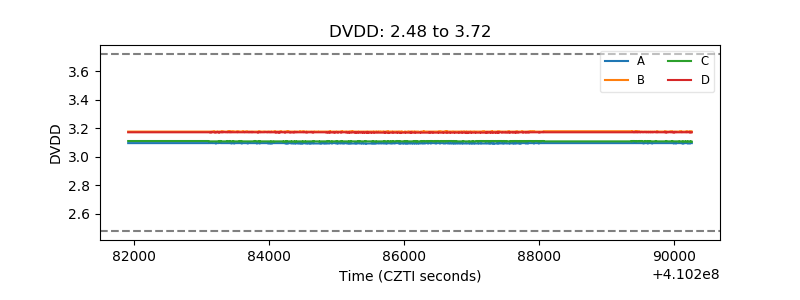 |
| Temperature 1 | 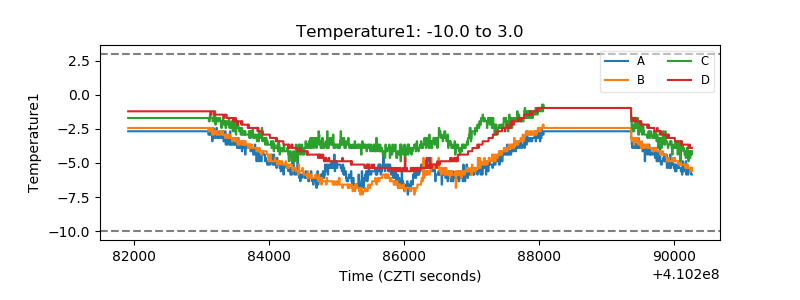 |
| Veto HV Monitor | 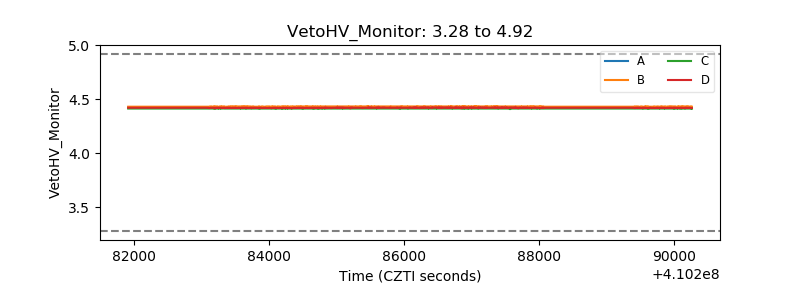 |
| Veto LLD | 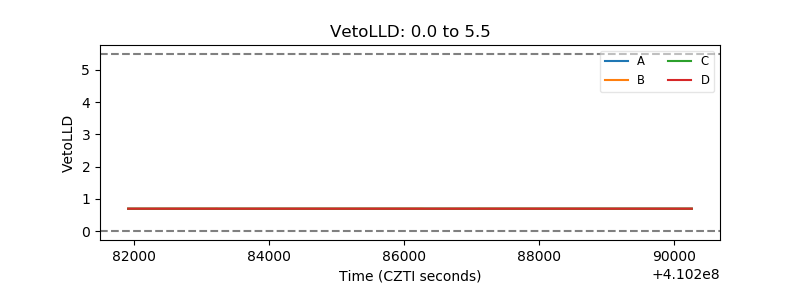 |
| Alpha Counter | 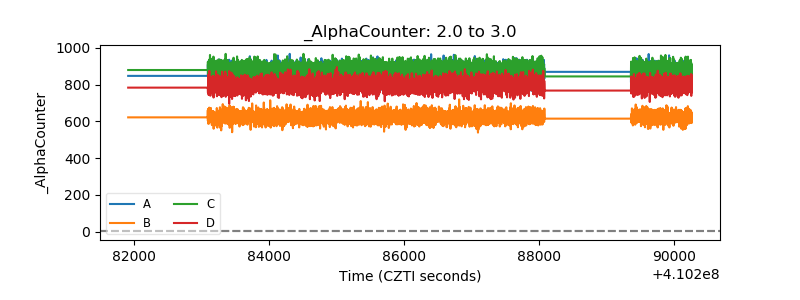 |
| _CPM_Rate | 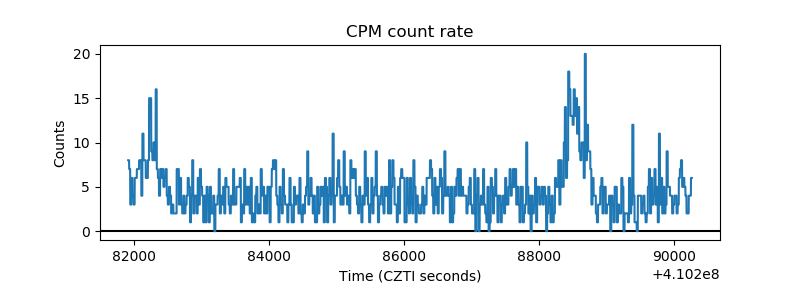 |
| CZT Counter | 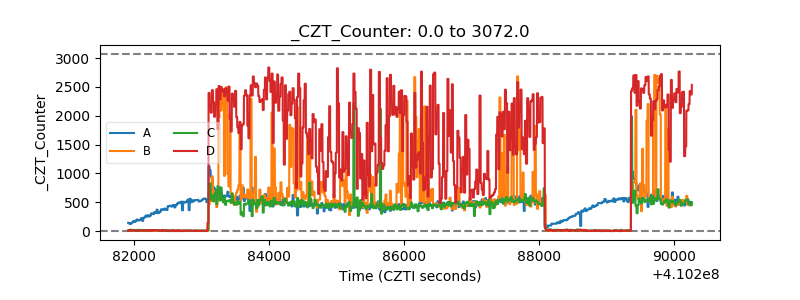 |
| +2.5 Volts monitor |  |
| +5 Volts monitor | 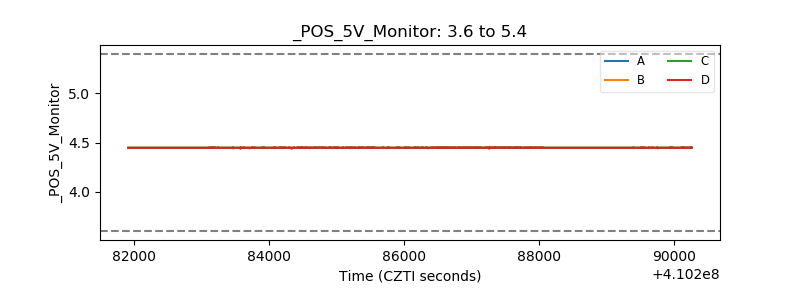 |
| _ROLL_ROT | 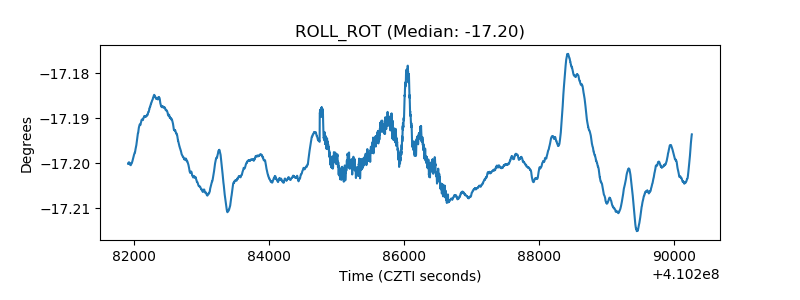 |
| _Roll_DEC | 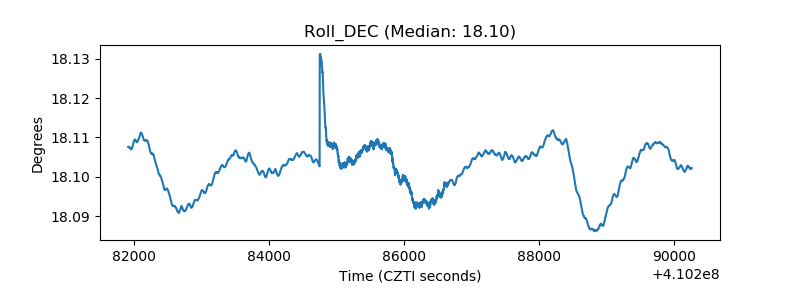 |
| _Roll_RA | 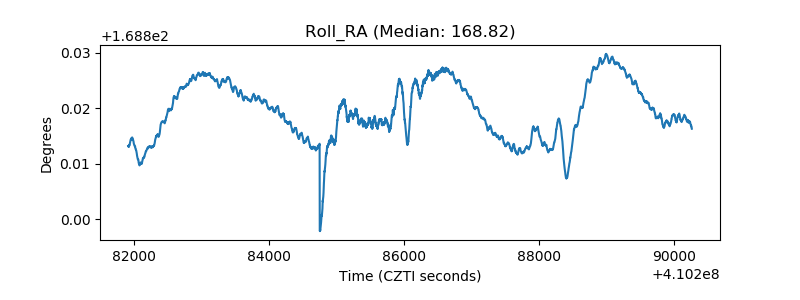 |
| Veto Counter | 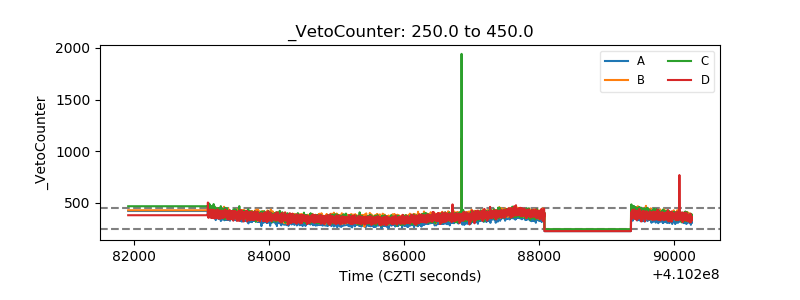 |