| Param | Original file | Final file |
|---|---|---|
| Filename | modeM0/AS1A12_025T11_9000005454_39268cztM0_level2.fits | modeM0/AS1A12_025T11_9000005454_39268cztM0_level2_quad_clean.evt |
| Size (bytes) | 556,845,120 | 88,655,040 |
| Size | 531.0 MB | 84.5 MB |
| Events in quadrant A | 2,975,902 | 644,482 |
| Events in quadrant B | 3,253,705 | 642,747 |
| Events in quadrant C | 3,047,520 | 626,661 |
| Events in quadrant D | 10,885,109 | 365,384 |
| Mode M0 | |||
|---|---|---|---|
| Quadrant | BADHDUFLAG | Total packets | Discarded packets |
| A | 0 | 12479 | 2 |
| B | 0 | 13448 | 2 |
| C | 0 | 12824 | 2 |
| D | 0 | 36334 | 2 |
| Mode SS | |||
|---|---|---|---|
| Quadrant | BADHDUFLAG | Total packets | Discarded packets |
| A | 0 | 116 | 0 |
| B | 0 | 116 | 0 |
| C | 0 | 116 | 0 |
| D | 0 | 116 | 0 |
| Mode M9 | |||
|---|---|---|---|
| Quadrant | BADHDUFLAG | Total packets | Discarded packets |
| A | 0 | 14 | 0 |
| B | 0 | 14 | 0 |
| C | 0 | 14 | 0 |
| D | 0 | 14 | 0 |
| Quadrant | Total seconds | Saturated seconds | Saturation percentage |
|---|---|---|---|
| A | 5799 | 17 | 0.293154% |
| B | 5799 | 180 | 3.103983% |
| C | 5799 | 37 | 0.638041% |
| D | 5800 | 2638 | 45.482759% |
Noise dominated data is calculated using 1-second bins in cleaned event files. If a bin has >2000 counts, and if more than 50% of those come from <1% of pixels, then it is considered to be noise-dominated and hence unusable.
| Quadrant | # 1 sec bins | Bins with >0 counts | Bins with >2000 counts | High rate bins dominated by noise | Noise dominated (total time) | Noise dominated (detector-on time) | Marked lightcurve |
|---|---|---|---|---|---|---|---|
| A | 7141 | 5800 | 4 | 4 | 0.06% | 0.07% | 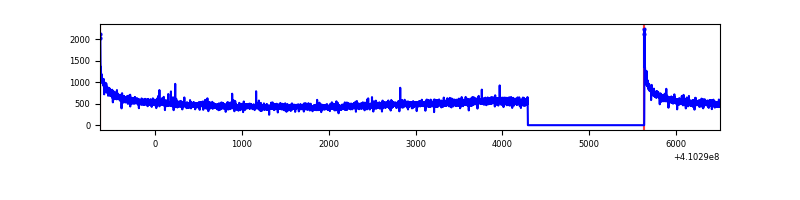 |
| B | 7141 | 5800 | 107 | 107 | 1.50% | 1.84% | 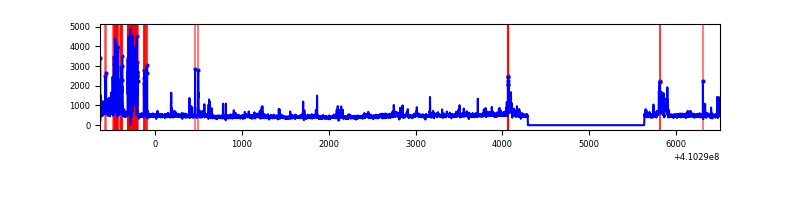 |
| C | 7141 | 5800 | 26 | 26 | 0.36% | 0.45% | 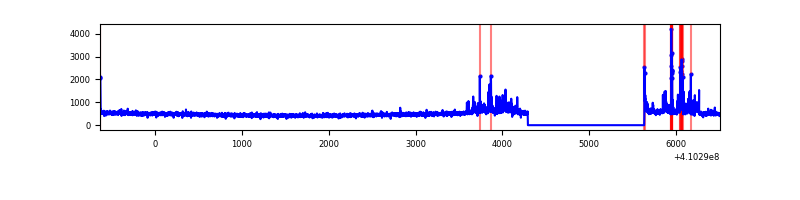 |
| D | 7142 | 5801 | 2518 | 2518 | 35.26% | 43.41% | 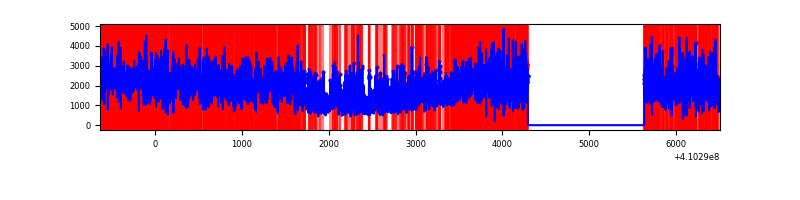 |
Top three noisy pixels from each quadrant. If the there are fewer than three noisy pixels in the level2.evt file, extra rows are filled as -1
| Pixel properties | Quadrant properties | ||||||
|---|---|---|---|---|---|---|---|
| Quadrant | DetID | PixID | Counts | Sigma | Mean | Median | Sigma |
| A | 10 | 83 | 451949 | 3383.32 | 652 | 639 | 133.4 |
| A | 13 | 254 | 7881 | 54.29 | 652 | 639 | 133.4 |
| A | 3 | 137 | 7394 | 50.64 | 652 | 639 | 133.4 |
| B | 5 | 172 | 497582 | 3955.32 | 638 | 621 | 125.6 |
| B | 0 | 190 | 109309 | 865.05 | 638 | 621 | 125.6 |
| B | 0 | 189 | 63596 | 501.22 | 638 | 621 | 125.6 |
| C | 15 | 214 | 260021 | 1728.81 | 637 | 640 | 150.0 |
| C | 9 | 187 | 195534 | 1298.99 | 637 | 640 | 150.0 |
| C | 3 | 233 | 97017 | 642.36 | 637 | 640 | 150.0 |
| D | 12 | 235 | 7493774 | 56827.88 | 535 | 520 | 131.9 |
| D | 2 | 249 | 754010 | 5714.37 | 535 | 520 | 131.9 |
| D | 12 | 227 | 291693 | 2208.22 | 535 | 520 | 131.9 |
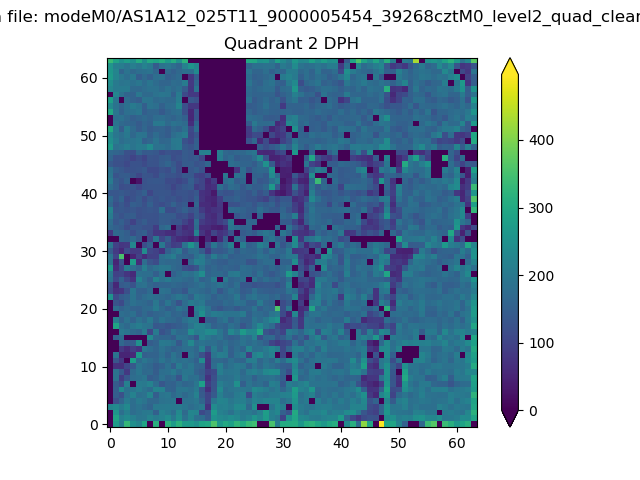
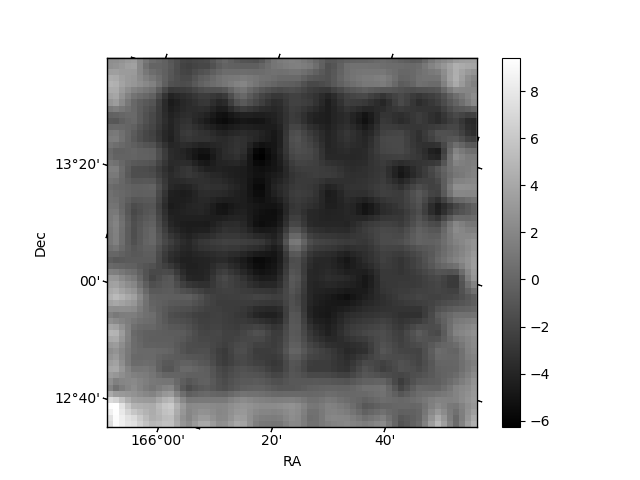
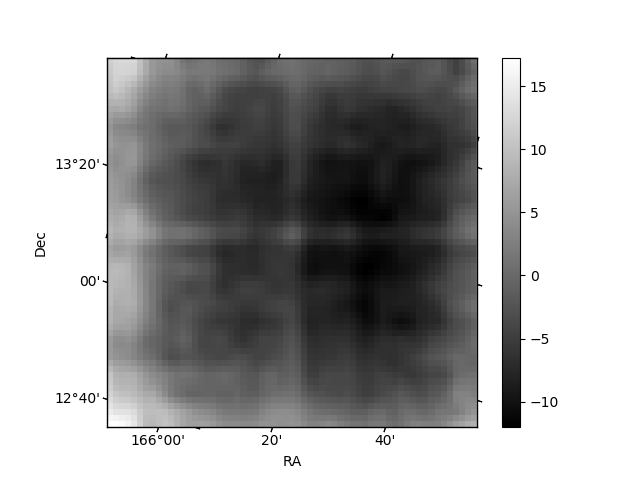
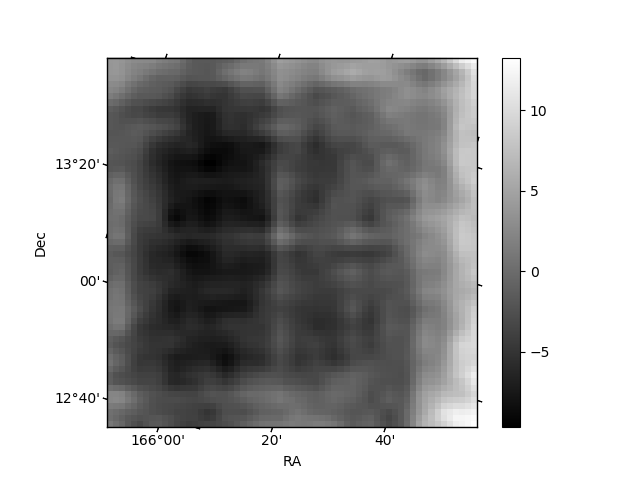
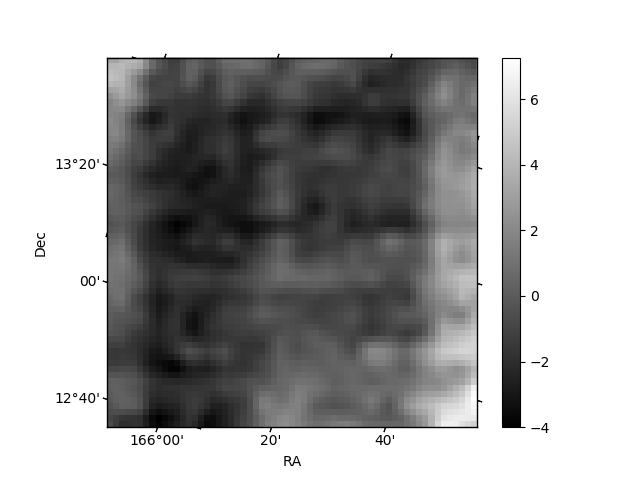
Histogram calculated using DETX and DETY for each event in the final _common_clean file
| Quadrant A | 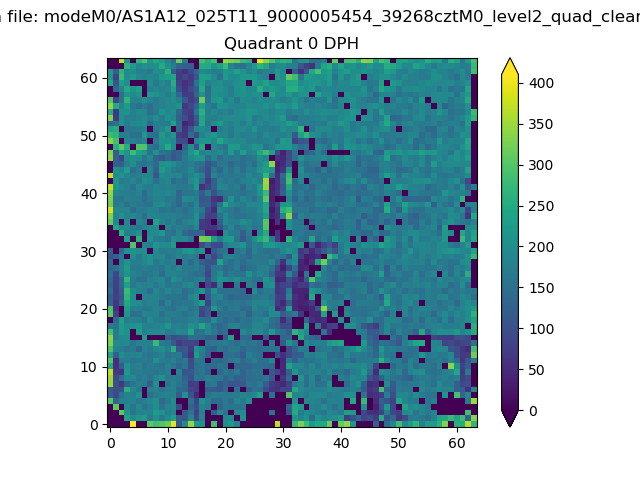 |
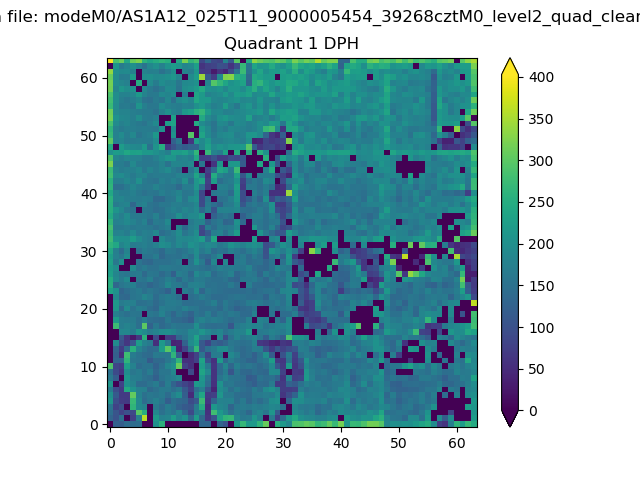 |
Quadrant B |
|---|---|---|---|
| Quadrant D | 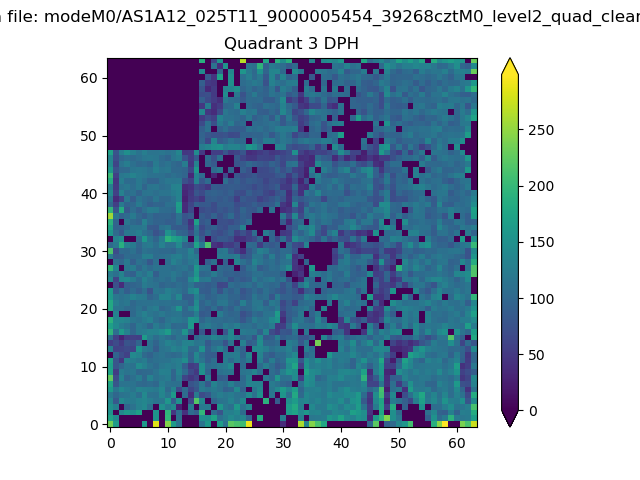 |
 |
Quadrant C |
| Plot type | Count rate plots | Images |
|---|---|---|
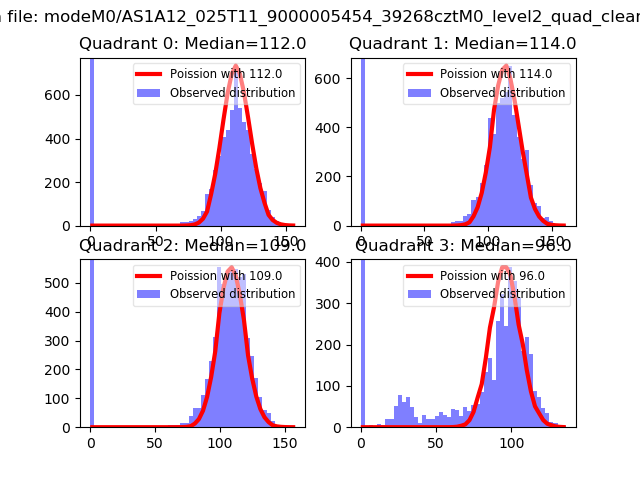
| Comparison with Poisson distribution Blue bars denote a histogram of data divided into 1 sec bins. Red curve is a Poisson curve with rate = median count rate of data. |
 |
 |
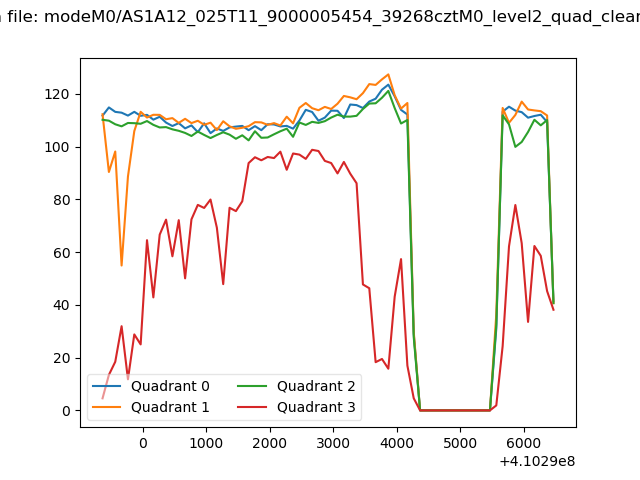
| Quadrant-wise count rates Data is divided into 100 sec bins |
 |
|
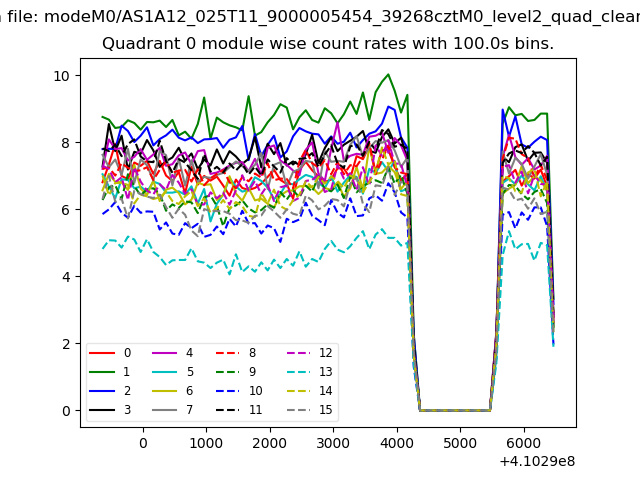
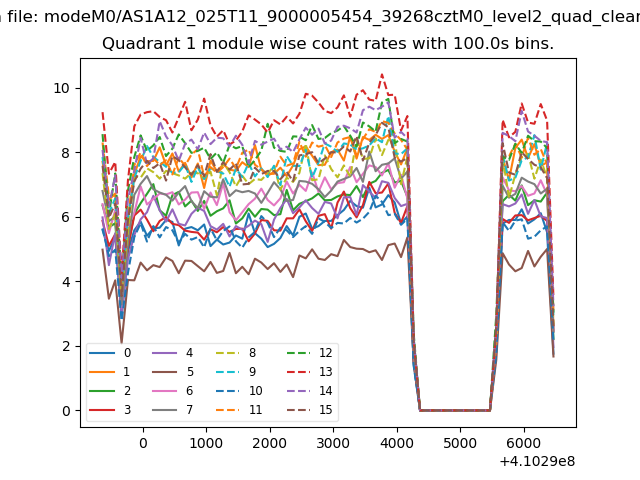
| Module-wise count rates for Quadrant A Data is divided into 100 sec bins |
 |
 |
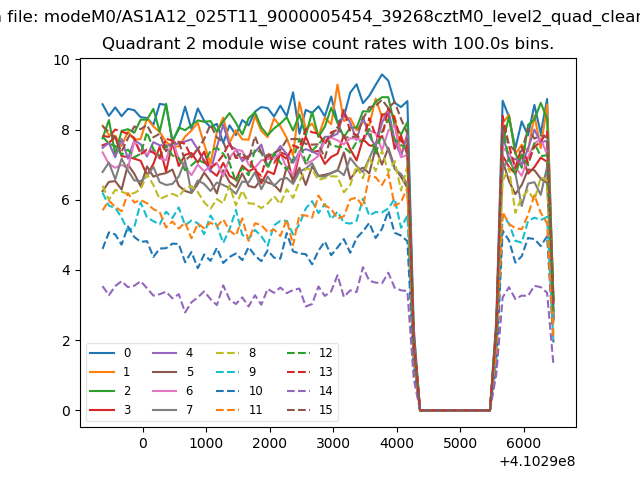
| Module-wise count rates for Quadrant B Data is divided into 100 sec bins |
 |
 |
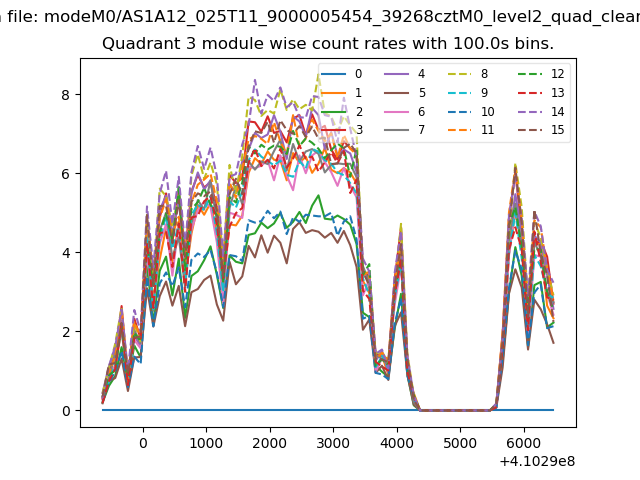
| Module-wise count rates for Quadrant C Data is divided into 100 sec bins |
 |
 |
| Module-wise count rates for Quadrant D Data is divided into 100 sec bins |
 |
 |
| Parameter | Plot |
|---|---|
| CZT HV Monitor | 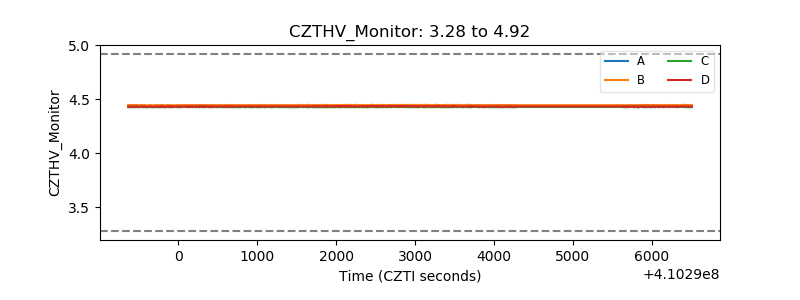 |
| D_VDD | 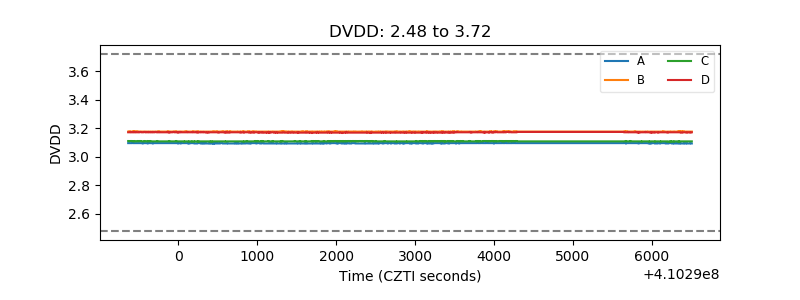 |
| Temperature 1 | 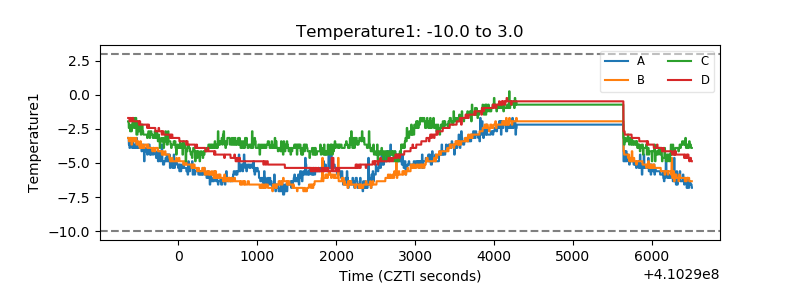 |
| Veto HV Monitor | 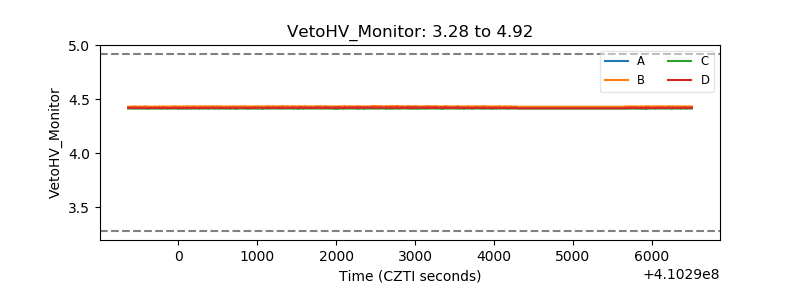 |
| Veto LLD | 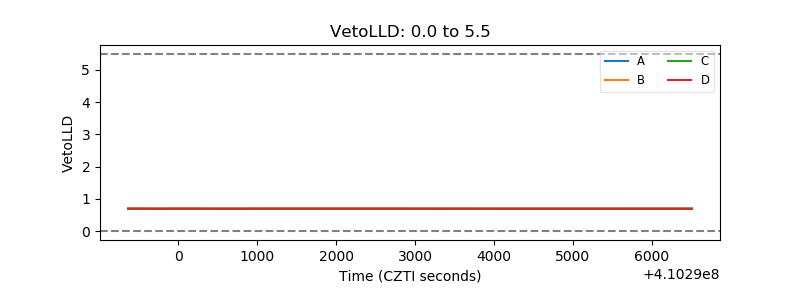 |
| Alpha Counter | 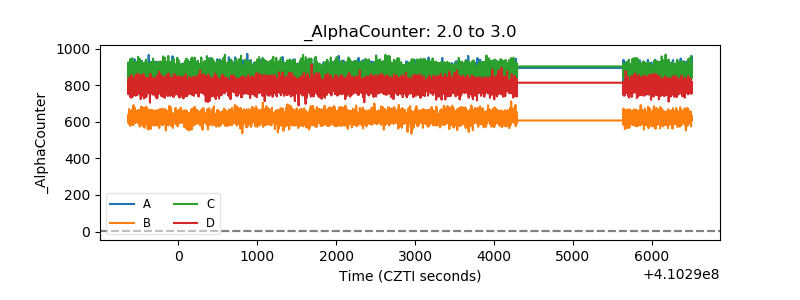 |
| _CPM_Rate | 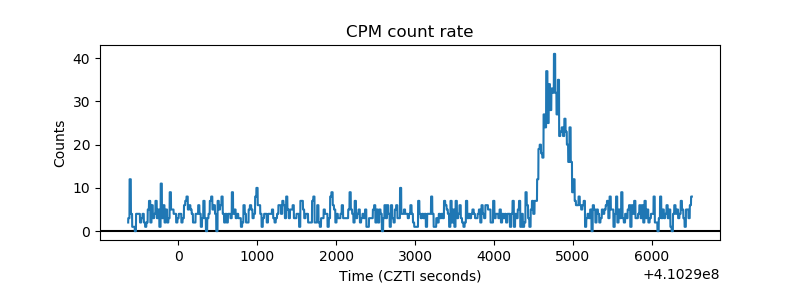 |
| CZT Counter | 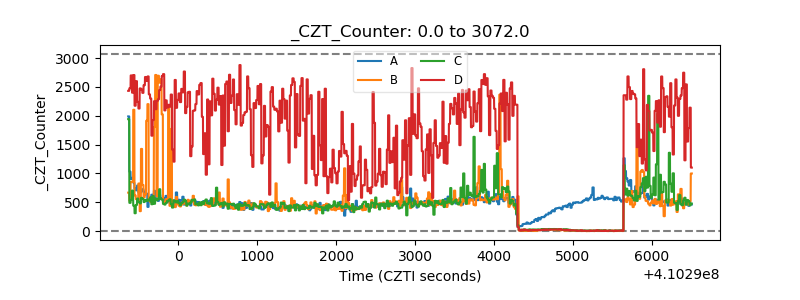 |
| +2.5 Volts monitor | 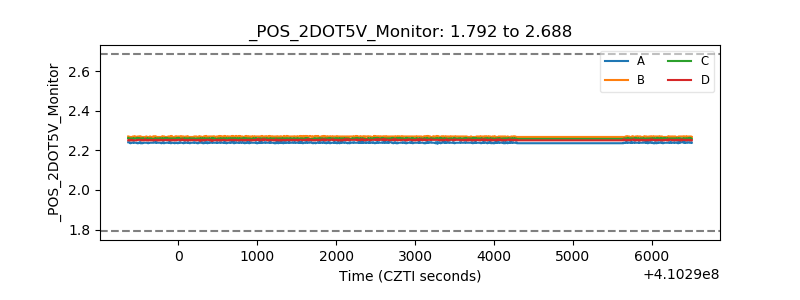 |
| +5 Volts monitor | 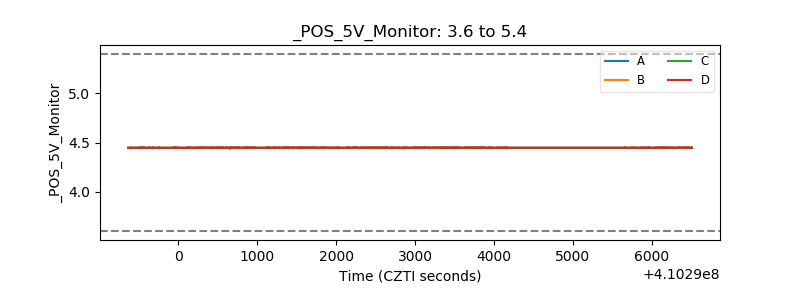 |
| _ROLL_ROT | 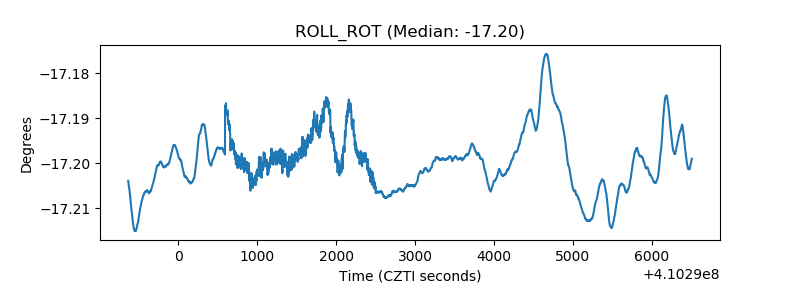 |
| _Roll_DEC | 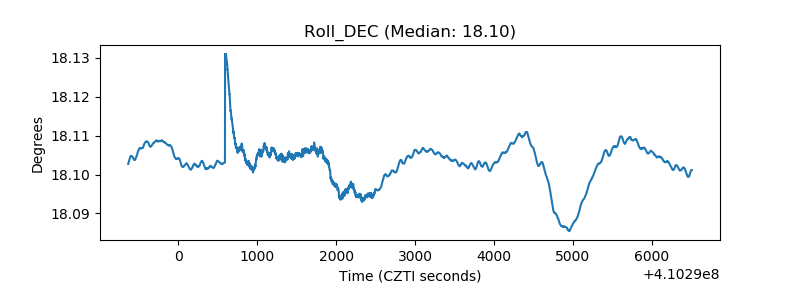 |
| _Roll_RA | 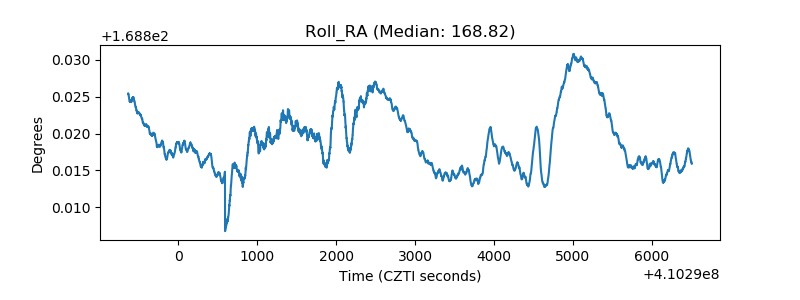 |
| Veto Counter | 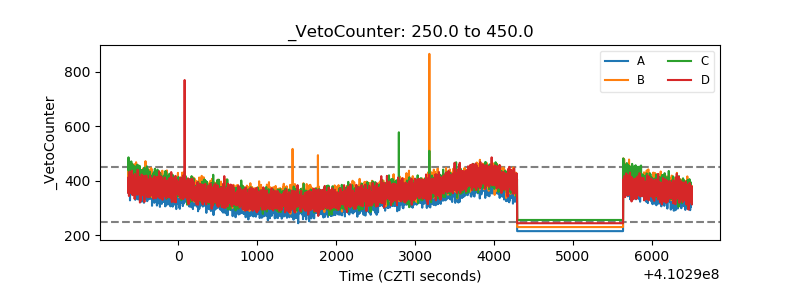 |