| Param | Original file | Final file |
|---|---|---|
| Filename | modeM0/AS1A12_037T01_9000005456_39268cztM0_level2.fits | modeM0/AS1A12_037T01_9000005456_39268cztM0_level2_quad_clean.evt |
| Size (bytes) | 698,207,040 | 131,025,600 |
| Size | 665.9 MB | 125.0 MB |
| Events in quadrant A | 4,073,696 | 913,779 |
| Events in quadrant B | 4,207,149 | 929,702 |
| Events in quadrant C | 3,877,040 | 897,193 |
| Events in quadrant D | 13,047,558 | 652,166 |
| Mode M0 | |||
|---|---|---|---|
| Quadrant | BADHDUFLAG | Total packets | Discarded packets |
| A | 0 | 17470 | 2 |
| B | 0 | 18088 | 1 |
| C | 0 | 16846 | 1 |
| D | 0 | 44550 | 1 |
| Mode SS | |||
|---|---|---|---|
| Quadrant | BADHDUFLAG | Total packets | Discarded packets |
| A | 0 | 168 | 0 |
| B | 0 | 168 | 0 |
| C | 0 | 168 | 0 |
| D | 0 | 168 | 0 |
| Mode M9 | |||
|---|---|---|---|
| Quadrant | BADHDUFLAG | Total packets | Discarded packets |
| A | 0 | 14 | 0 |
| B | 0 | 14 | 0 |
| C | 0 | 14 | 0 |
| D | 0 | 14 | 0 |
| Quadrant | Total seconds | Saturated seconds | Saturation percentage |
|---|---|---|---|
| A | 8259 | 18 | 0.217944% |
| B | 8259 | 67 | 0.811236% |
| C | 8259 | 3 | 0.036324% |
| D | 8259 | 2353 | 28.490132% |
Noise dominated data is calculated using 1-second bins in cleaned event files. If a bin has >2000 counts, and if more than 50% of those come from <1% of pixels, then it is considered to be noise-dominated and hence unusable.
| Quadrant | # 1 sec bins | Bins with >0 counts | Bins with >2000 counts | High rate bins dominated by noise | Noise dominated (total time) | Noise dominated (detector-on time) | Marked lightcurve |
|---|---|---|---|---|---|---|---|
| A | 9691 | 8260 | 6 | 6 | 0.06% | 0.07% | 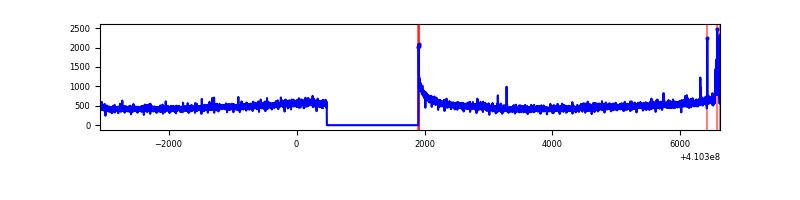 |
| B | 9691 | 8260 | 45 | 45 | 0.46% | 0.54% | 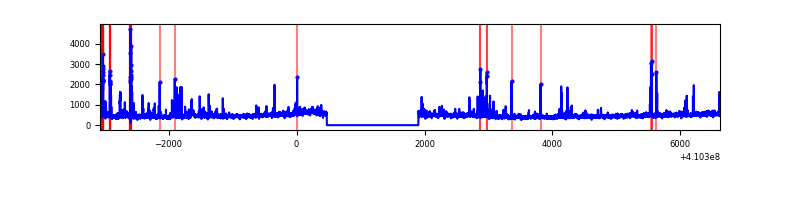 |
| C | 9691 | 8260 | 0 | 0 | 0.00% | 0.00% | 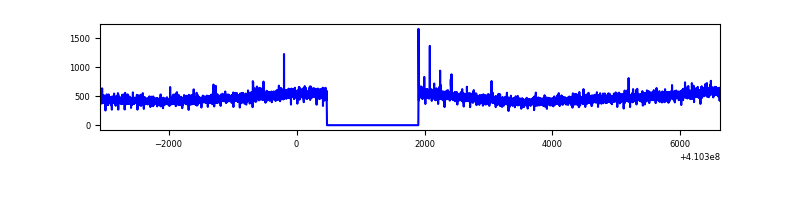 |
| D | 9691 | 8260 | 2167 | 2167 | 22.36% | 26.23% | 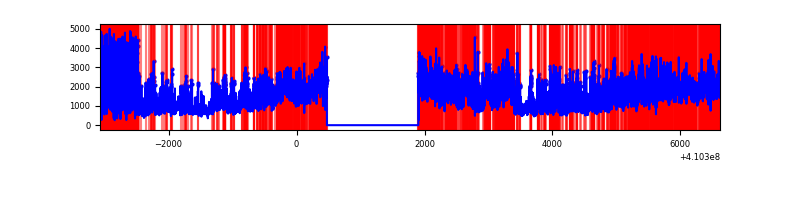 |
Top three noisy pixels from each quadrant. If the there are fewer than three noisy pixels in the level2.evt file, extra rows are filled as -1
| Pixel properties | Quadrant properties | ||||||
|---|---|---|---|---|---|---|---|
| Quadrant | DetID | PixID | Counts | Sigma | Mean | Median | Sigma |
| A | 10 | 83 | 466518 | 2515.34 | 916 | 898 | 185.1 |
| A | 15 | 222 | 60096 | 319.79 | 916 | 898 | 185.1 |
| A | 3 | 137 | 10198 | 50.24 | 916 | 898 | 185.1 |
| B | 5 | 172 | 202293 | 1139.98 | 904 | 878 | 176.7 |
| B | 0 | 190 | 152144 | 856.14 | 904 | 878 | 176.7 |
| B | 5 | 255 | 126341 | 710.1 | 904 | 878 | 176.7 |
| C | 15 | 214 | 361684 | 1712.36 | 893 | 898 | 210.7 |
| C | 3 | 233 | 16136 | 72.32 | 893 | 898 | 210.7 |
| C | 9 | 187 | 10246 | 44.37 | 893 | 898 | 210.7 |
| D | 12 | 235 | 9475286 | 47559.06 | 817 | 794 | 199.2 |
| D | 12 | 227 | 257544 | 1288.8 | 817 | 794 | 199.2 |
| D | 2 | 249 | 79813 | 396.65 | 817 | 794 | 199.2 |
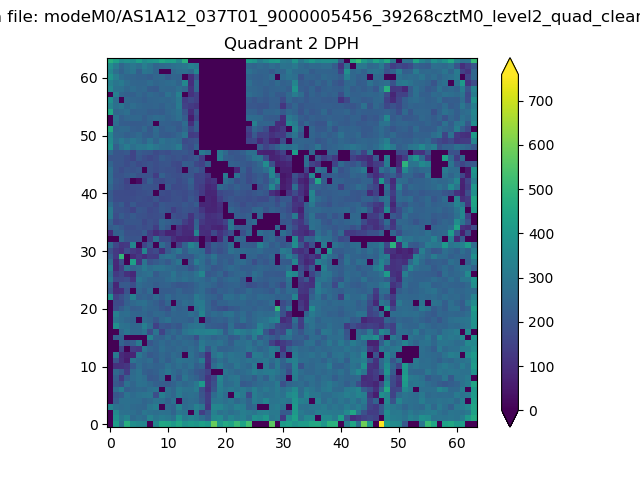
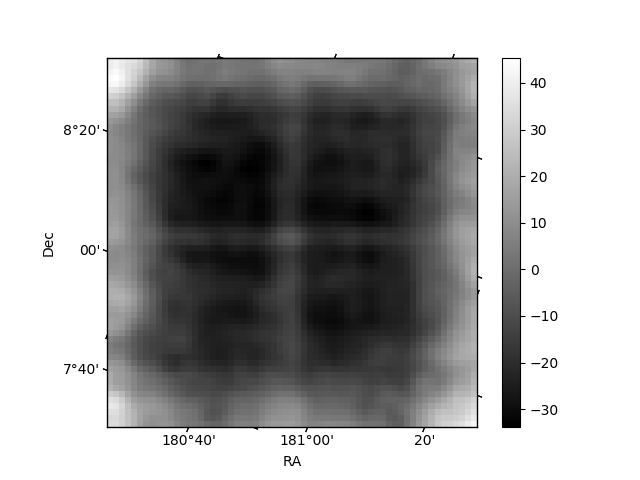
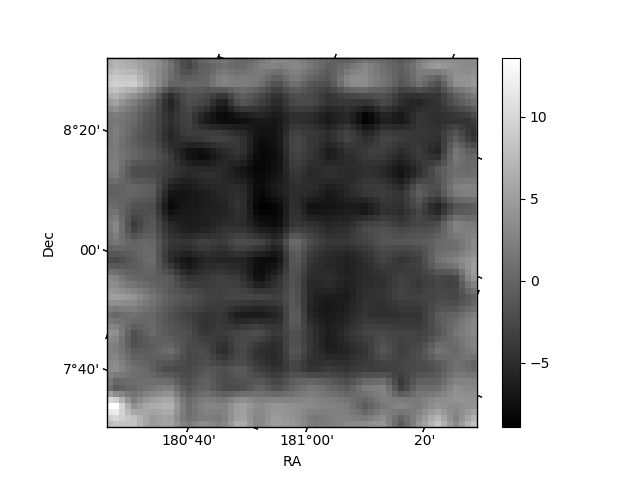
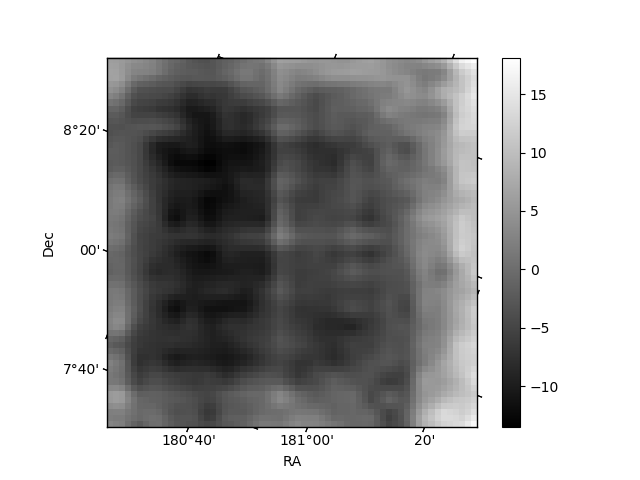
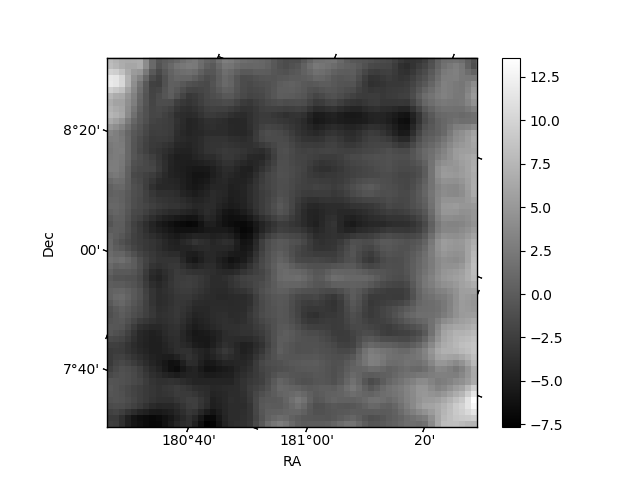
Histogram calculated using DETX and DETY for each event in the final _common_clean file
| Quadrant A | 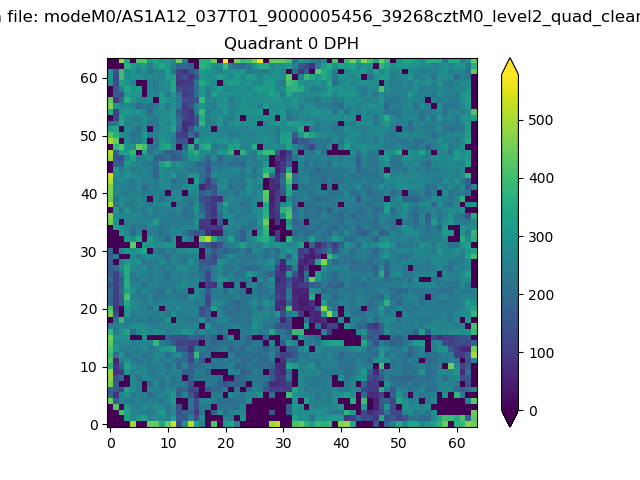 |
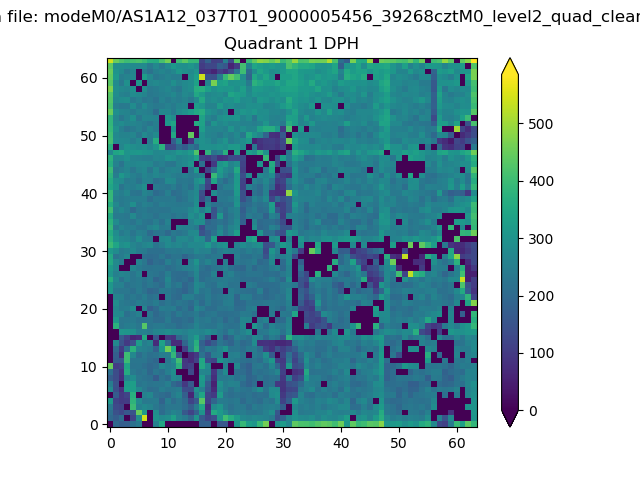 |
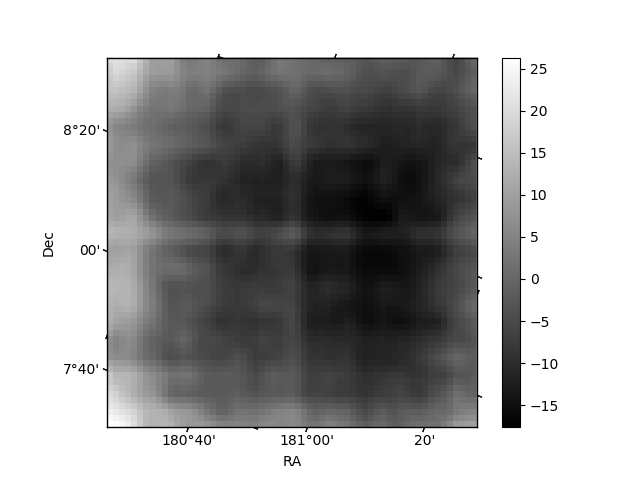
Quadrant B |
|---|---|---|---|
| Quadrant D | 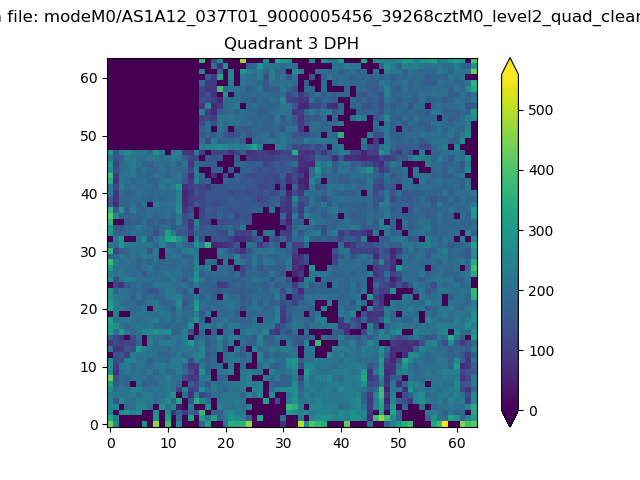 |
 |
Quadrant C |
| Plot type | Count rate plots | Images |
|---|---|---|
| Comparison with Poisson distribution Blue bars denote a histogram of data divided into 1 sec bins. Red curve is a Poisson curve with rate = median count rate of data. |
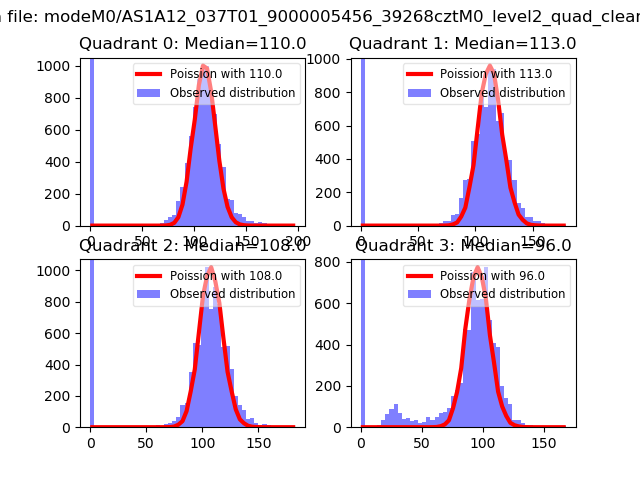 |
 |
| Quadrant-wise count rates Data is divided into 100 sec bins |
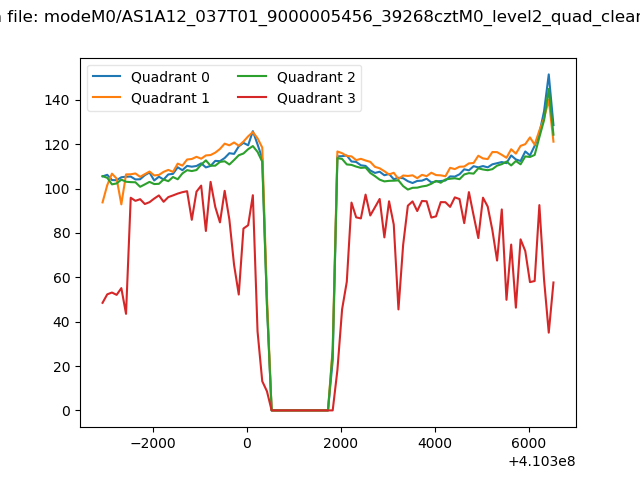 |
|
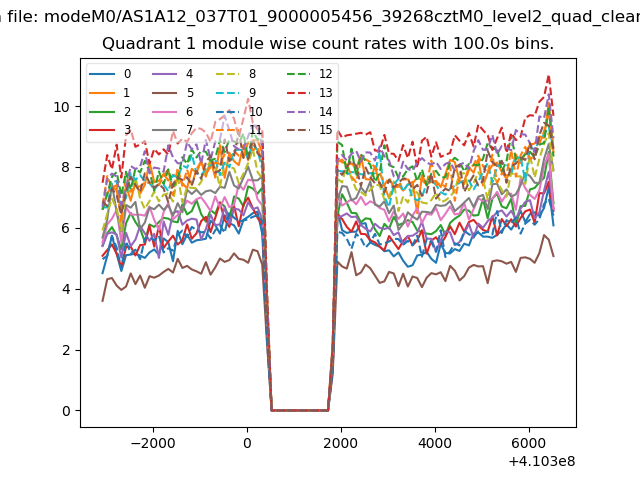
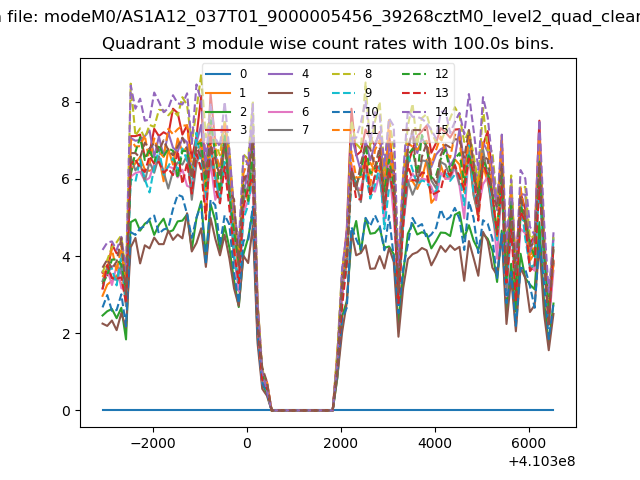
| Module-wise count rates for Quadrant A Data is divided into 100 sec bins |
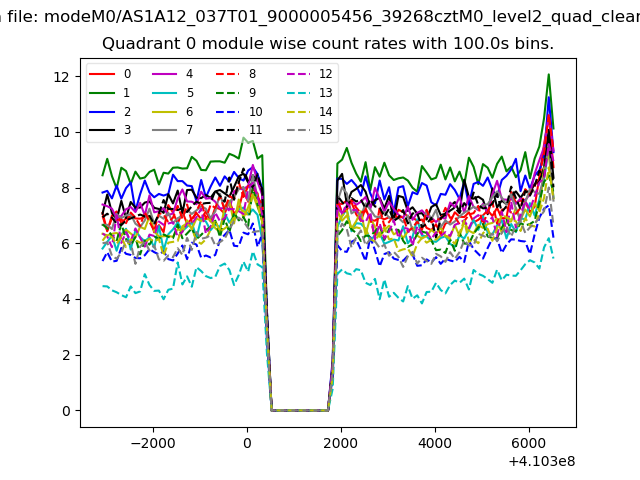 |
 |
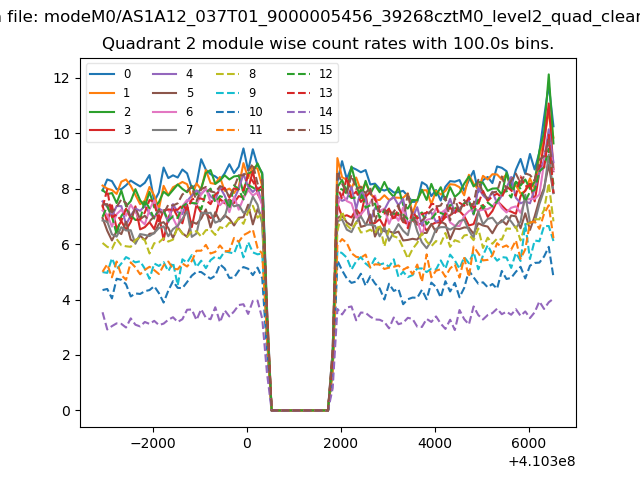
| Module-wise count rates for Quadrant B Data is divided into 100 sec bins |
 |
 |
| Module-wise count rates for Quadrant C Data is divided into 100 sec bins |
 |
 |
| Module-wise count rates for Quadrant D Data is divided into 100 sec bins |
 |
 |
| Parameter | Plot |
|---|---|
| CZT HV Monitor | 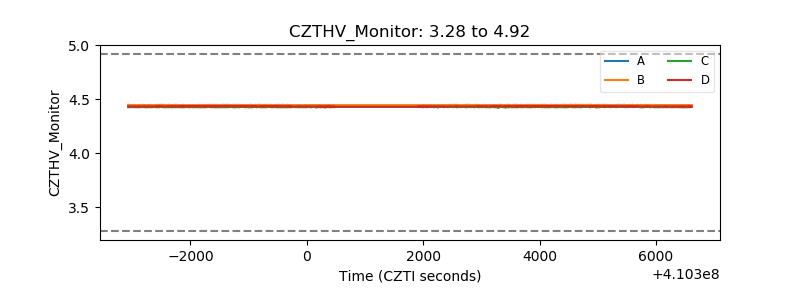 |
| D_VDD | 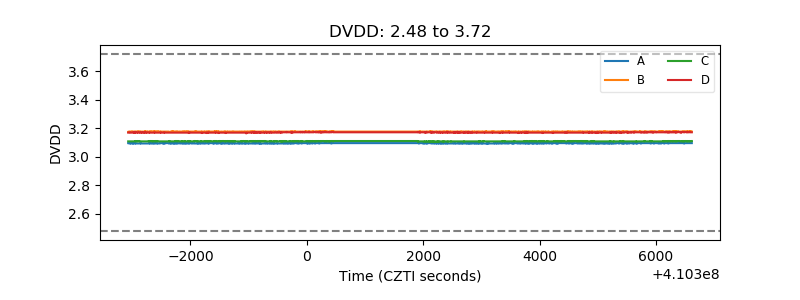 |
| Temperature 1 | 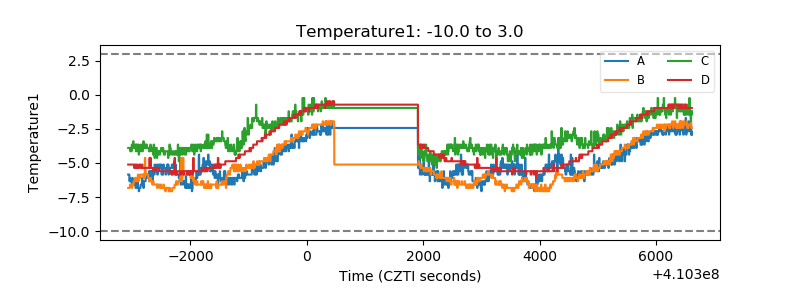 |
| Veto HV Monitor | 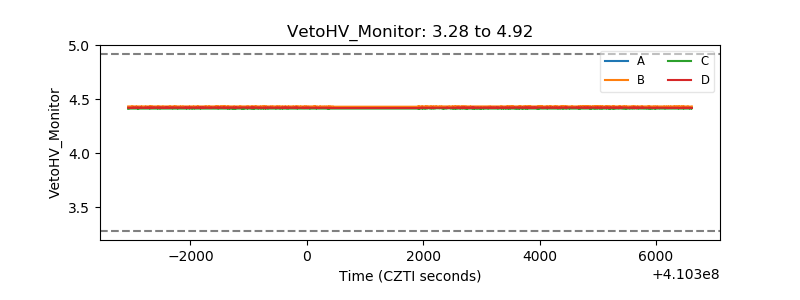 |
| Veto LLD | 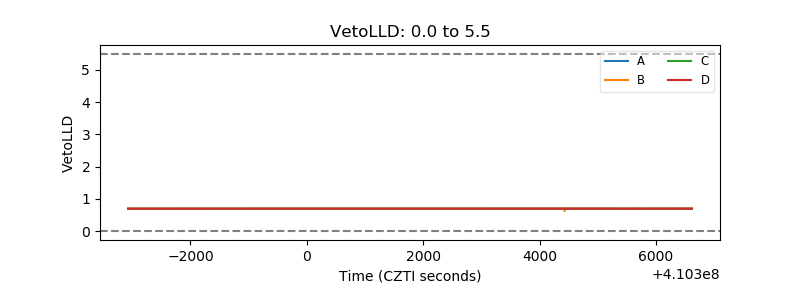 |
| Alpha Counter | 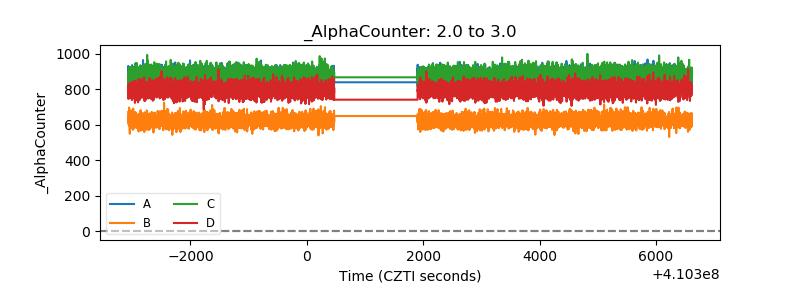 |
| _CPM_Rate | 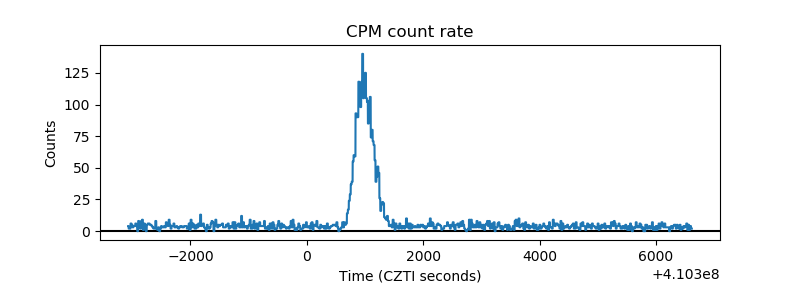 |
| CZT Counter | 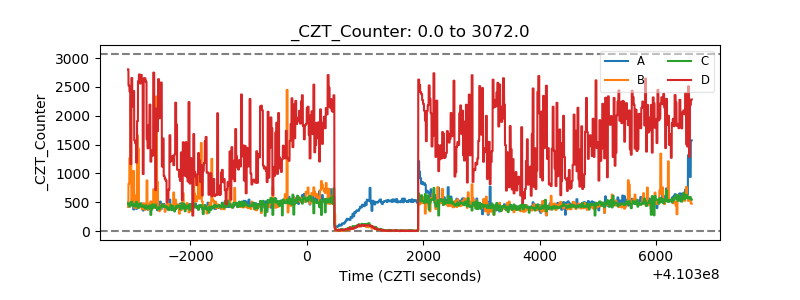 |
| +2.5 Volts monitor | 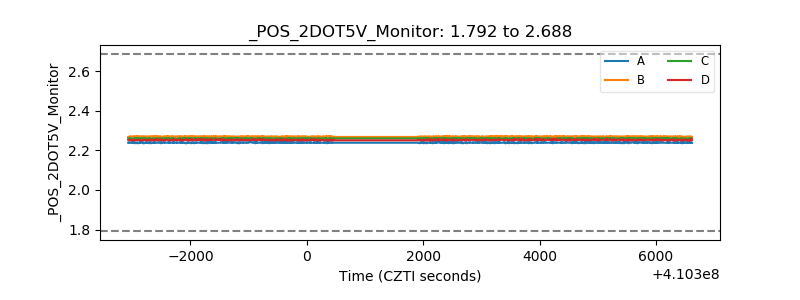 |
| +5 Volts monitor | 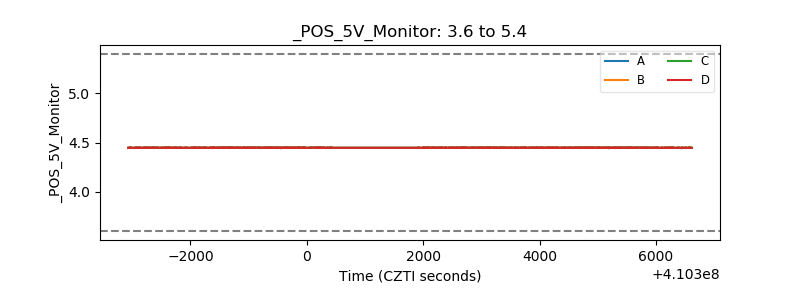 |
| _ROLL_ROT | 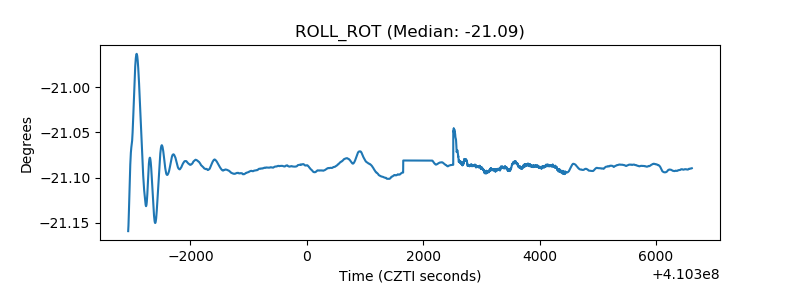 |
| _Roll_DEC | 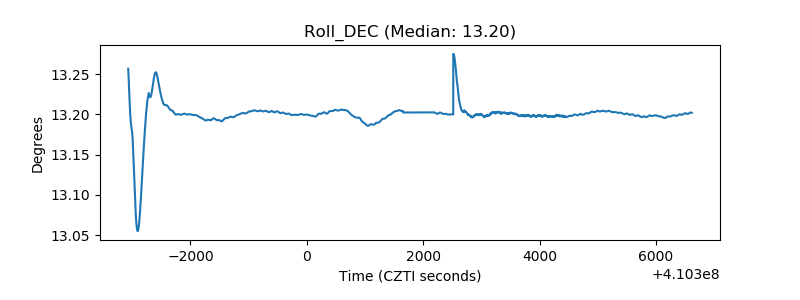 |
| _Roll_RA | 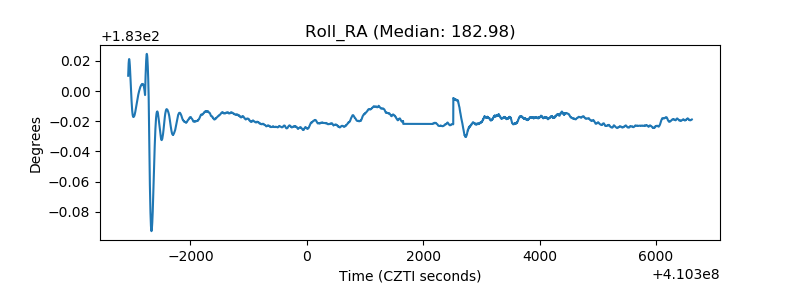 |
| Veto Counter | 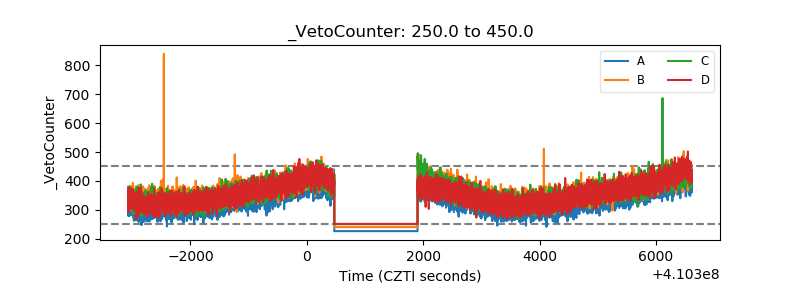 |