| Param | Original file | Final file |
|---|---|---|
| Filename | modeM0/AS1A12_037T01_9000005456_39270cztM0_level2.fits | modeM0/AS1A12_037T01_9000005456_39270cztM0_level2_quad_clean.evt |
| Size (bytes) | 1,038,542,400 | 170,930,880 |
| Size | 990.4 MB | 163.0 MB |
| Events in quadrant A | 10,046,767 | 1,078,754 |
| Events in quadrant B | 5,865,311 | 1,264,949 |
| Events in quadrant C | 5,310,312 | 1,214,771 |
| Events in quadrant D | 16,374,129 | 858,759 |
| Mode M0 | |||
|---|---|---|---|
| Quadrant | BADHDUFLAG | Total packets | Discarded packets |
| A | 0 | 36971 | 3 |
| B | 0 | 24504 | 2 |
| C | 0 | 22597 | 2 |
| D | 0 | 56254 | 2 |
| Mode SS | |||
|---|---|---|---|
| Quadrant | BADHDUFLAG | Total packets | Discarded packets |
| A | 0 | 224 | 0 |
| B | 0 | 224 | 0 |
| C | 0 | 224 | 0 |
| D | 0 | 224 | 0 |
| Mode M9 | |||
|---|---|---|---|
| Quadrant | BADHDUFLAG | Total packets | Discarded packets |
| A | 0 | 51 | 0 |
| B | 0 | 51 | 0 |
| C | 0 | 51 | 0 |
| D | 0 | 51 | 0 |
| Quadrant | Total seconds | Saturated seconds | Saturation percentage |
|---|---|---|---|
| A | 10955 | 1637 | 14.942948% |
| B | 10955 | 264 | 2.409859% |
| C | 10955 | 13 | 0.118667% |
| D | 10955 | 2925 | 26.700137% |
Noise dominated data is calculated using 1-second bins in cleaned event files. If a bin has >2000 counts, and if more than 50% of those come from <1% of pixels, then it is considered to be noise-dominated and hence unusable.
| Quadrant | # 1 sec bins | Bins with >0 counts | Bins with >2000 counts | High rate bins dominated by noise | Noise dominated (total time) | Noise dominated (detector-on time) | Marked lightcurve |
|---|---|---|---|---|---|---|---|
| A | 16001 | 10958 | 1387 | 1387 | 8.67% | 12.66% | 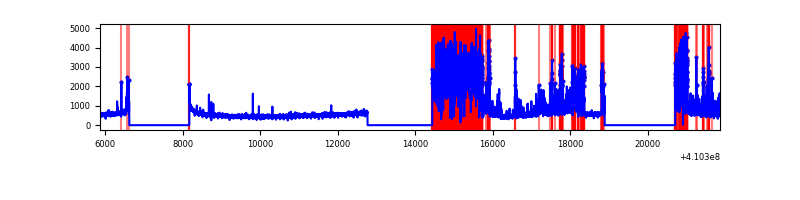 |
| B | 16001 | 10958 | 139 | 139 | 0.87% | 1.27% | 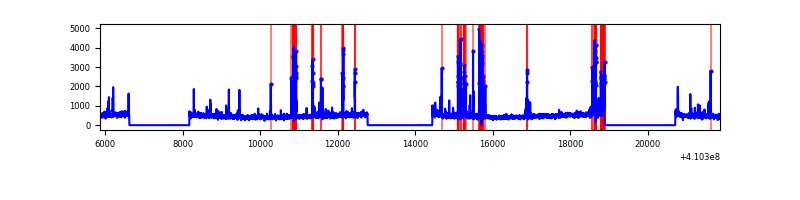 |
| C | 16001 | 10958 | 0 | 0 | 0.00% | 0.00% | 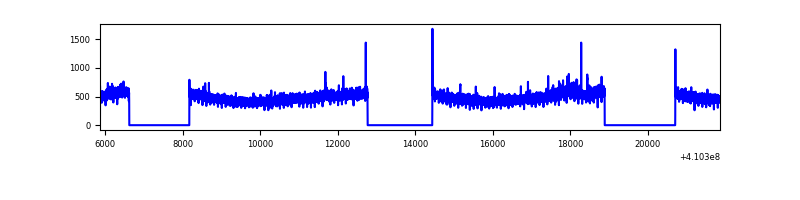 |
| D | 16001 | 10958 | 2579 | 2579 | 16.12% | 23.54% | 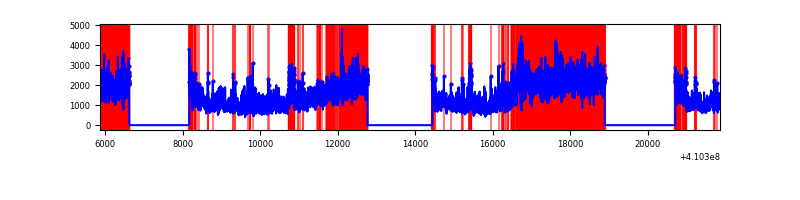 |
Top three noisy pixels from each quadrant. If the there are fewer than three noisy pixels in the level2.evt file, extra rows are filled as -1
| Pixel properties | Quadrant properties | ||||||
|---|---|---|---|---|---|---|---|
| Quadrant | DetID | PixID | Counts | Sigma | Mean | Median | Sigma |
| A | 15 | 222 | 4879501 | 20870.18 | 1152 | 1127 | 233.7 |
| A | 10 | 83 | 700983 | 2994.06 | 1152 | 1127 | 233.7 |
| A | 13 | 254 | 14018 | 55.15 | 1152 | 1127 | 233.7 |
| B | 5 | 255 | 404776 | 1727.05 | 1222 | 1188 | 233.7 |
| B | 5 | 172 | 315980 | 1347.07 | 1222 | 1188 | 233.7 |
| B | 0 | 190 | 178636 | 759.34 | 1222 | 1188 | 233.7 |
| C | 15 | 214 | 492757 | 1744.71 | 1210 | 1217 | 281.7 |
| C | 3 | 233 | 80527 | 281.51 | 1210 | 1217 | 281.7 |
| C | 0 | 10 | 10379 | 32.52 | 1210 | 1217 | 281.7 |
| D | 12 | 235 | 11094336 | 41629.41 | 1095 | 1064 | 266.5 |
| D | 12 | 227 | 426788 | 1597.6 | 1095 | 1064 | 266.5 |
| D | 1 | 47 | 277312 | 1036.67 | 1095 | 1064 | 266.5 |
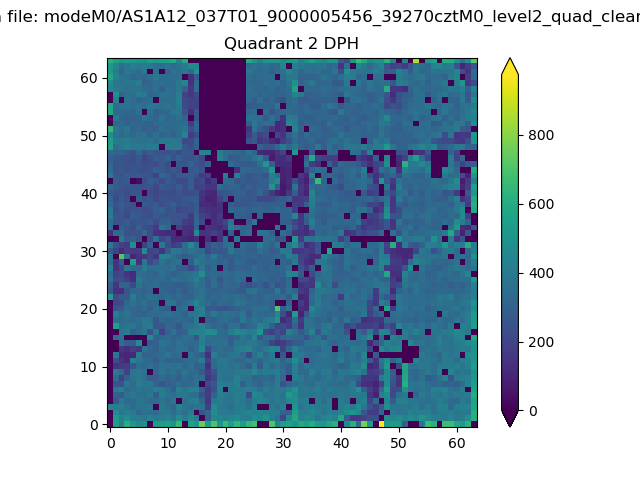
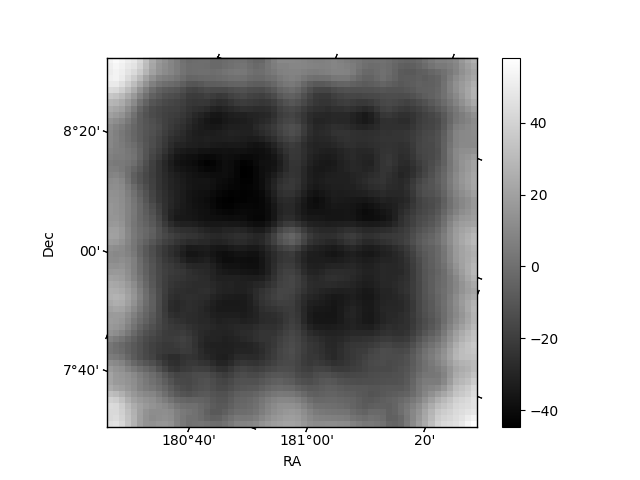
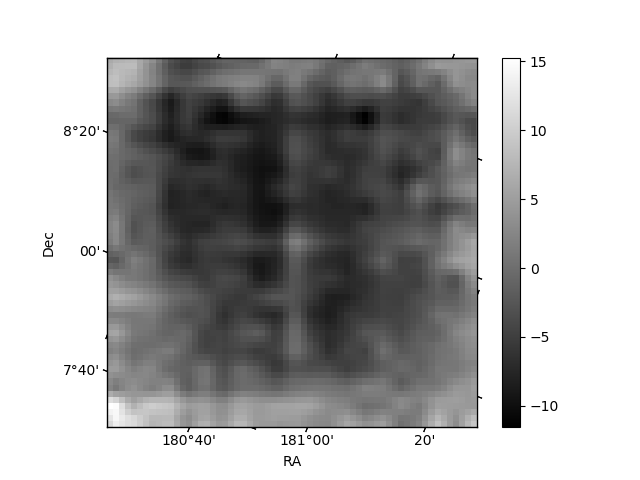
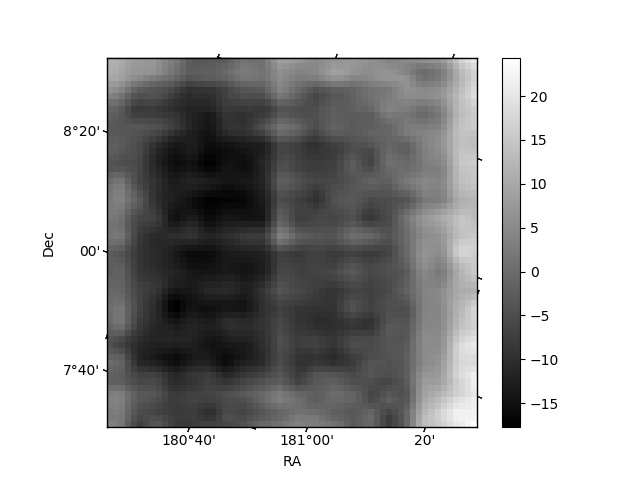
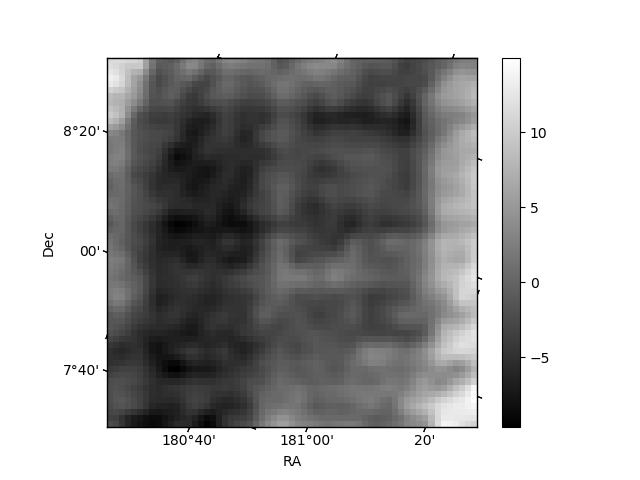
Histogram calculated using DETX and DETY for each event in the final _common_clean file
| Quadrant A | 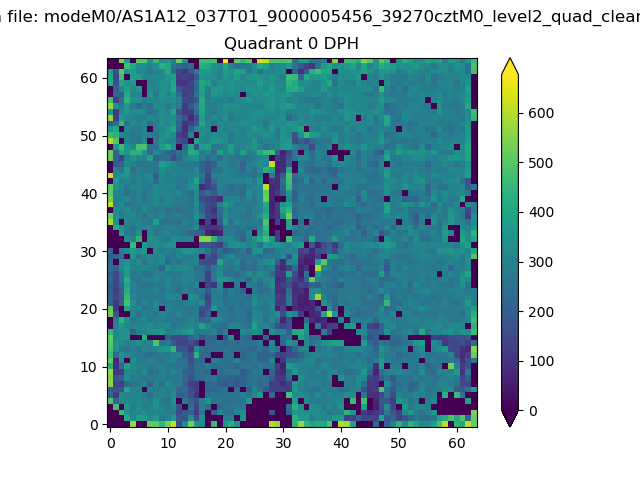 |
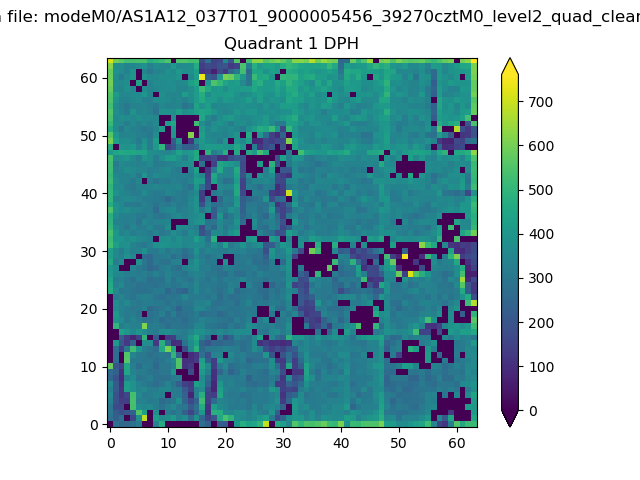 |
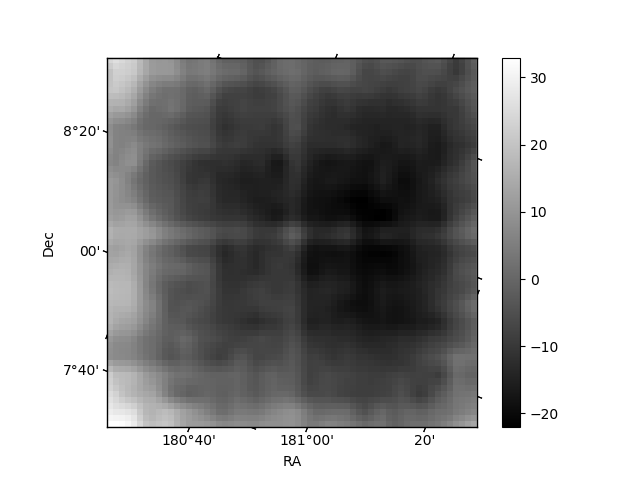
Quadrant B |
|---|---|---|---|
| Quadrant D | 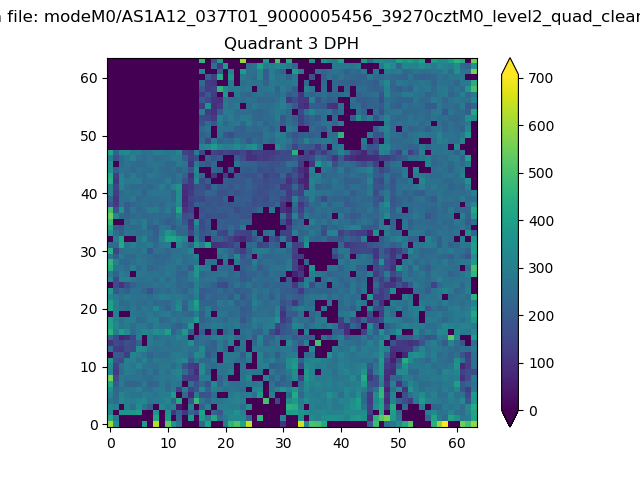 |
 |
Quadrant C |
| Plot type | Count rate plots | Images |
|---|---|---|
| Comparison with Poisson distribution Blue bars denote a histogram of data divided into 1 sec bins. Red curve is a Poisson curve with rate = median count rate of data. |
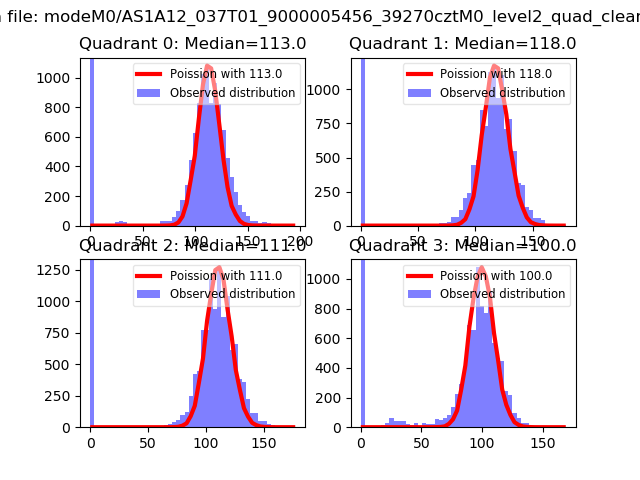 |
 |
| Quadrant-wise count rates Data is divided into 100 sec bins |
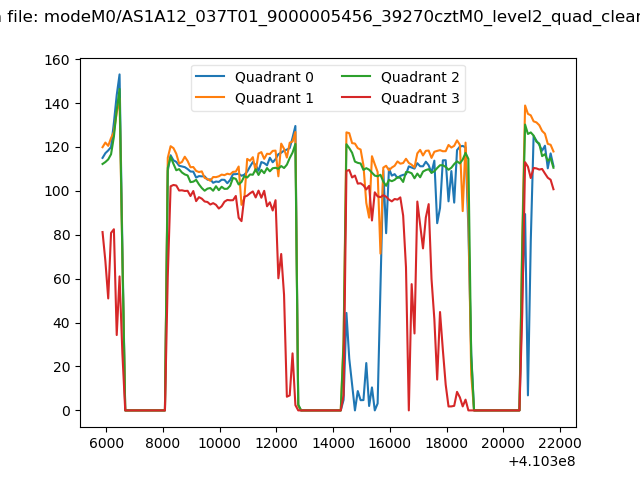 |
|
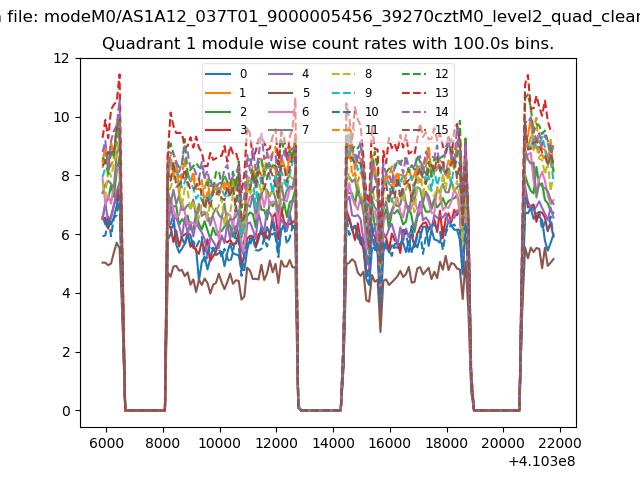
| Module-wise count rates for Quadrant A Data is divided into 100 sec bins |
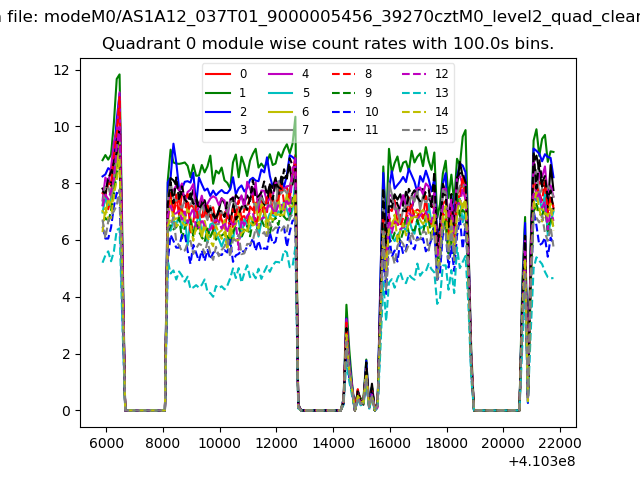 |
 |
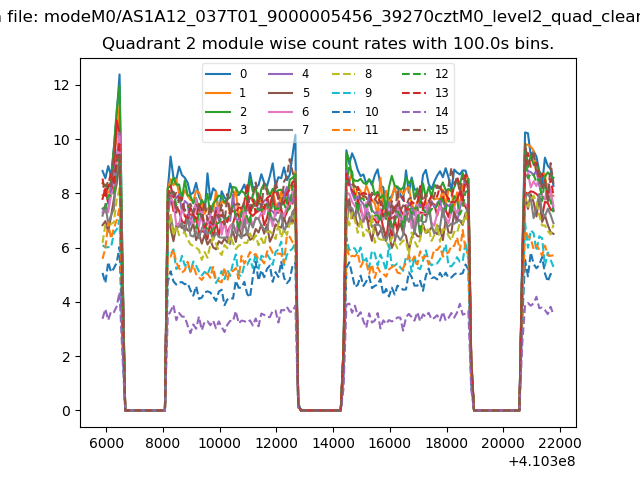
| Module-wise count rates for Quadrant B Data is divided into 100 sec bins |
 |
 |
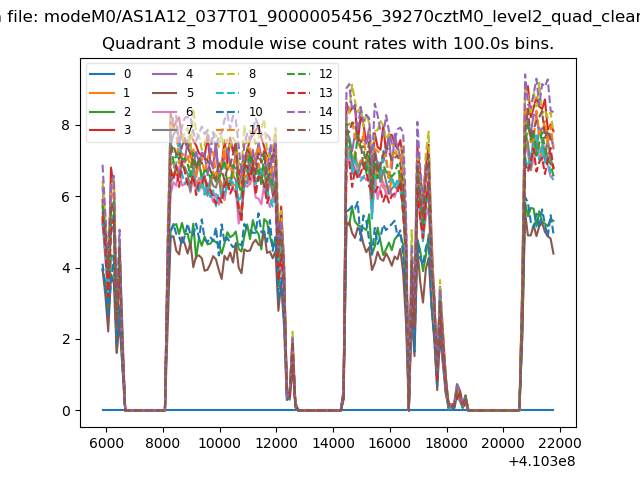
| Module-wise count rates for Quadrant C Data is divided into 100 sec bins |
 |
 |
| Module-wise count rates for Quadrant D Data is divided into 100 sec bins |
 |
 |
| Parameter | Plot |
|---|---|
| CZT HV Monitor | 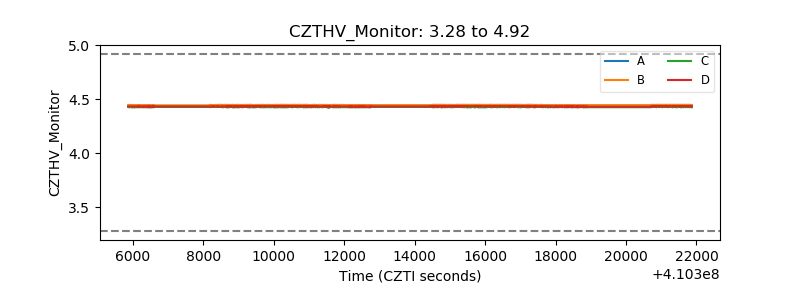 |
| D_VDD | 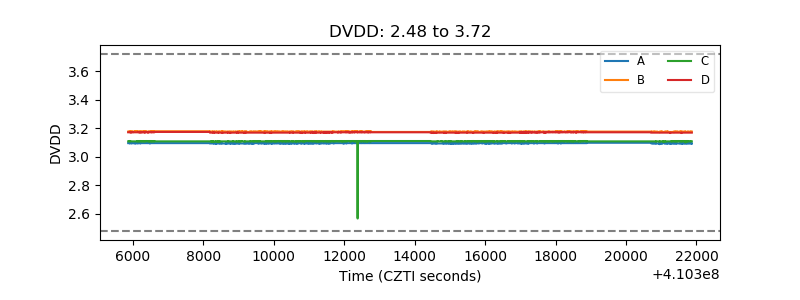 |
| Temperature 1 | 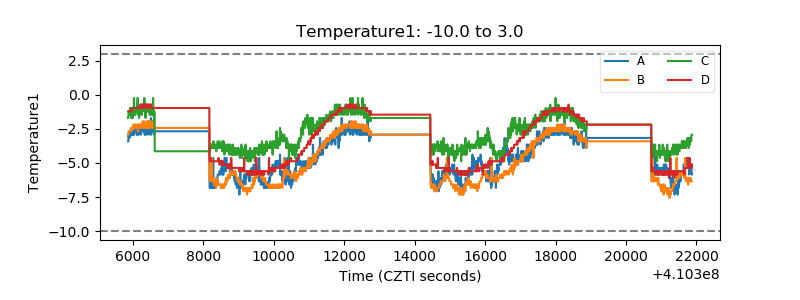 |
| Veto HV Monitor | 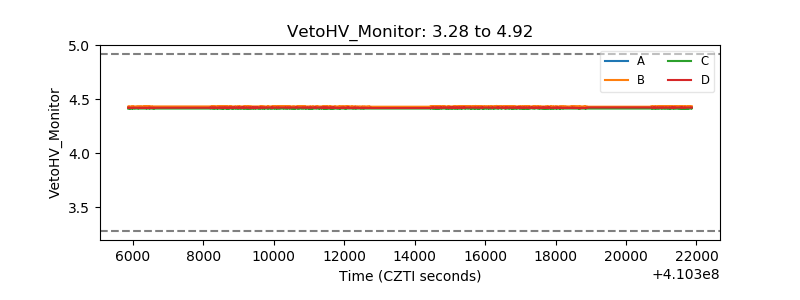 |
| Veto LLD | 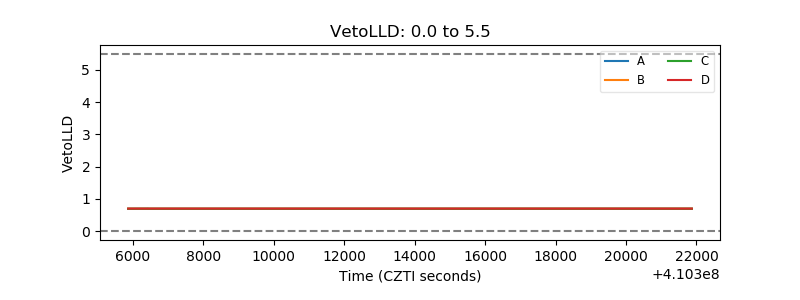 |
| Alpha Counter | 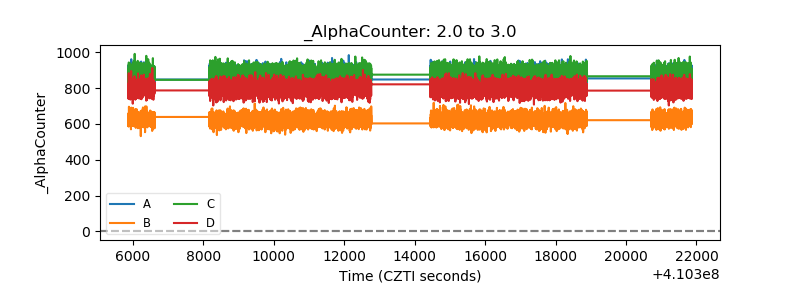 |
| _CPM_Rate | 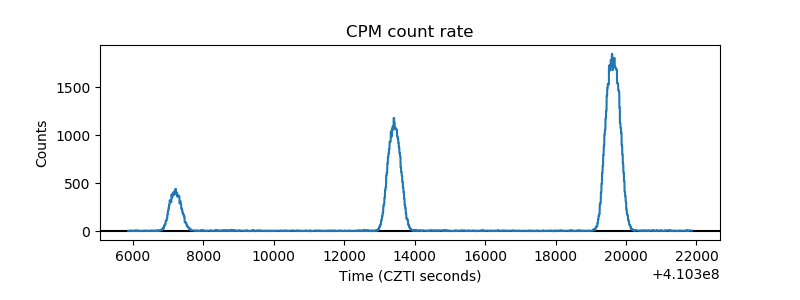 |
| CZT Counter | 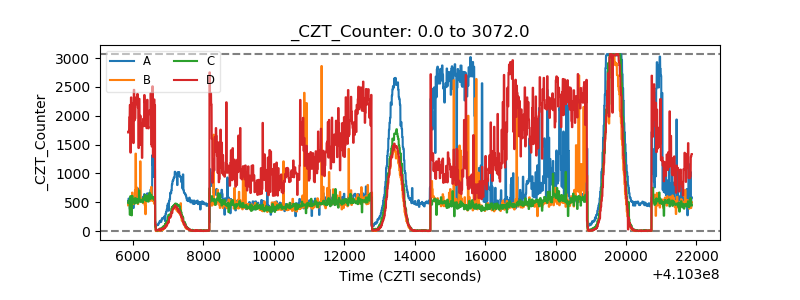 |
| +2.5 Volts monitor | 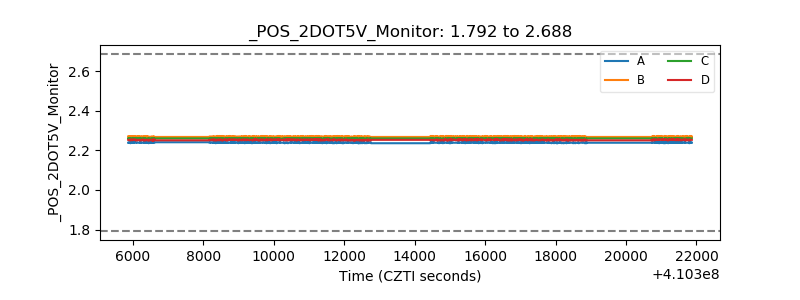 |
| +5 Volts monitor | 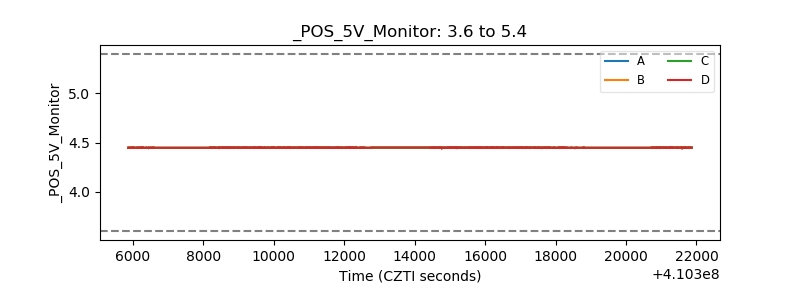 |
| _ROLL_ROT | 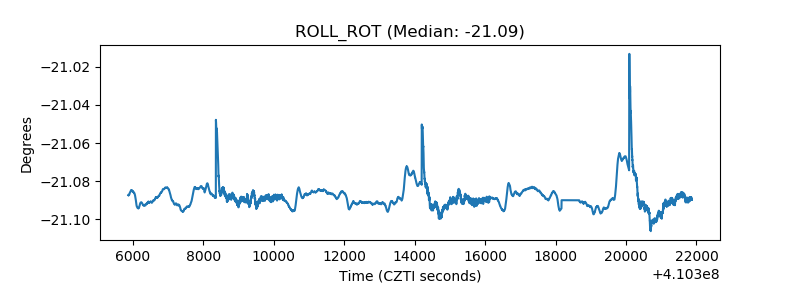 |
| _Roll_DEC | 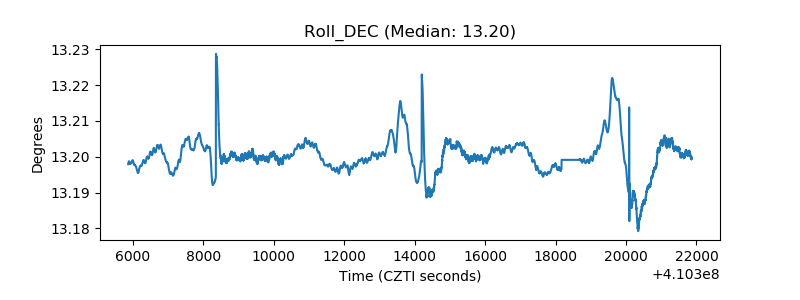 |
| _Roll_RA | 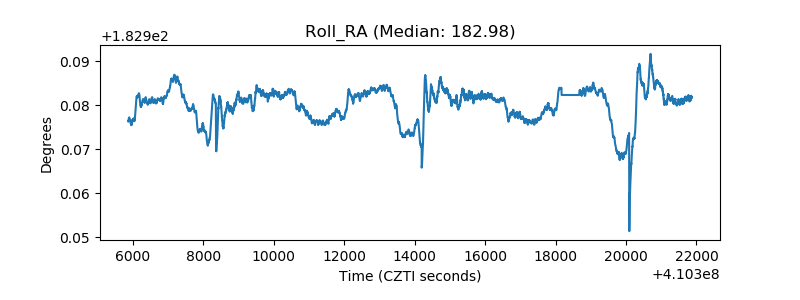 |
| Veto Counter | 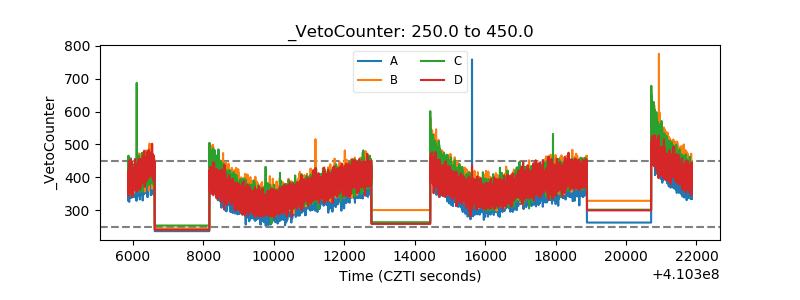 |