| Param | Original file | Final file |
|---|---|---|
| Filename | modeM0/AS1A12_037T01_9000005456_39271cztM0_level2.fits | modeM0/AS1A12_037T01_9000005456_39271cztM0_level2_quad_clean.evt |
| Size (bytes) | 537,281,280 | 90,285,120 |
| Size | 512.4 MB | 86.1 MB |
| Events in quadrant A | 5,710,377 | 558,517 |
| Events in quadrant B | 2,749,388 | 682,987 |
| Events in quadrant C | 2,645,083 | 643,265 |
| Events in quadrant D | 8,366,890 | 473,039 |
| Mode M0 | |||
|---|---|---|---|
| Quadrant | BADHDUFLAG | Total packets | Discarded packets |
| A | 0 | 20753 | 2 |
| B | 0 | 11440 | 1 |
| C | 0 | 10898 | 1 |
| D | 0 | 28589 | 1 |
| Mode SS | |||
|---|---|---|---|
| Quadrant | BADHDUFLAG | Total packets | Discarded packets |
| A | 0 | 108 | 0 |
| B | 0 | 108 | 0 |
| C | 0 | 108 | 0 |
| D | 0 | 108 | 0 |
| Mode M9 | |||
|---|---|---|---|
| Quadrant | BADHDUFLAG | Total packets | Discarded packets |
| A | 0 | 20 | 0 |
| B | 0 | 20 | 0 |
| C | 0 | 20 | 0 |
| D | 0 | 21 | 0 |
| Quadrant | Total seconds | Saturated seconds | Saturation percentage |
|---|---|---|---|
| A | 5376 | 886 | 16.480655% |
| B | 5376 | 15 | 0.279018% |
| C | 5376 | 6 | 0.111607% |
| D | 5376 | 1266 | 23.549107% |
Noise dominated data is calculated using 1-second bins in cleaned event files. If a bin has >2000 counts, and if more than 50% of those come from <1% of pixels, then it is considered to be noise-dominated and hence unusable.
| Quadrant | # 1 sec bins | Bins with >0 counts | Bins with >2000 counts | High rate bins dominated by noise | Noise dominated (total time) | Noise dominated (detector-on time) | Marked lightcurve |
|---|---|---|---|---|---|---|---|
| A | 7289 | 5377 | 719 | 719 | 9.86% | 13.37% | 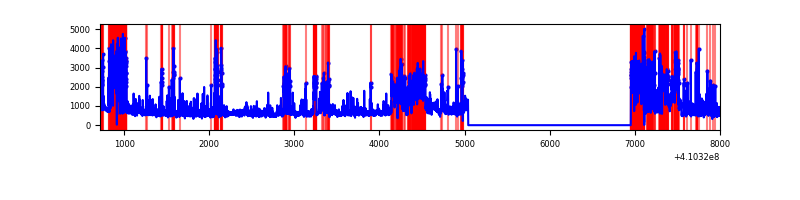 |
| B | 7289 | 5377 | 3 | 3 | 0.04% | 0.06% | 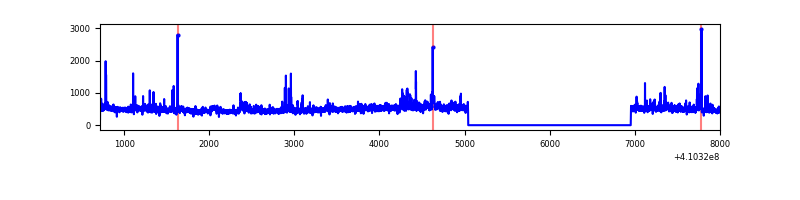 |
| C | 7289 | 5377 | 0 | 0 | 0.00% | 0.00% | 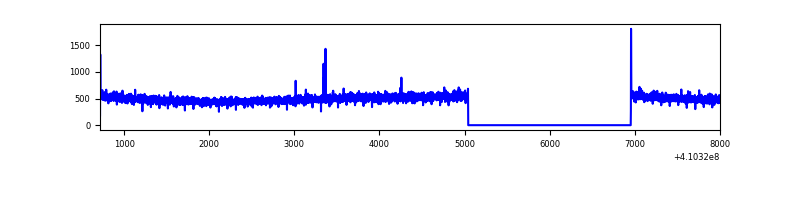 |
| D | 7289 | 5377 | 1186 | 1186 | 16.27% | 22.06% | 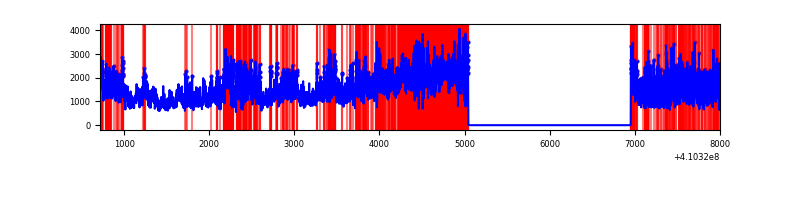 |
Top three noisy pixels from each quadrant. If the there are fewer than three noisy pixels in the level2.evt file, extra rows are filled as -1
| Pixel properties | Quadrant properties | ||||||
|---|---|---|---|---|---|---|---|
| Quadrant | DetID | PixID | Counts | Sigma | Mean | Median | Sigma |
| A | 15 | 222 | 3110322 | 26534.05 | 581 | 572 | 117.2 |
| A | 10 | 83 | 354404 | 3019.08 | 581 | 572 | 117.2 |
| A | 13 | 254 | 6141 | 47.52 | 581 | 572 | 117.2 |
| B | 0 | 190 | 175227 | 1456.09 | 625 | 608 | 119.9 |
| B | 5 | 172 | 45711 | 376.1 | 625 | 608 | 119.9 |
| B | 5 | 255 | 37753 | 309.74 | 625 | 608 | 119.9 |
| C | 15 | 214 | 245620 | 1741.71 | 610 | 615 | 140.7 |
| C | 0 | 10 | 7896 | 51.76 | 610 | 615 | 140.7 |
| C | 9 | 187 | 7030 | 45.6 | 610 | 615 | 140.7 |
| D | 12 | 235 | 6014236 | 44402.14 | 561 | 547 | 135.4 |
| D | 2 | 249 | 70658 | 517.67 | 561 | 547 | 135.4 |
| D | 6 | 1 | 25199 | 182.02 | 561 | 547 | 135.4 |
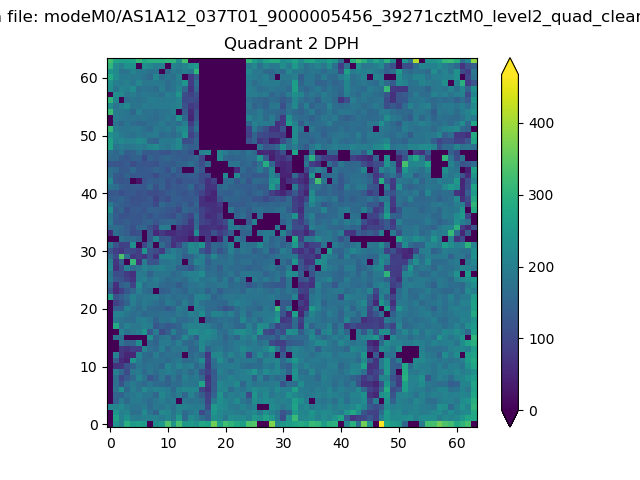
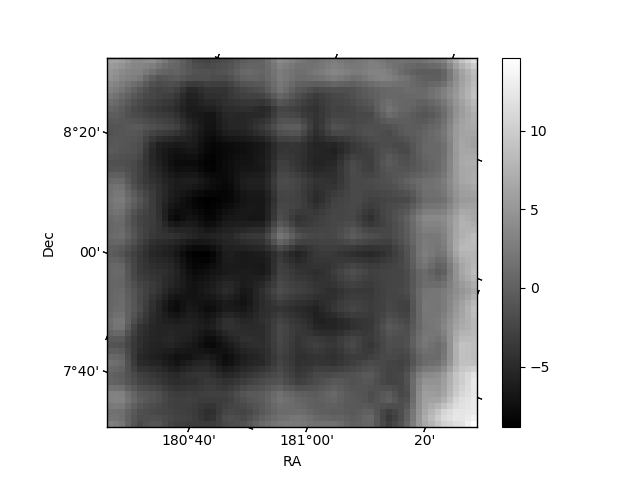
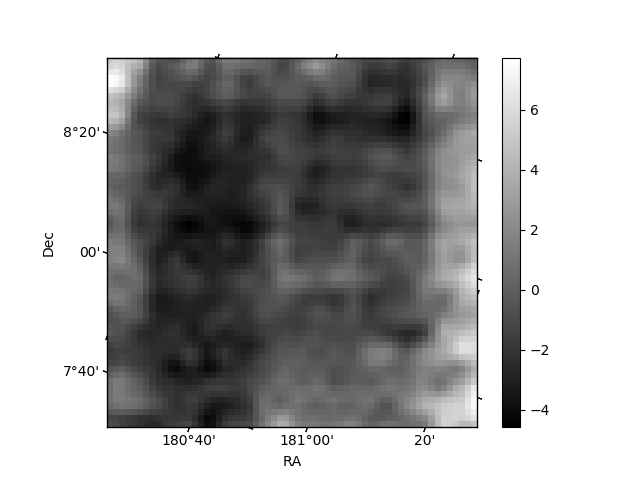
Histogram calculated using DETX and DETY for each event in the final _common_clean file
| Quadrant A | 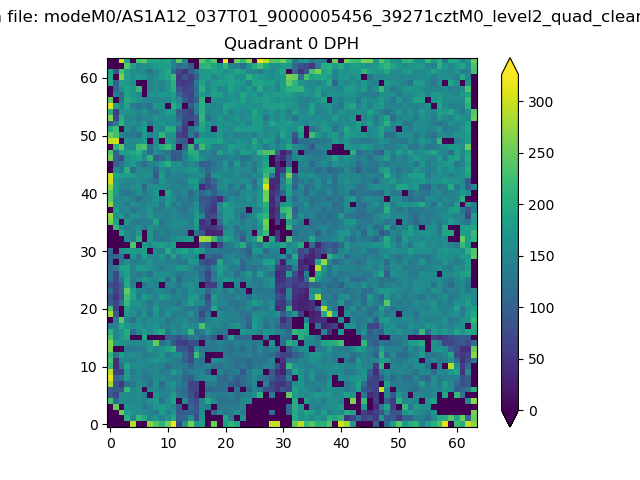 |
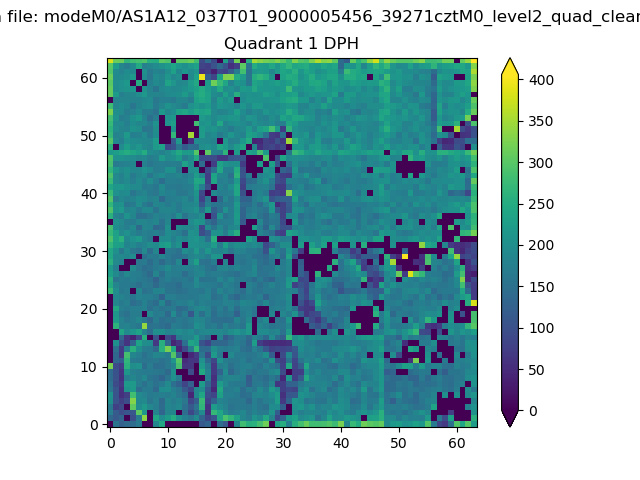 |
Quadrant B |
|---|---|---|---|
| Quadrant D | 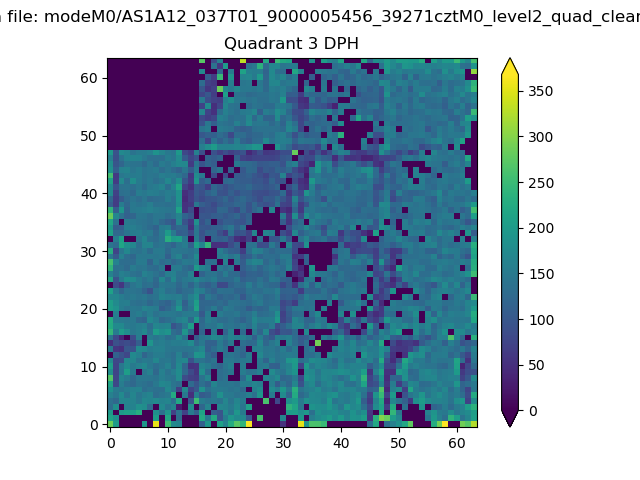 |
 |
Quadrant C |
| Plot type | Count rate plots | Images |
|---|---|---|
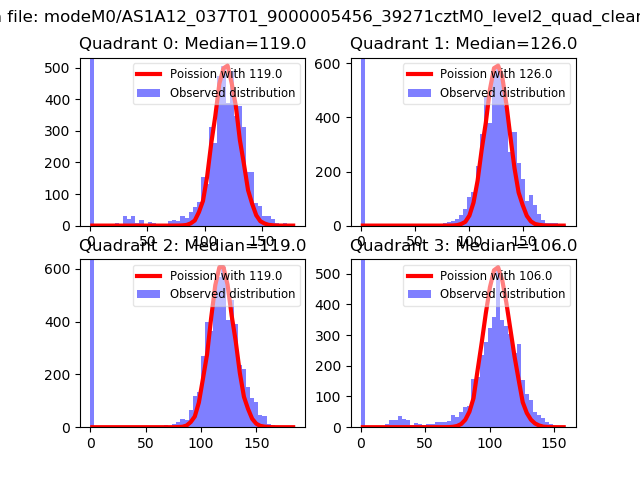
| Comparison with Poisson distribution Blue bars denote a histogram of data divided into 1 sec bins. Red curve is a Poisson curve with rate = median count rate of data. |
 |
 |
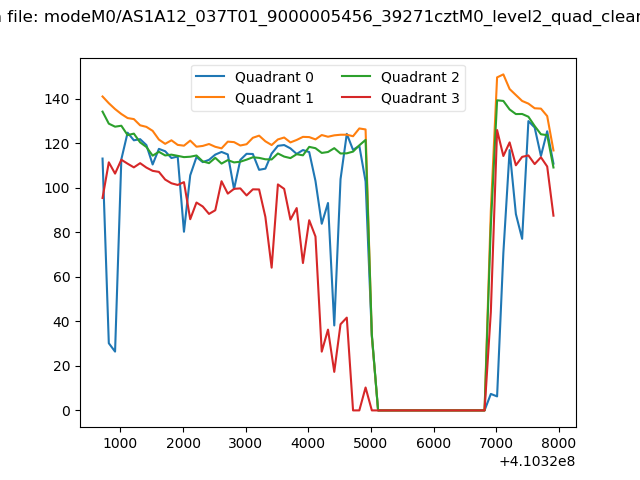
| Quadrant-wise count rates Data is divided into 100 sec bins |
 |
|
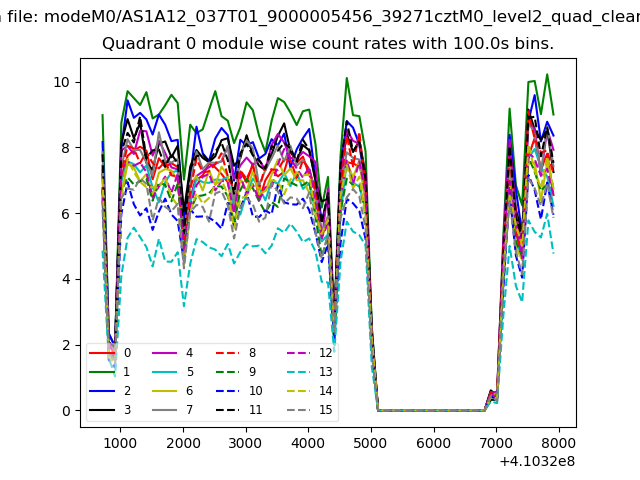
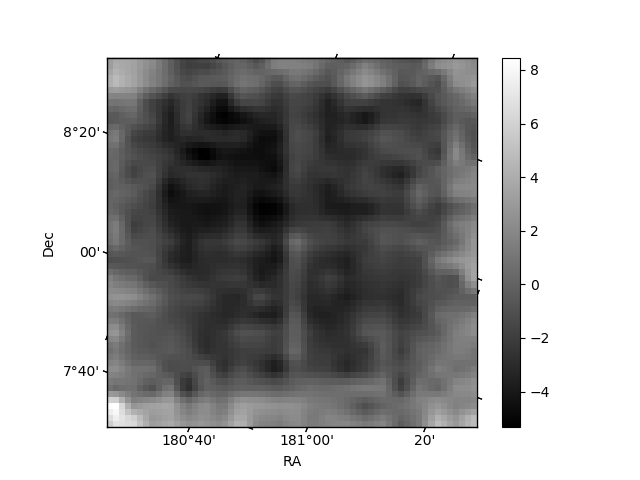
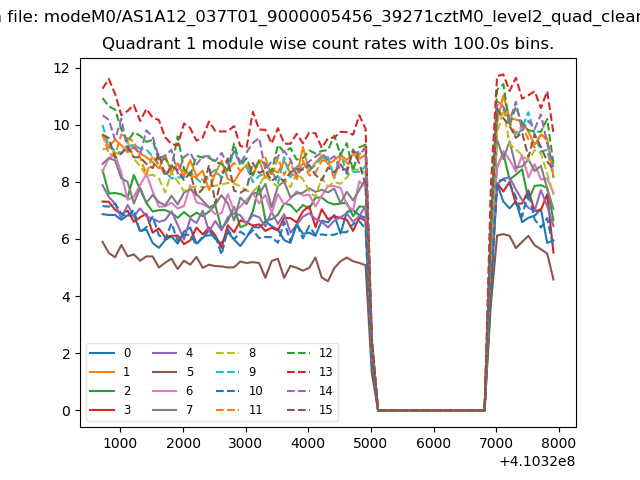
| Module-wise count rates for Quadrant A Data is divided into 100 sec bins |
 |
 |
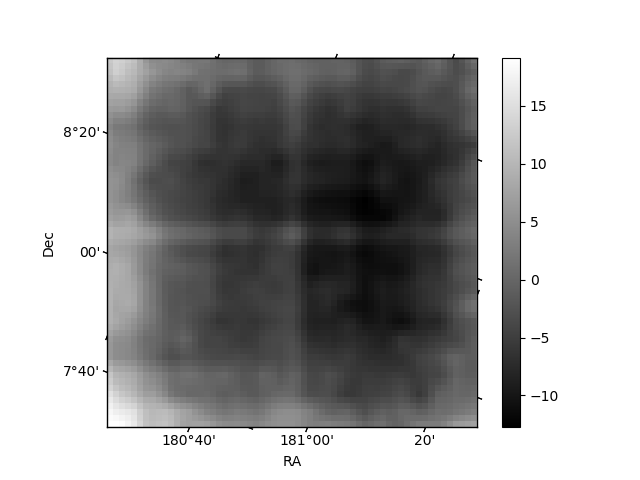
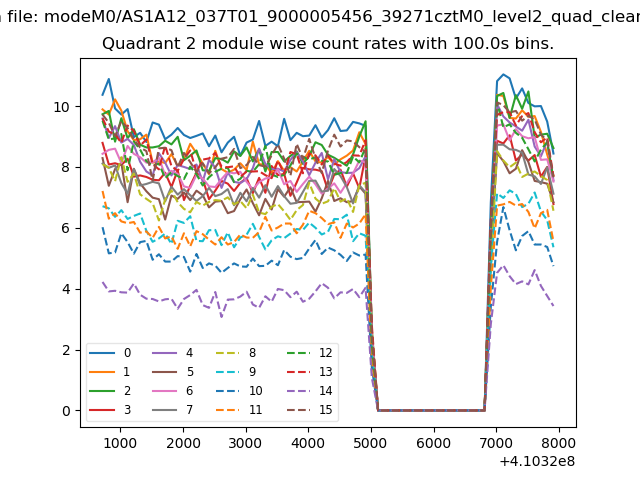
| Module-wise count rates for Quadrant B Data is divided into 100 sec bins |
 |
 |
| Module-wise count rates for Quadrant C Data is divided into 100 sec bins |
 |
 |
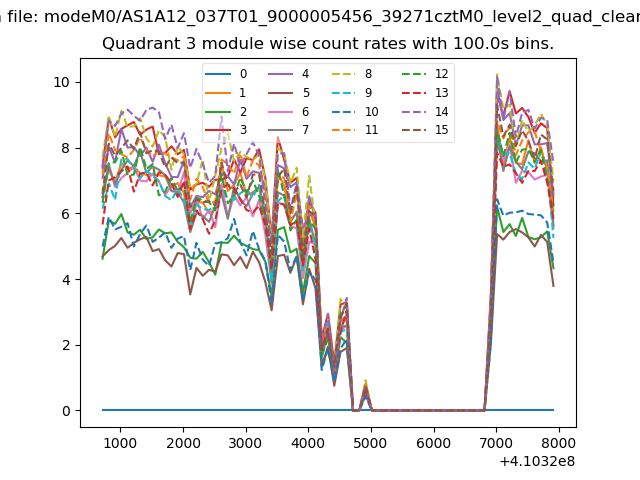
| Module-wise count rates for Quadrant D Data is divided into 100 sec bins |
 |
 |
| Parameter | Plot |
|---|---|
| CZT HV Monitor | 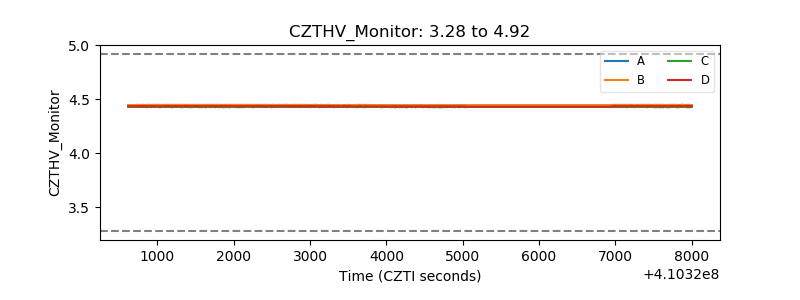 |
| D_VDD | 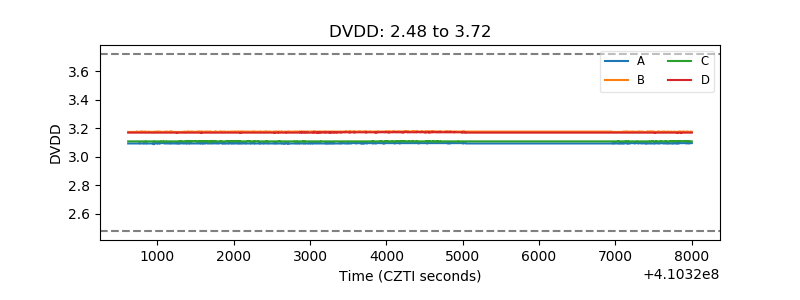 |
| Temperature 1 | 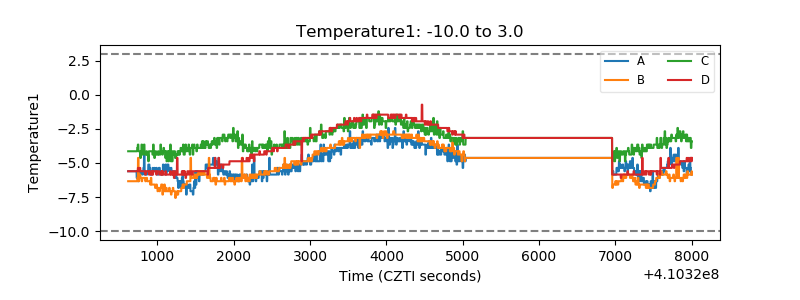 |
| Veto HV Monitor | 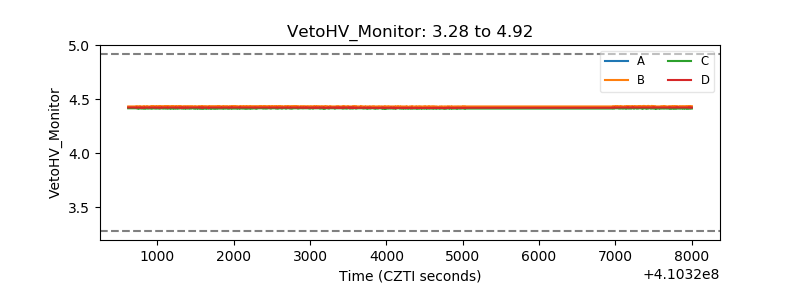 |
| Veto LLD | 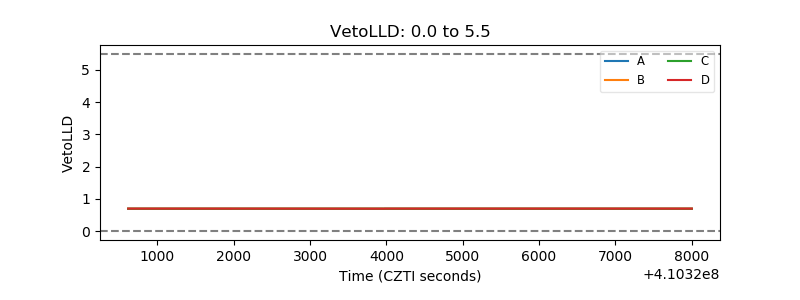 |
| Alpha Counter | 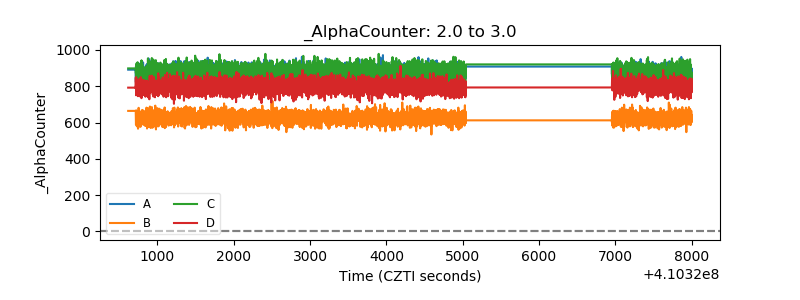 |
| _CPM_Rate | 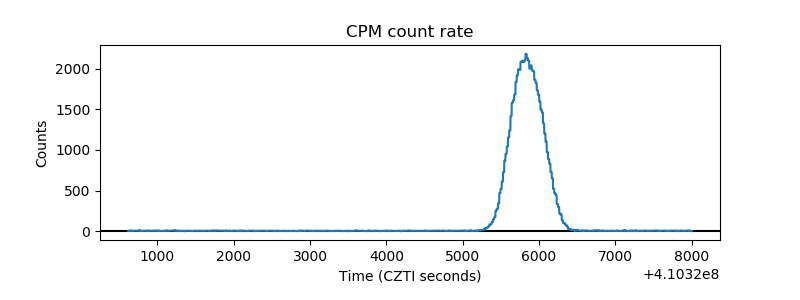 |
| CZT Counter | 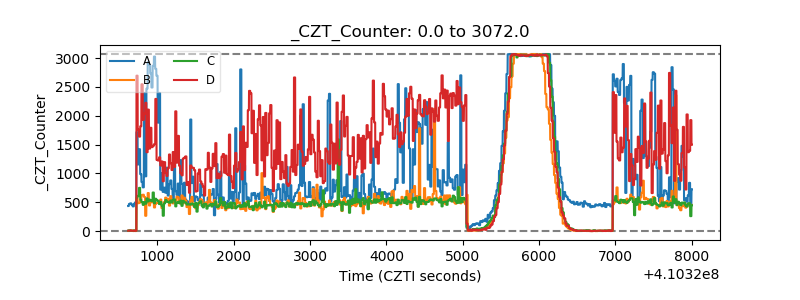 |
| +2.5 Volts monitor |  |
| +5 Volts monitor | 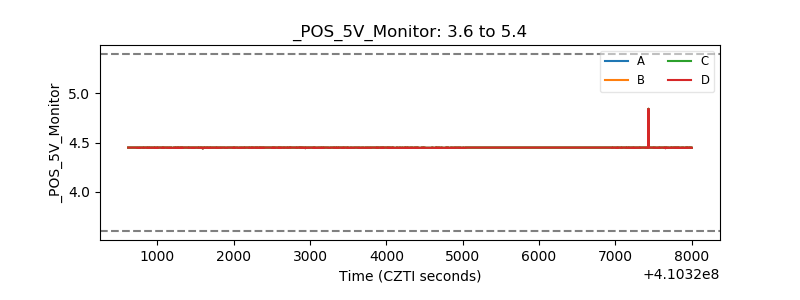 |
| _ROLL_ROT | 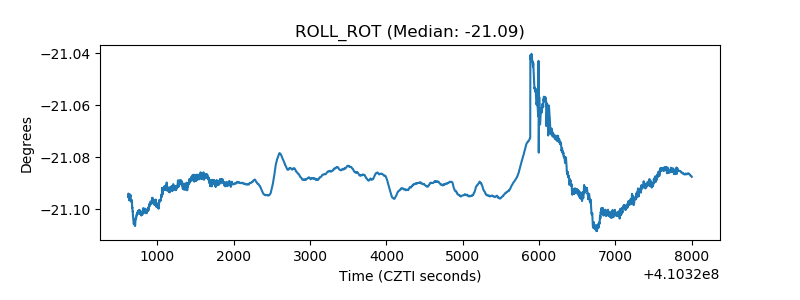 |
| _Roll_DEC |  |
| _Roll_RA | 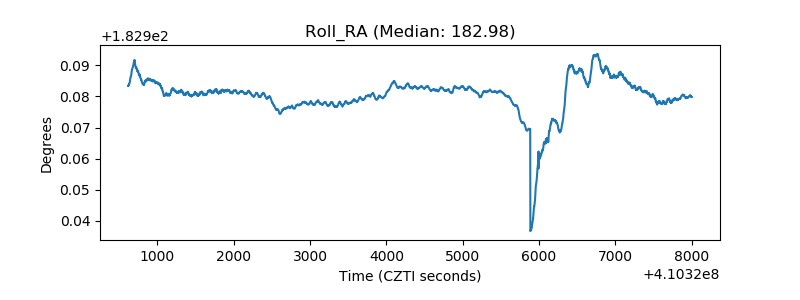 |
| Veto Counter | 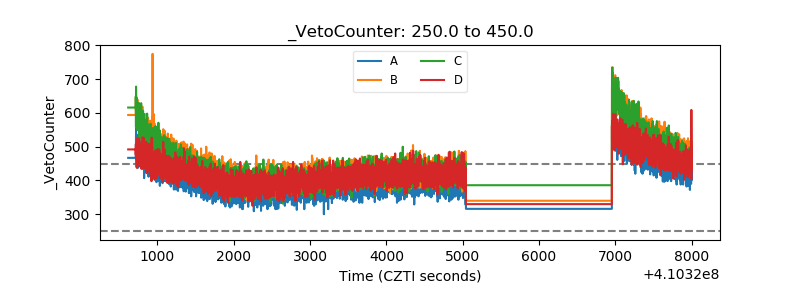 |