| Param | Original file | Final file |
|---|---|---|
| Filename | modeM0/AS1A12_037T01_9000005456_39272cztM0_level2.fits | modeM0/AS1A12_037T01_9000005456_39272cztM0_level2_quad_clean.evt |
| Size (bytes) | 552,130,560 | 87,952,320 |
| Size | 526.6 MB | 83.9 MB |
| Events in quadrant A | 5,410,950 | 569,823 |
| Events in quadrant B | 2,807,268 | 691,957 |
| Events in quadrant C | 2,658,055 | 652,157 |
| Events in quadrant D | 9,155,589 | 382,836 |
| Mode M0 | |||
|---|---|---|---|
| Quadrant | BADHDUFLAG | Total packets | Discarded packets |
| A | 0 | 19446 | 3 |
| B | 0 | 11526 | 2 |
| C | 0 | 10689 | 2 |
| D | 0 | 30837 | 2 |
| Mode SS | |||
|---|---|---|---|
| Quadrant | BADHDUFLAG | Total packets | Discarded packets |
| A | 0 | 106 | 0 |
| B | 0 | 106 | 0 |
| C | 0 | 106 | 0 |
| D | 0 | 106 | 0 |
| Mode M9 | |||
|---|---|---|---|
| Quadrant | BADHDUFLAG | Total packets | Discarded packets |
| A | 0 | 21 | 0 |
| B | 0 | 21 | 0 |
| C | 0 | 21 | 0 |
| D | 0 | 22 | 0 |
| Quadrant | Total seconds | Saturated seconds | Saturation percentage |
|---|---|---|---|
| A | 5232 | 835 | 15.959480% |
| B | 5232 | 53 | 1.012997% |
| C | 5232 | 5 | 0.095566% |
| D | 5232 | 2221 | 42.450306% |
Noise dominated data is calculated using 1-second bins in cleaned event files. If a bin has >2000 counts, and if more than 50% of those come from <1% of pixels, then it is considered to be noise-dominated and hence unusable.
| Quadrant | # 1 sec bins | Bins with >0 counts | Bins with >2000 counts | High rate bins dominated by noise | Noise dominated (total time) | Noise dominated (detector-on time) | Marked lightcurve |
|---|---|---|---|---|---|---|---|
| A | 7263 | 5233 | 753 | 753 | 10.37% | 14.39% | 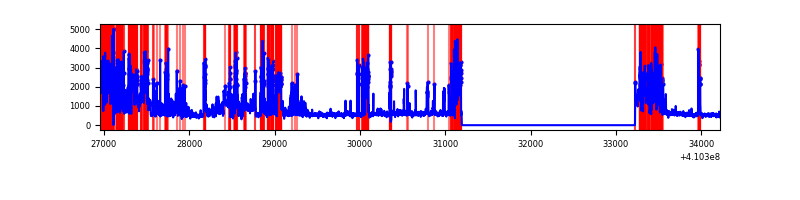 |
| B | 7263 | 5233 | 36 | 36 | 0.50% | 0.69% | 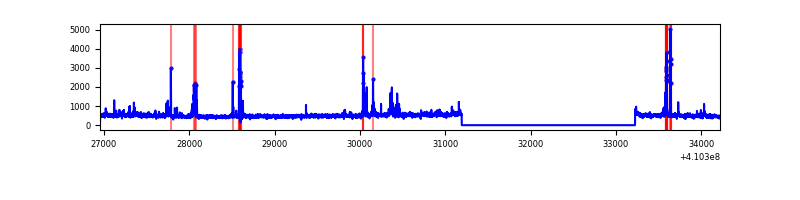 |
| C | 7263 | 5233 | 0 | 0 | 0.00% | 0.00% | 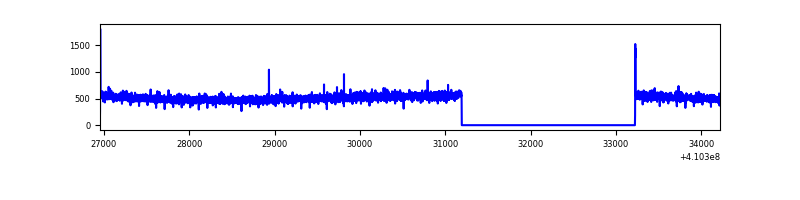 |
| D | 7263 | 5233 | 1795 | 1795 | 24.71% | 34.30% | 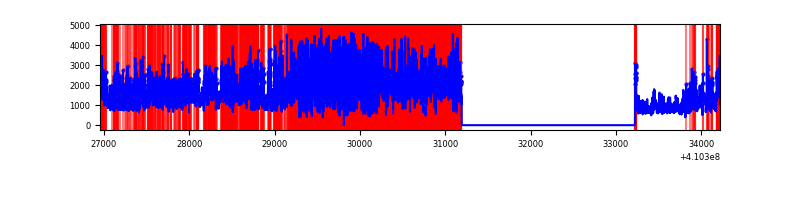 |
Top three noisy pixels from each quadrant. If the there are fewer than three noisy pixels in the level2.evt file, extra rows are filled as -1
| Pixel properties | Quadrant properties | ||||||
|---|---|---|---|---|---|---|---|
| Quadrant | DetID | PixID | Counts | Sigma | Mean | Median | Sigma |
| A | 15 | 222 | 2765495 | 23366.61 | 588 | 579 | 118.3 |
| A | 10 | 83 | 369767 | 3120.05 | 588 | 579 | 118.3 |
| A | 13 | 254 | 6092 | 46.59 | 588 | 579 | 118.3 |
| B | 5 | 172 | 207028 | 1746.22 | 625 | 609 | 118.2 |
| B | 0 | 190 | 86343 | 725.27 | 625 | 609 | 118.2 |
| B | 5 | 255 | 45149 | 376.79 | 625 | 609 | 118.2 |
| C | 15 | 214 | 239497 | 1649.8 | 617 | 621 | 144.8 |
| C | 0 | 10 | 7854 | 49.95 | 617 | 621 | 144.8 |
| C | 13 | 61 | 4148 | 24.36 | 617 | 621 | 144.8 |
| D | 12 | 235 | 6948117 | 57575.05 | 502 | 490 | 120.7 |
| D | 2 | 249 | 177316 | 1465.36 | 502 | 490 | 120.7 |
| D | 12 | 227 | 44033 | 360.84 | 502 | 490 | 120.7 |
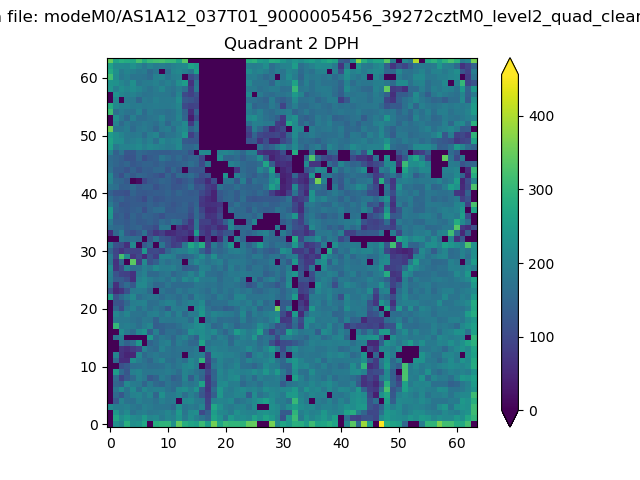
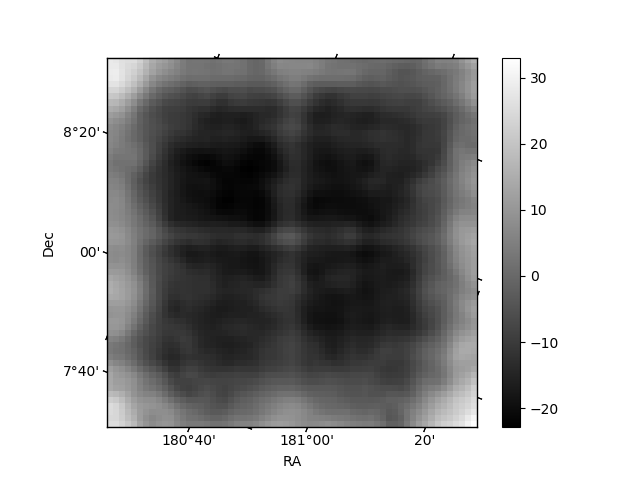
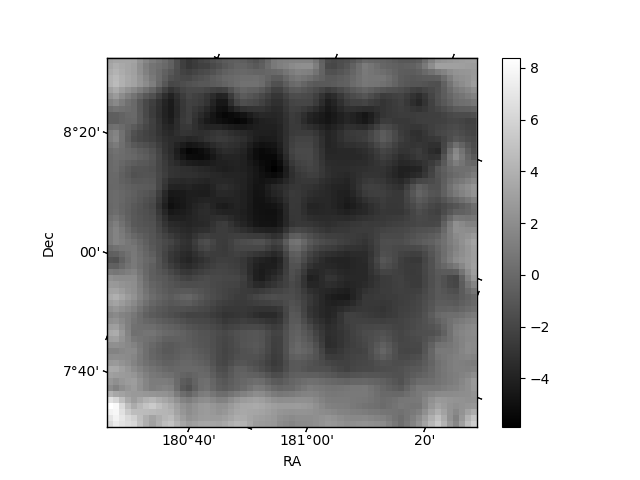
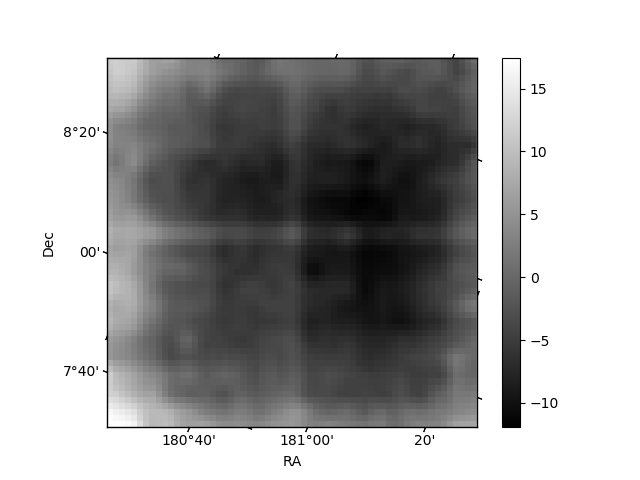
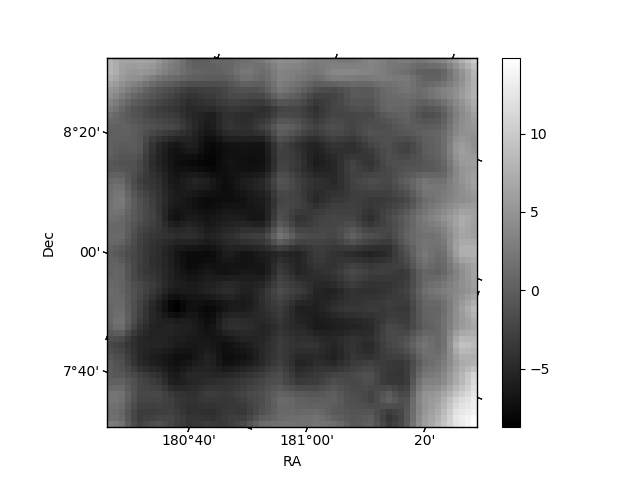
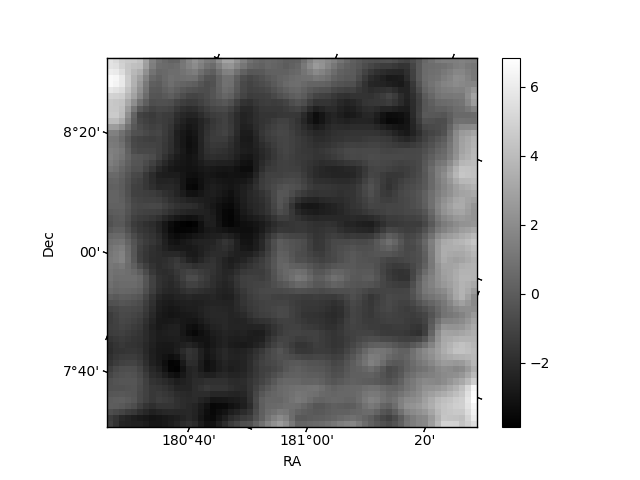
Histogram calculated using DETX and DETY for each event in the final _common_clean file
| Quadrant A | 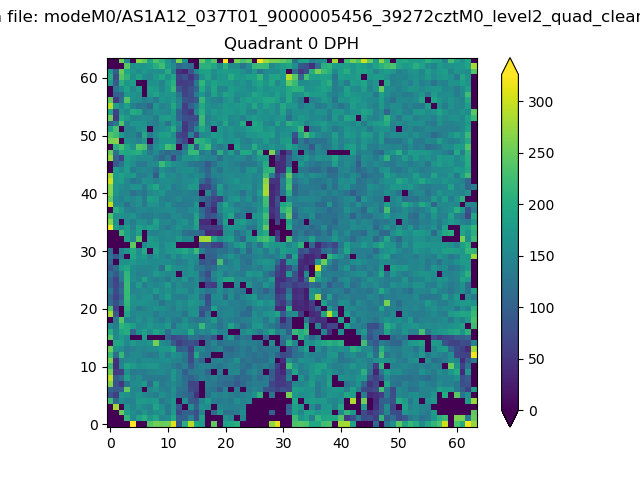 |
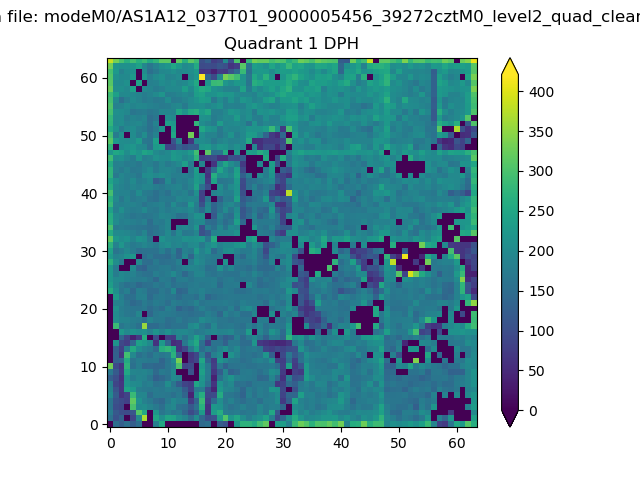 |
Quadrant B |
|---|---|---|---|
| Quadrant D | 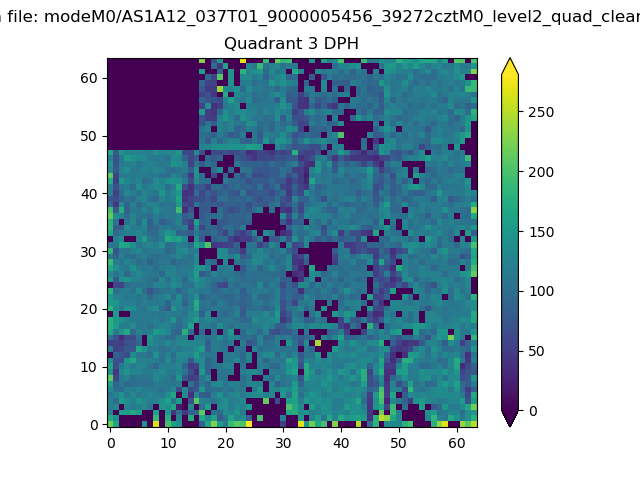 |
 |
Quadrant C |
| Plot type | Count rate plots | Images |
|---|---|---|
| Comparison with Poisson distribution Blue bars denote a histogram of data divided into 1 sec bins. Red curve is a Poisson curve with rate = median count rate of data. |
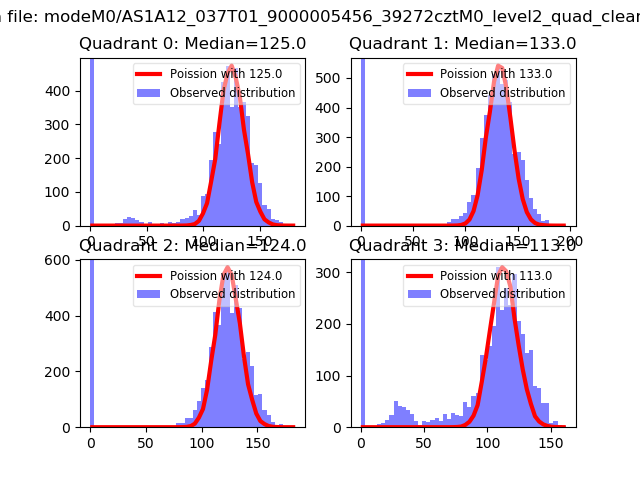 |
 |
| Quadrant-wise count rates Data is divided into 100 sec bins |
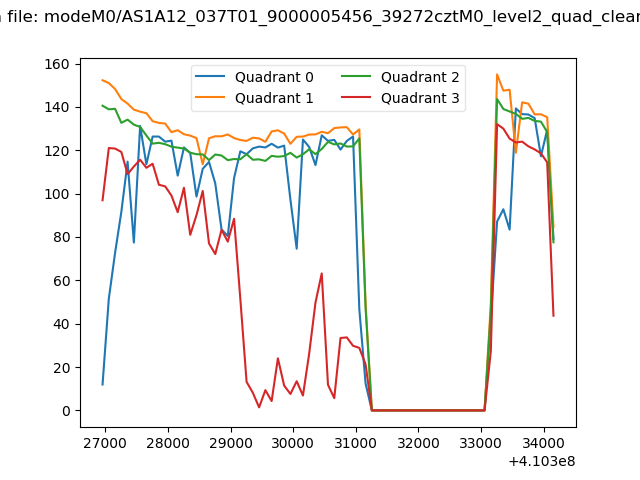 |
|
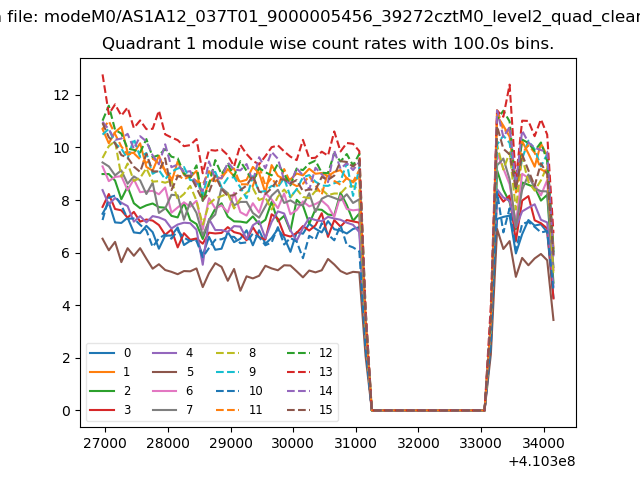
| Module-wise count rates for Quadrant A Data is divided into 100 sec bins |
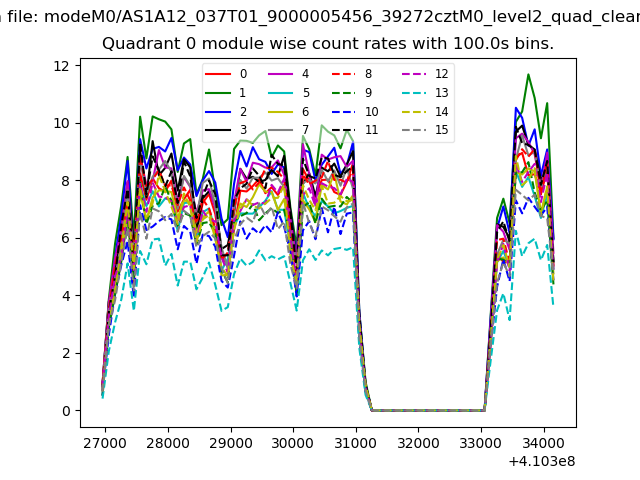 |
 |
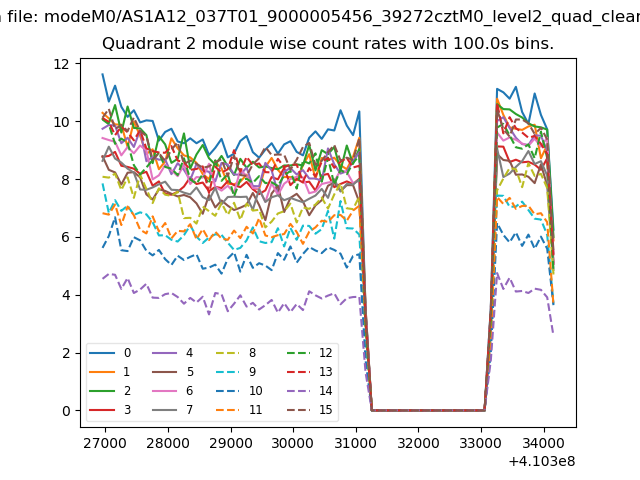
| Module-wise count rates for Quadrant B Data is divided into 100 sec bins |
 |
 |
| Module-wise count rates for Quadrant C Data is divided into 100 sec bins |
 |
 |
| Module-wise count rates for Quadrant D Data is divided into 100 sec bins |
 |
 |
| Parameter | Plot |
|---|---|
| CZT HV Monitor | 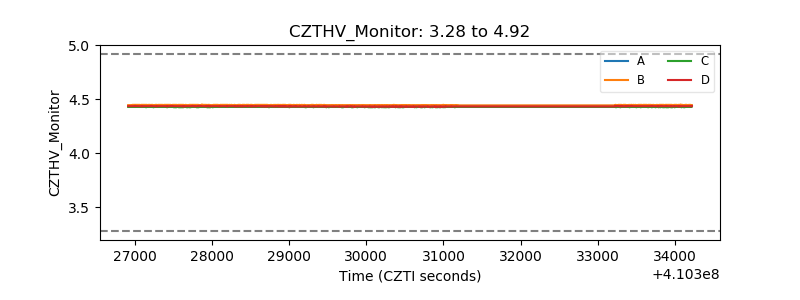 |
| D_VDD | 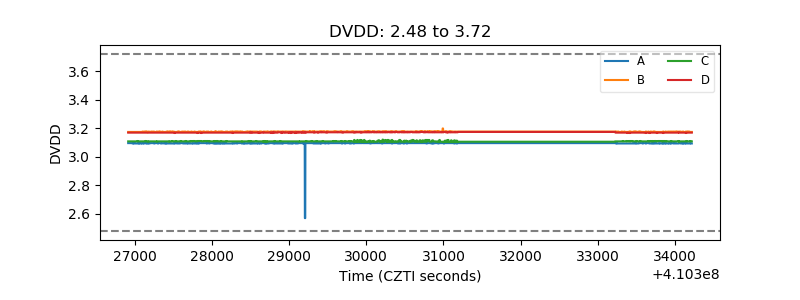 |
| Temperature 1 | 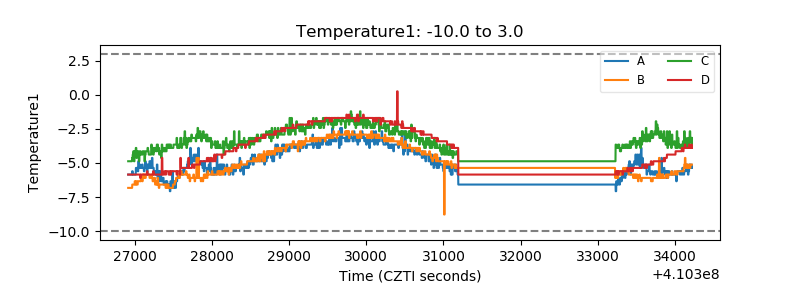 |
| Veto HV Monitor | 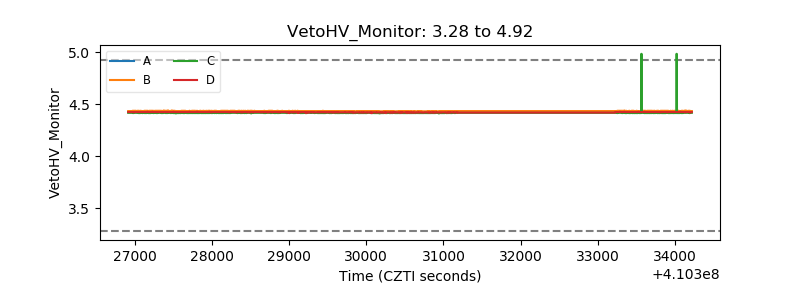 |
| Veto LLD | 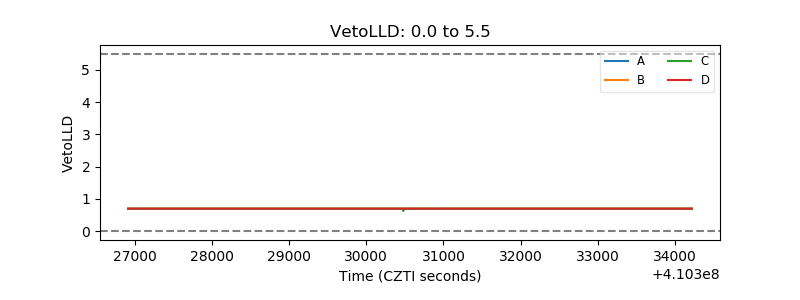 |
| Alpha Counter | 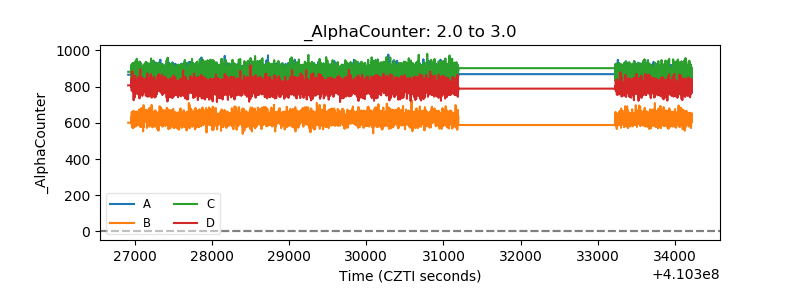 |
| _CPM_Rate | 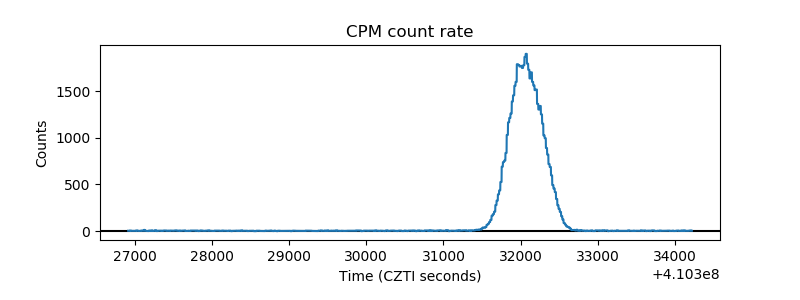 |
| CZT Counter | 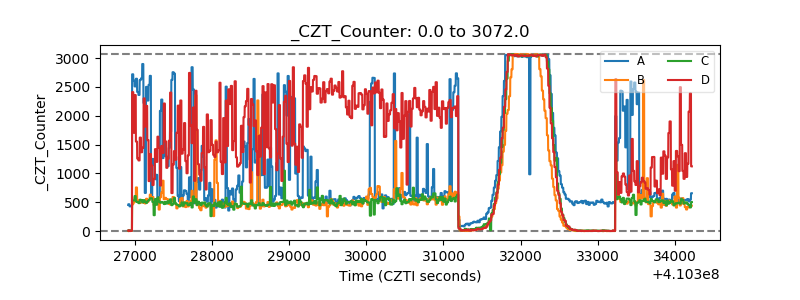 |
| +2.5 Volts monitor | 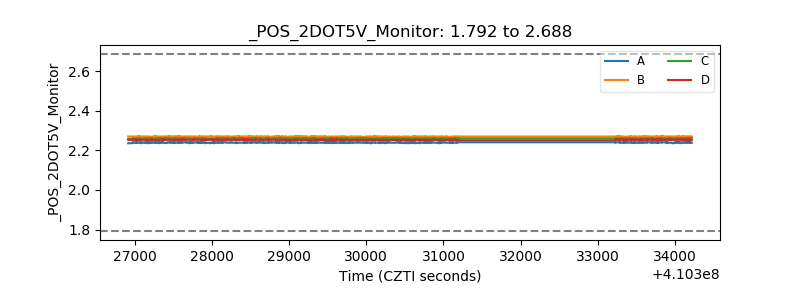 |
| +5 Volts monitor | 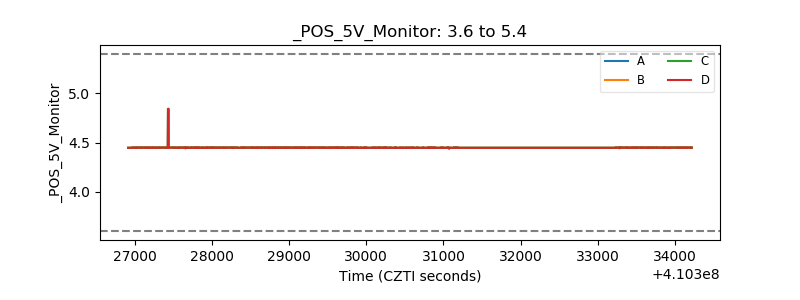 |
| _ROLL_ROT | 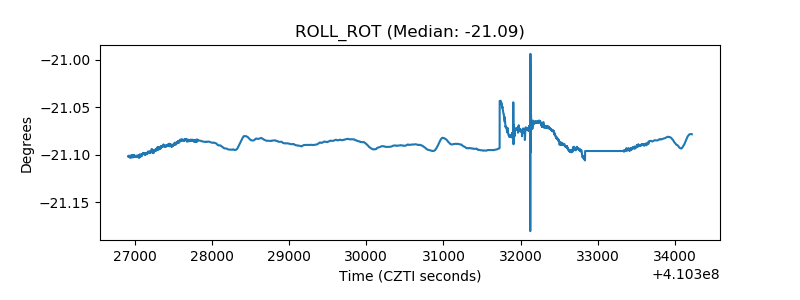 |
| _Roll_DEC | 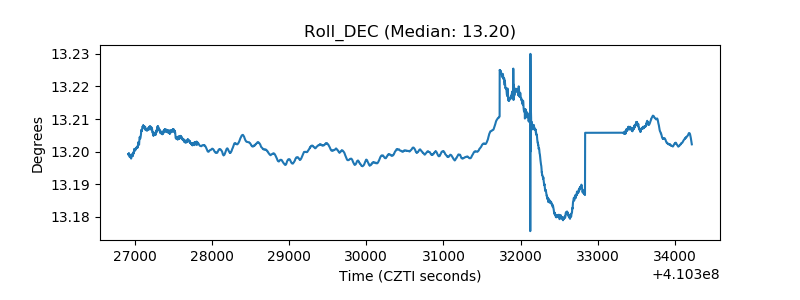 |
| _Roll_RA | 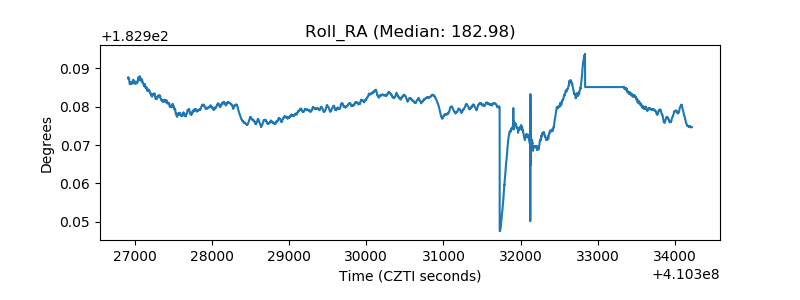 |
| Veto Counter | 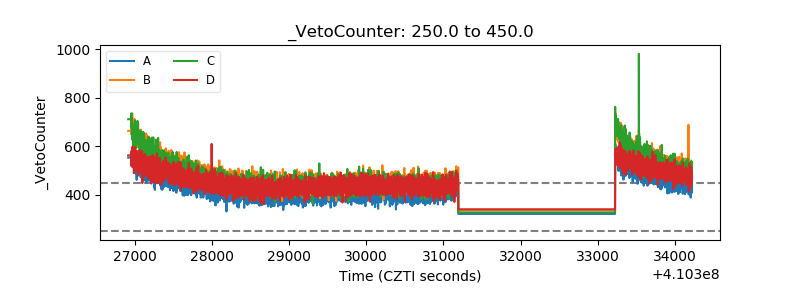 |