| Param | Original file | Final file |
|---|---|---|
| Filename | modeM0/AS1A12_037T01_9000005456_39273cztM0_level2.fits | modeM0/AS1A12_037T01_9000005456_39273cztM0_level2_quad_clean.evt |
| Size (bytes) | 544,317,120 | 82,045,440 |
| Size | 519.1 MB | 78.2 MB |
| Events in quadrant A | 5,636,339 | 556,476 |
| Events in quadrant B | 2,624,944 | 656,899 |
| Events in quadrant C | 2,555,177 | 622,515 |
| Events in quadrant D | 8,947,670 | 301,526 |
| Mode M0 | |||
|---|---|---|---|
| Quadrant | BADHDUFLAG | Total packets | Discarded packets |
| A | 0 | 20087 | 3 |
| B | 0 | 10682 | 1 |
| C | 0 | 10218 | 1 |
| D | 0 | 30049 | 1 |
| Mode SS | |||
|---|---|---|---|
| Quadrant | BADHDUFLAG | Total packets | Discarded packets |
| A | 0 | 100 | 0 |
| B | 0 | 100 | 0 |
| C | 0 | 100 | 0 |
| D | 0 | 100 | 0 |
| Mode M9 | |||
|---|---|---|---|
| Quadrant | BADHDUFLAG | Total packets | Discarded packets |
| A | 0 | 21 | 0 |
| B | 0 | 21 | 0 |
| C | 0 | 21 | 0 |
| D | 0 | 21 | 0 |
| Quadrant | Total seconds | Saturated seconds | Saturation percentage |
|---|---|---|---|
| A | 4953 | 797 | 16.091258% |
| B | 4953 | 31 | 0.625883% |
| C | 4953 | 3 | 0.060569% |
| D | 4953 | 2613 | 52.755906% |
Noise dominated data is calculated using 1-second bins in cleaned event files. If a bin has >2000 counts, and if more than 50% of those come from <1% of pixels, then it is considered to be noise-dominated and hence unusable.
| Quadrant | # 1 sec bins | Bins with >0 counts | Bins with >2000 counts | High rate bins dominated by noise | Noise dominated (total time) | Noise dominated (detector-on time) | Marked lightcurve |
|---|---|---|---|---|---|---|---|
| A | 7047 | 4955 | 689 | 689 | 9.78% | 13.91% | 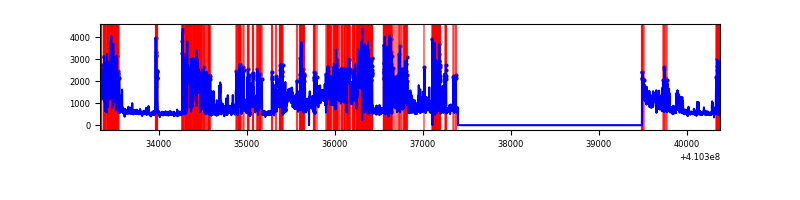 |
| B | 7047 | 4955 | 17 | 17 | 0.24% | 0.34% | 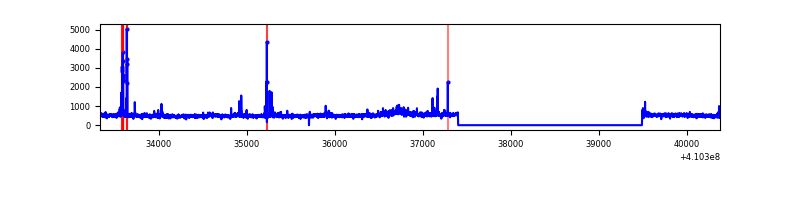 |
| C | 7047 | 4955 | 0 | 0 | 0.00% | 0.00% | 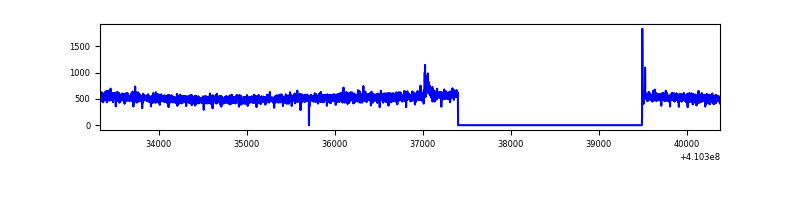 |
| D | 7047 | 4955 | 2314 | 2314 | 32.84% | 46.70% | 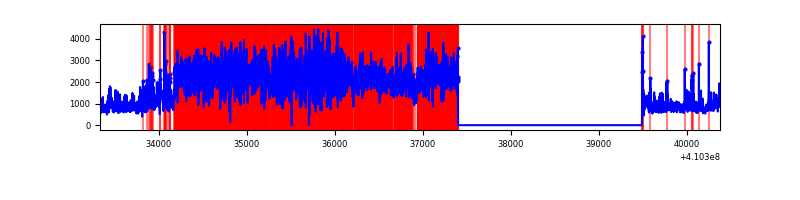 |
Top three noisy pixels from each quadrant. If the there are fewer than three noisy pixels in the level2.evt file, extra rows are filled as -1
| Pixel properties | Quadrant properties | ||||||
|---|---|---|---|---|---|---|---|
| Quadrant | DetID | PixID | Counts | Sigma | Mean | Median | Sigma |
| A | 15 | 222 | 3069862 | 26451.51 | 572 | 561 | 116.0 |
| A | 10 | 83 | 345976 | 2976.82 | 572 | 561 | 116.0 |
| A | 12 | 16 | 8523 | 68.62 | 572 | 561 | 116.0 |
| B | 0 | 190 | 133253 | 1160.54 | 599 | 584 | 114.3 |
| B | 5 | 172 | 107445 | 934.78 | 599 | 584 | 114.3 |
| B | 5 | 255 | 22393 | 190.78 | 599 | 584 | 114.3 |
| C | 15 | 214 | 224949 | 1624.6 | 592 | 597 | 138.1 |
| C | 9 | 187 | 15581 | 108.5 | 592 | 597 | 138.1 |
| C | 0 | 10 | 5844 | 37.99 | 592 | 597 | 138.1 |
| D | 12 | 235 | 6680721 | 58088.81 | 472 | 460 | 115.0 |
| D | 12 | 227 | 214718 | 1863.1 | 472 | 460 | 115.0 |
| D | 1 | 47 | 70107 | 605.62 | 472 | 460 | 115.0 |
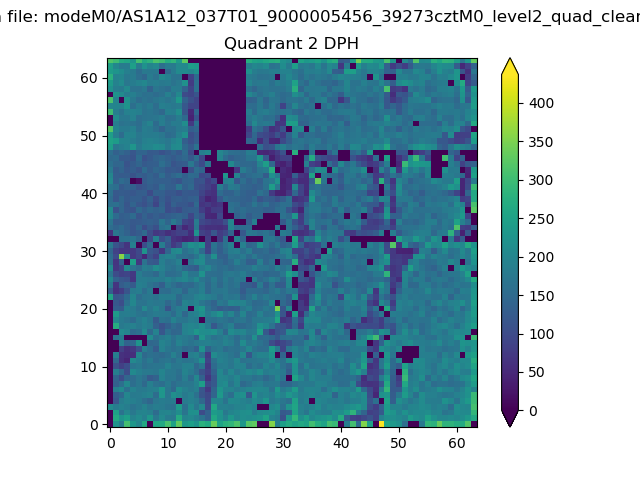
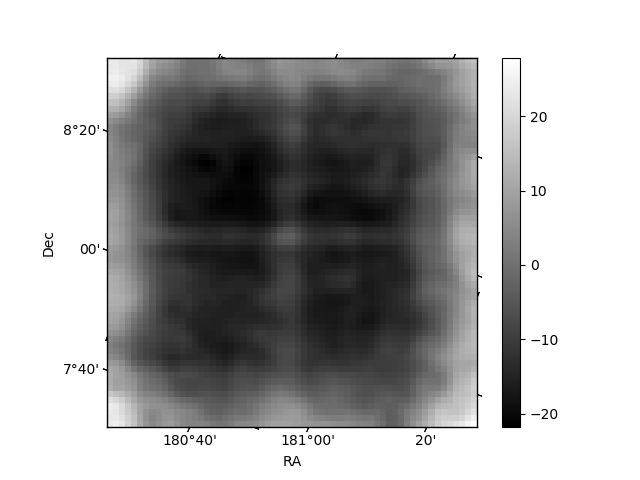
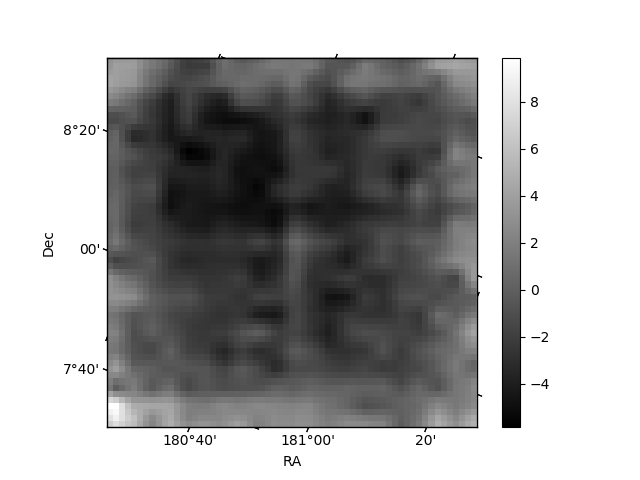
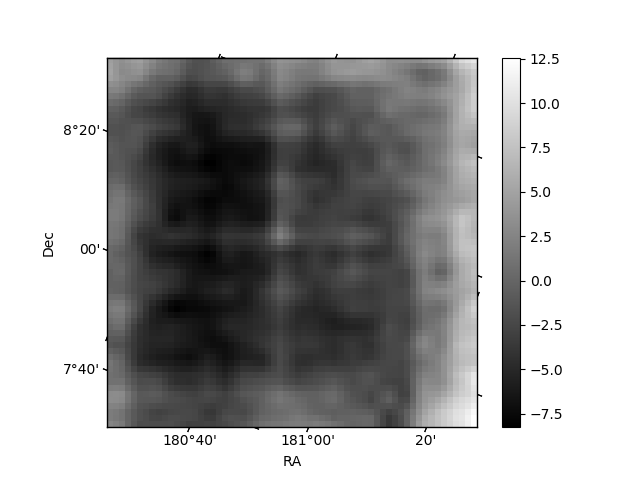
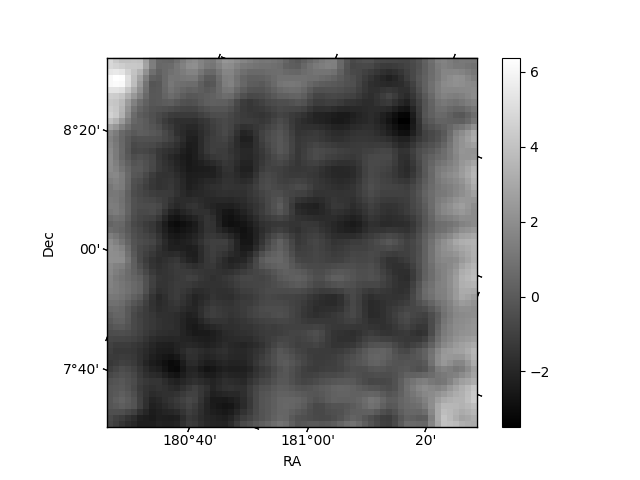
Histogram calculated using DETX and DETY for each event in the final _common_clean file
| Quadrant A | 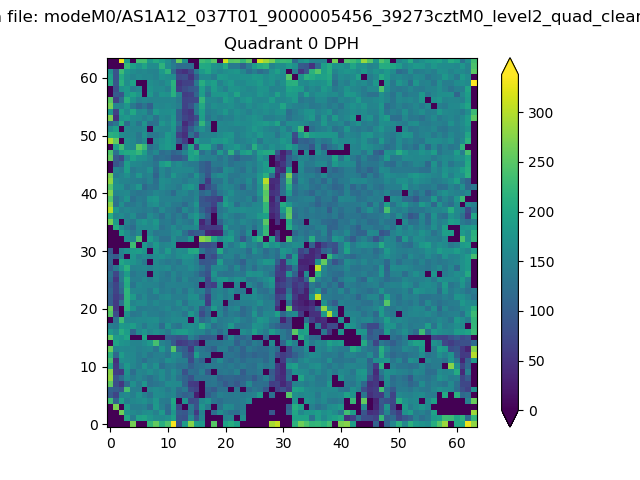 |
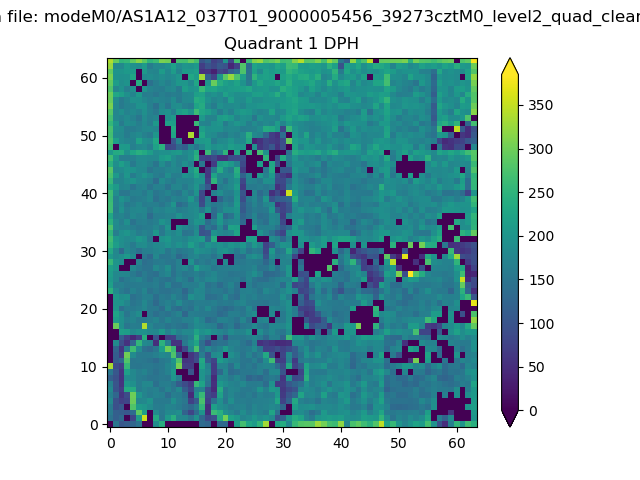 |
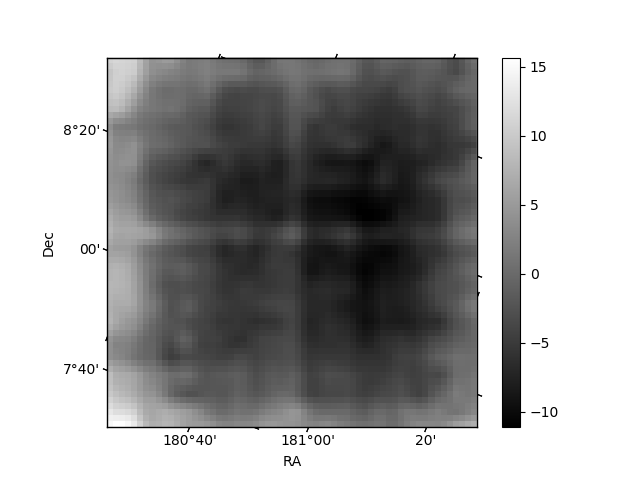
Quadrant B |
|---|---|---|---|
| Quadrant D | 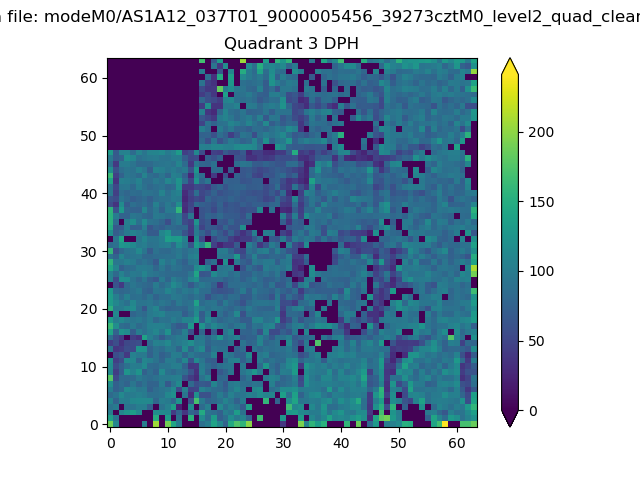 |
 |
Quadrant C |
| Plot type | Count rate plots | Images |
|---|---|---|
| Comparison with Poisson distribution Blue bars denote a histogram of data divided into 1 sec bins. Red curve is a Poisson curve with rate = median count rate of data. |
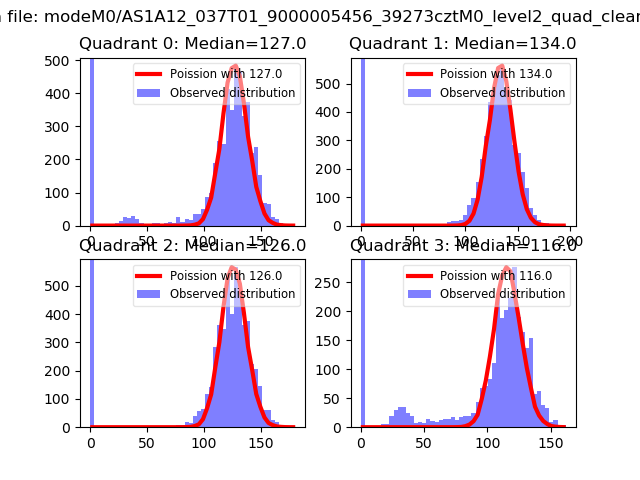 |
 |
| Quadrant-wise count rates Data is divided into 100 sec bins |
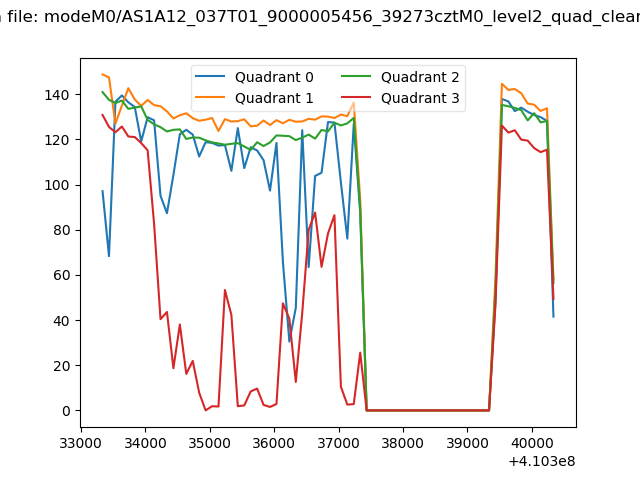 |
|
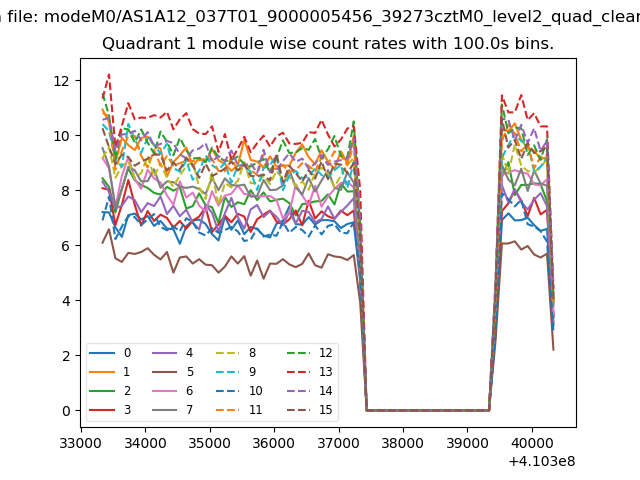
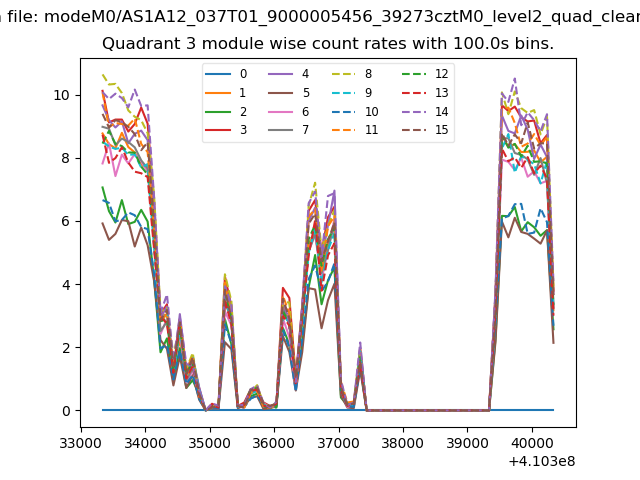
| Module-wise count rates for Quadrant A Data is divided into 100 sec bins |
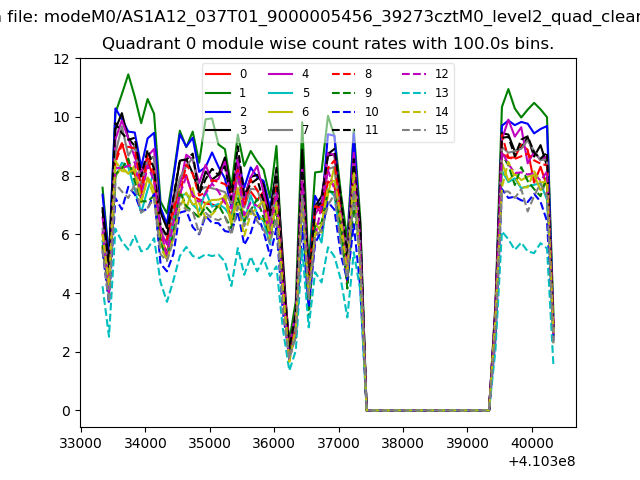 |
 |
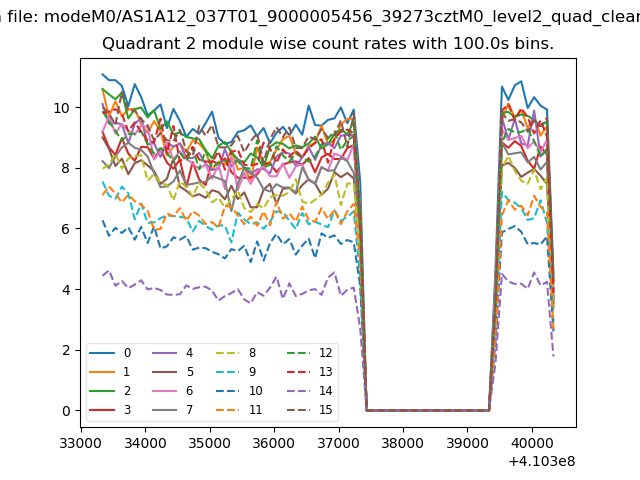
| Module-wise count rates for Quadrant B Data is divided into 100 sec bins |
 |
 |
| Module-wise count rates for Quadrant C Data is divided into 100 sec bins |
 |
 |
| Module-wise count rates for Quadrant D Data is divided into 100 sec bins |
 |
 |
| Parameter | Plot |
|---|---|
| CZT HV Monitor | 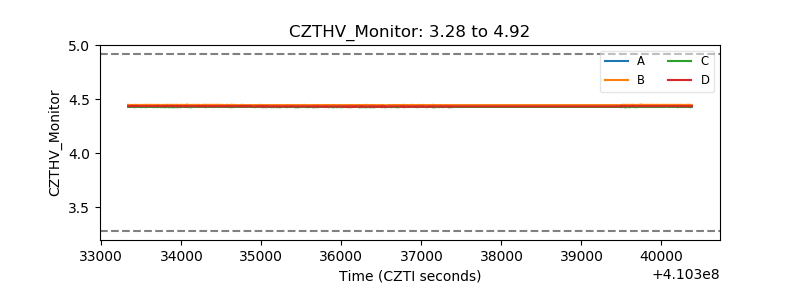 |
| D_VDD |  |
| Temperature 1 | 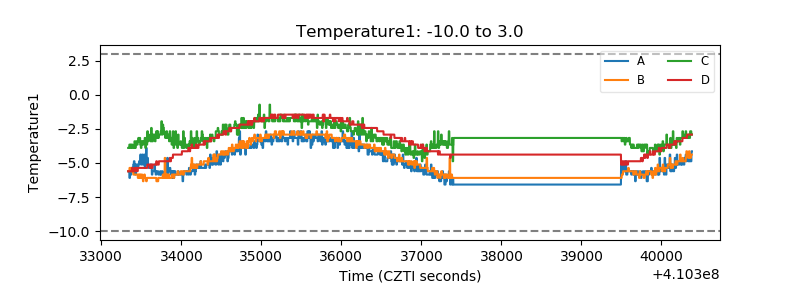 |
| Veto HV Monitor | 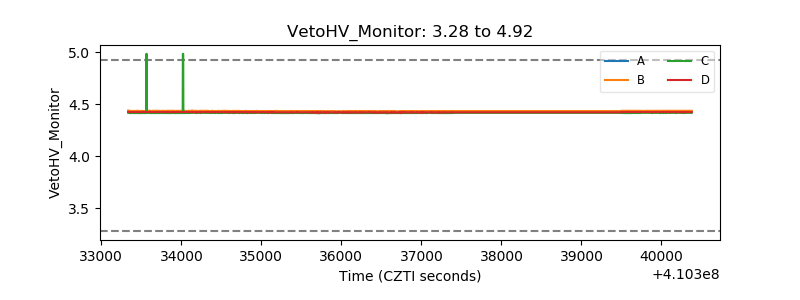 |
| Veto LLD | 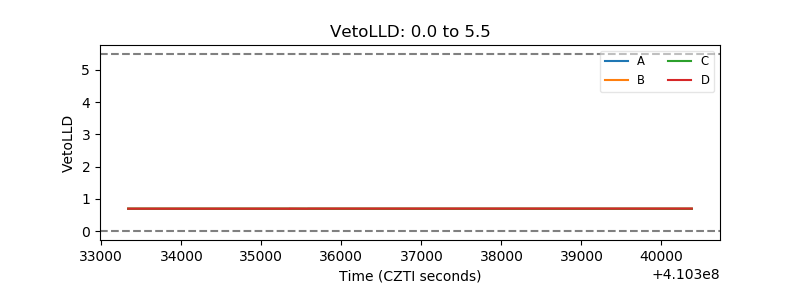 |
| Alpha Counter | 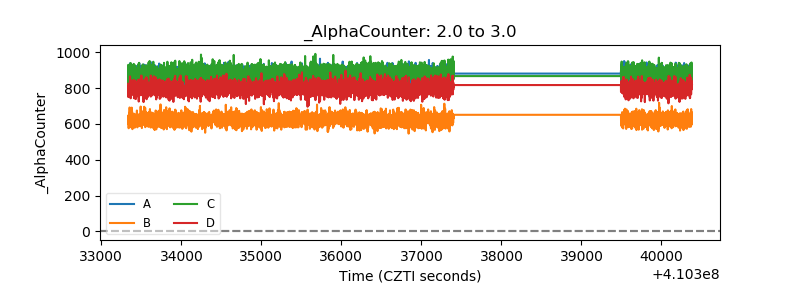 |
| _CPM_Rate | 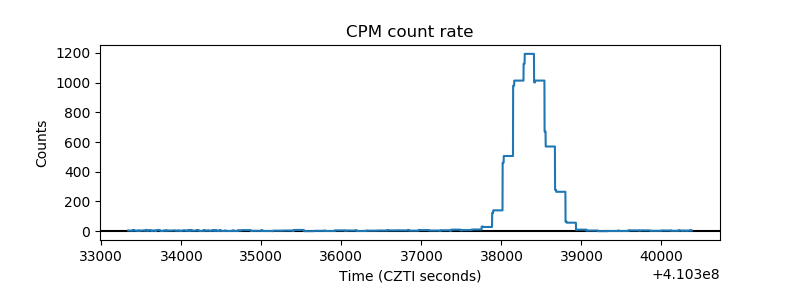 |
| CZT Counter | 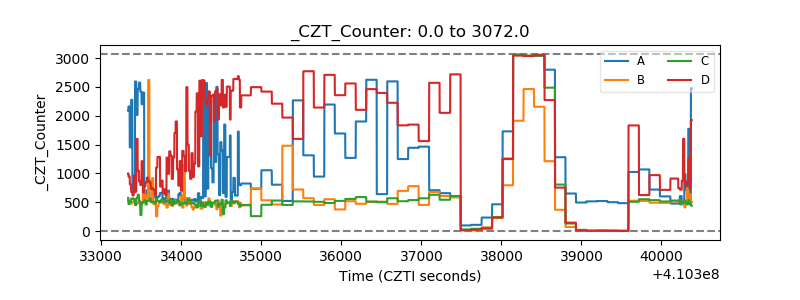 |
| +2.5 Volts monitor | 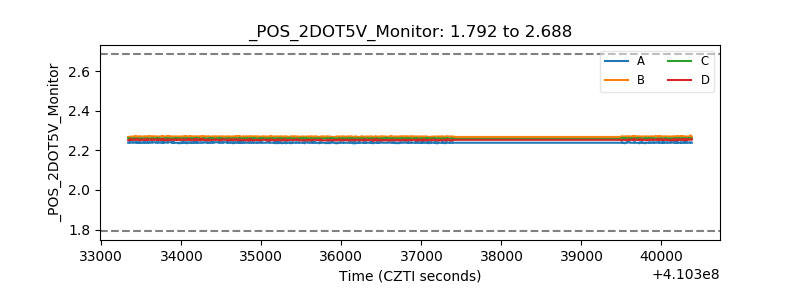 |
| +5 Volts monitor | 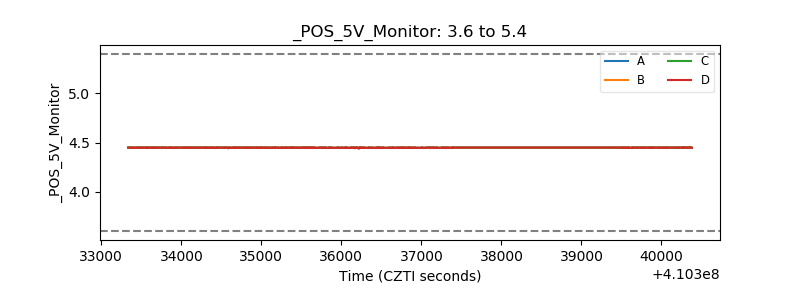 |
| _ROLL_ROT | 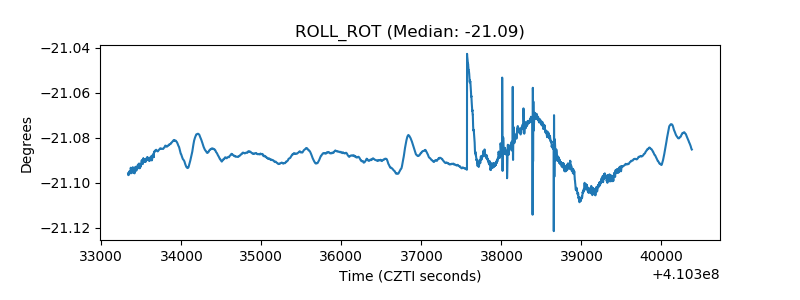 |
| _Roll_DEC | 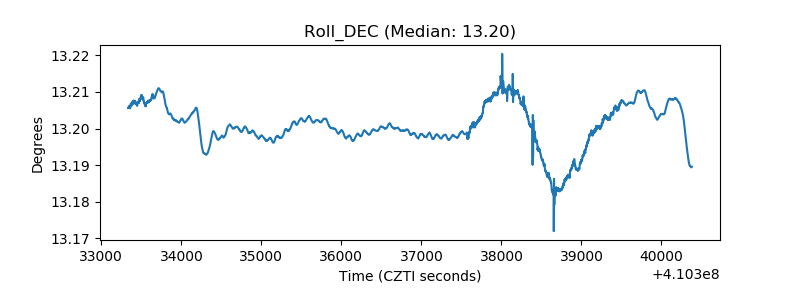 |
| _Roll_RA | 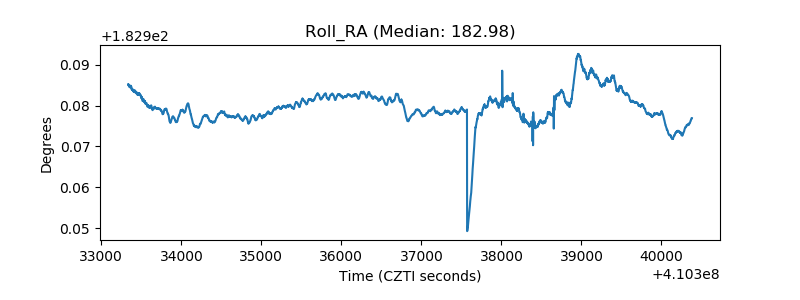 |
| Veto Counter | 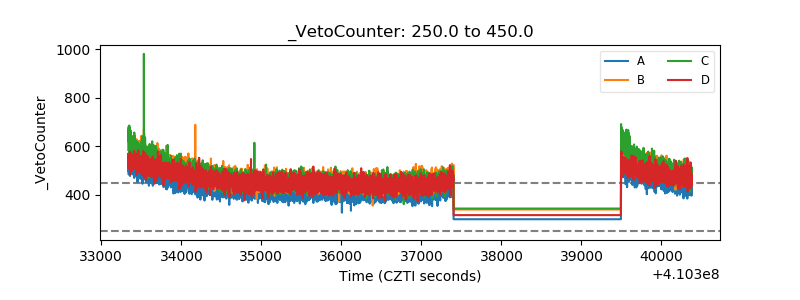 |