| Param | Original file | Final file |
|---|---|---|
| Filename | modeM0/AS1A12_037T01_9000005456_39275cztM0_level2.fits | modeM0/AS1A12_037T01_9000005456_39275cztM0_level2_quad_clean.evt |
| Size (bytes) | 467,544,960 | 83,136,960 |
| Size | 445.9 MB | 79.3 MB |
| Events in quadrant A | 3,286,623 | 583,639 |
| Events in quadrant B | 2,784,443 | 600,891 |
| Events in quadrant C | 2,509,275 | 578,652 |
| Events in quadrant D | 8,337,503 | 403,428 |
| Mode M0 | |||
|---|---|---|---|
| Quadrant | BADHDUFLAG | Total packets | Discarded packets |
| A | 0 | 12713 | 3 |
| B | 0 | 11279 | 2 |
| C | 0 | 10171 | 2 |
| D | 0 | 28230 | 2 |
| Mode SS | |||
|---|---|---|---|
| Quadrant | BADHDUFLAG | Total packets | Discarded packets |
| A | 0 | 100 | 0 |
| B | 0 | 100 | 0 |
| C | 0 | 100 | 0 |
| D | 0 | 100 | 0 |
| Mode M9 | |||
|---|---|---|---|
| Quadrant | BADHDUFLAG | Total packets | Discarded packets |
| A | 0 | 26 | 0 |
| B | 0 | 26 | 0 |
| C | 0 | 26 | 0 |
| D | 0 | 27 | 0 |
| Quadrant | Total seconds | Saturated seconds | Saturation percentage |
|---|---|---|---|
| A | 5007 | 148 | 2.955862% |
| B | 5007 | 96 | 1.917316% |
| C | 5007 | 6 | 0.119832% |
| D | 5007 | 1638 | 32.714200% |
Noise dominated data is calculated using 1-second bins in cleaned event files. If a bin has >2000 counts, and if more than 50% of those come from <1% of pixels, then it is considered to be noise-dominated and hence unusable.
| Quadrant | # 1 sec bins | Bins with >0 counts | Bins with >2000 counts | High rate bins dominated by noise | Noise dominated (total time) | Noise dominated (detector-on time) | Marked lightcurve |
|---|---|---|---|---|---|---|---|
| A | 7039 | 5008 | 115 | 115 | 1.63% | 2.30% | 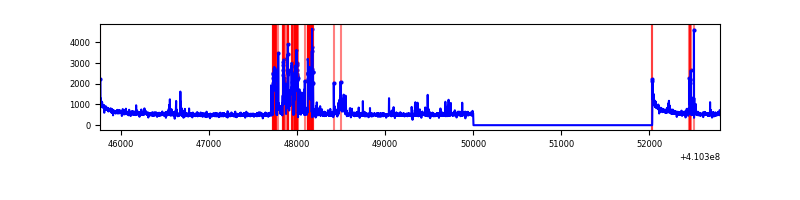 |
| B | 7039 | 5008 | 71 | 71 | 1.01% | 1.42% | 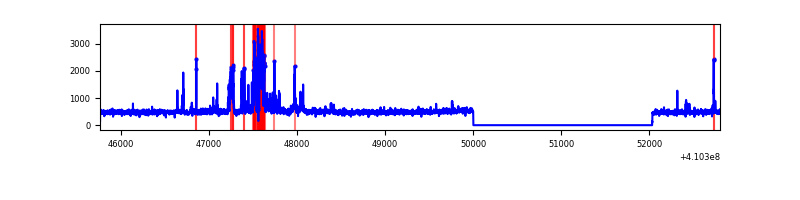 |
| C | 7039 | 5008 | 3 | 3 | 0.04% | 0.06% | 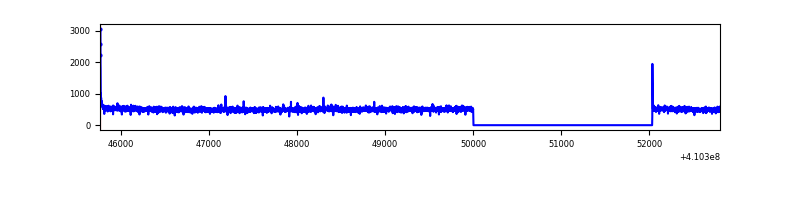 |
| D | 7039 | 5008 | 1508 | 1508 | 21.42% | 30.11% | 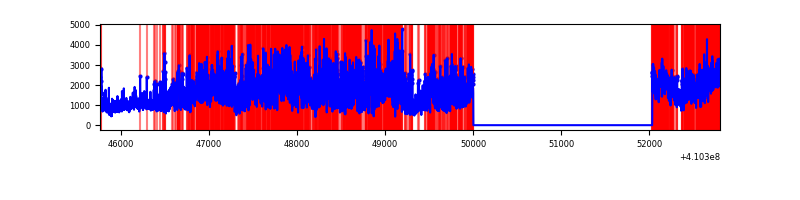 |
Top three noisy pixels from each quadrant. If the there are fewer than three noisy pixels in the level2.evt file, extra rows are filled as -1
| Pixel properties | Quadrant properties | ||||||
|---|---|---|---|---|---|---|---|
| Quadrant | DetID | PixID | Counts | Sigma | Mean | Median | Sigma |
| A | 15 | 222 | 613153 | 5179.7 | 583 | 574 | 118.3 |
| A | 10 | 83 | 400619 | 3382.61 | 583 | 574 | 118.3 |
| A | 13 | 248 | 16336 | 133.28 | 583 | 574 | 118.3 |
| B | 5 | 172 | 244418 | 2181.79 | 579 | 564 | 111.8 |
| B | 0 | 190 | 90395 | 803.73 | 579 | 564 | 111.8 |
| B | 5 | 184 | 61805 | 547.93 | 579 | 564 | 111.8 |
| C | 15 | 214 | 229257 | 1679.46 | 575 | 578 | 136.2 |
| C | 0 | 10 | 21667 | 154.88 | 575 | 578 | 136.2 |
| C | 3 | 233 | 14106 | 99.35 | 575 | 578 | 136.2 |
| D | 12 | 235 | 5386087 | 42300.96 | 516 | 501 | 127.3 |
| D | 12 | 227 | 469406 | 3683.0 | 516 | 501 | 127.3 |
| D | 1 | 47 | 261854 | 2052.79 | 516 | 501 | 127.3 |
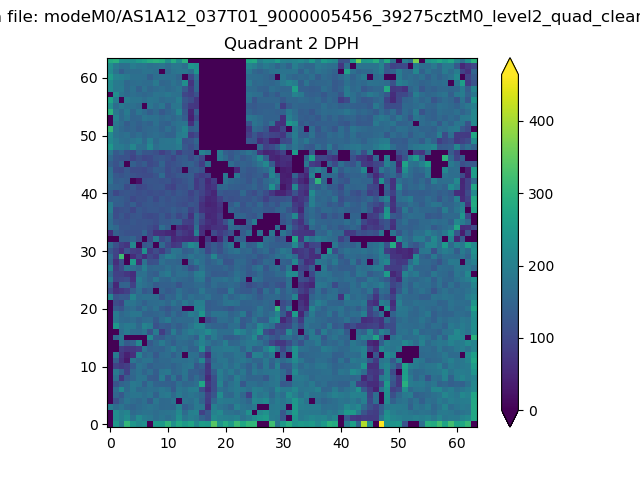
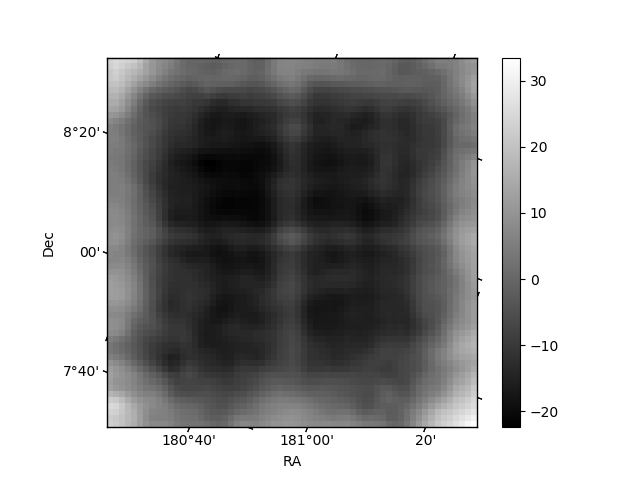
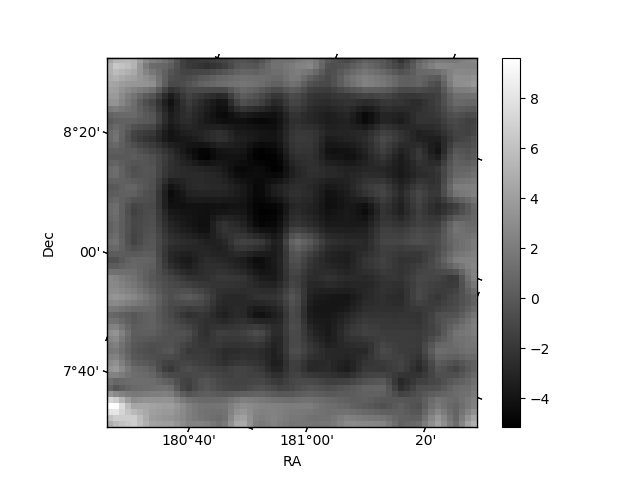
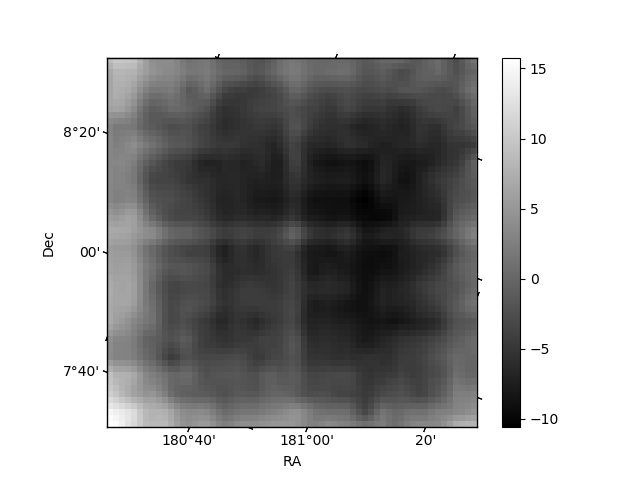
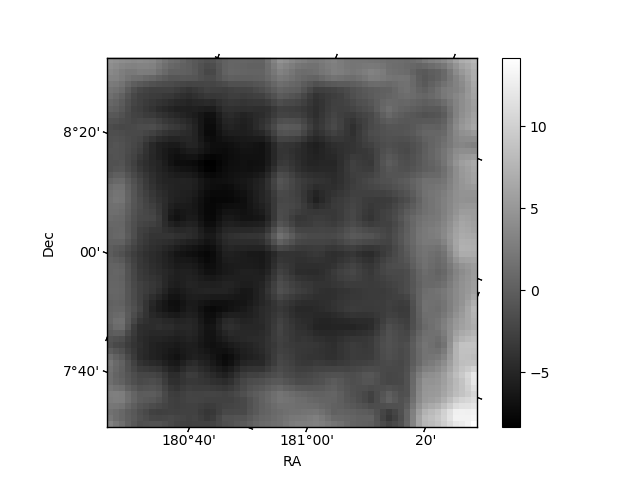
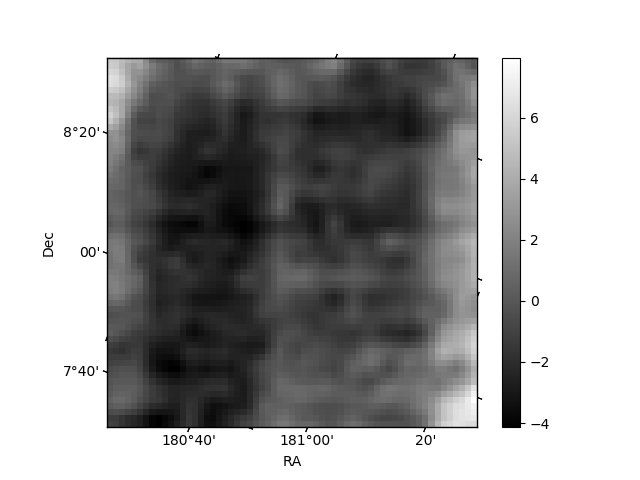
Histogram calculated using DETX and DETY for each event in the final _common_clean file
| Quadrant A | 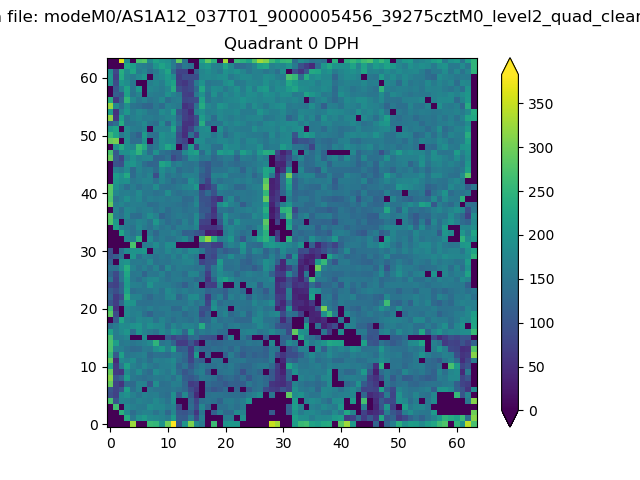 |
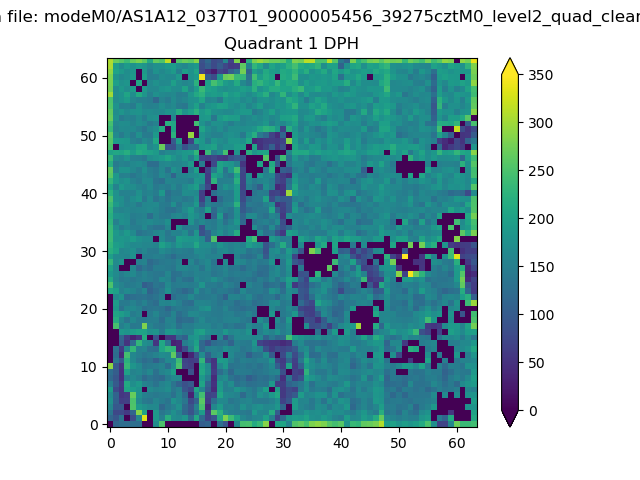 |
Quadrant B |
|---|---|---|---|
| Quadrant D | 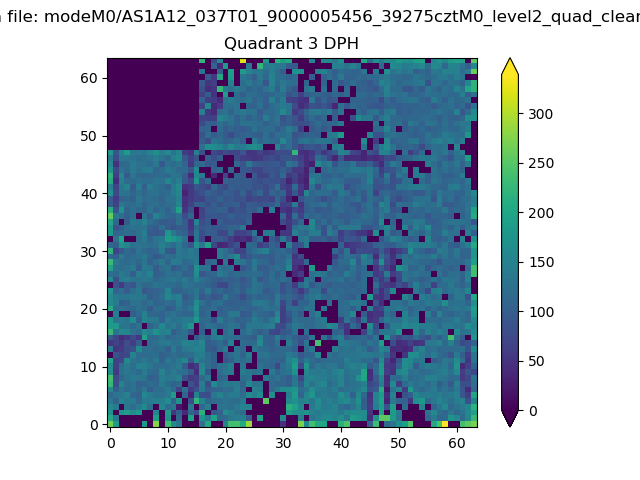 |
 |
Quadrant C |
| Plot type | Count rate plots | Images |
|---|---|---|
| Comparison with Poisson distribution Blue bars denote a histogram of data divided into 1 sec bins. Red curve is a Poisson curve with rate = median count rate of data. |
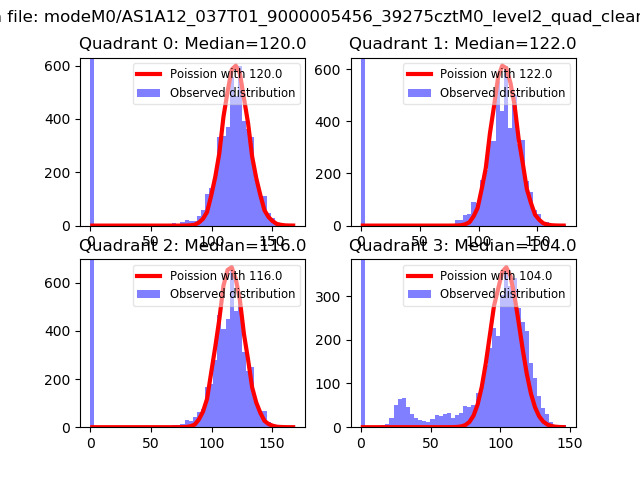 |
 |
| Quadrant-wise count rates Data is divided into 100 sec bins |
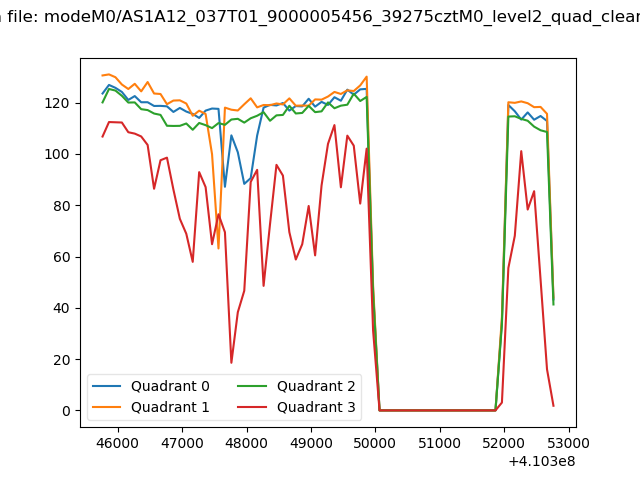 |
|
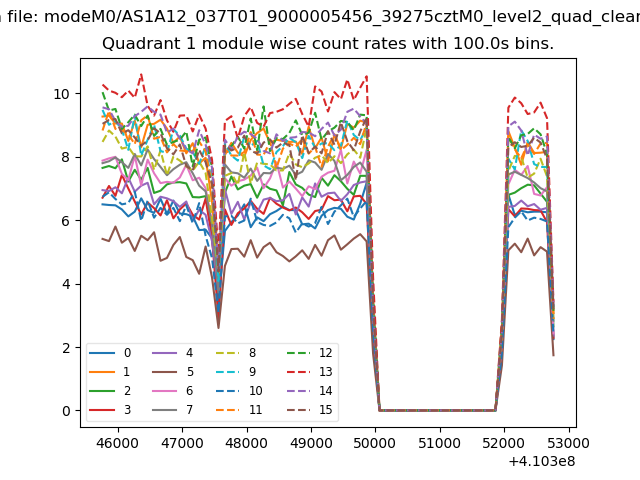
| Module-wise count rates for Quadrant A Data is divided into 100 sec bins |
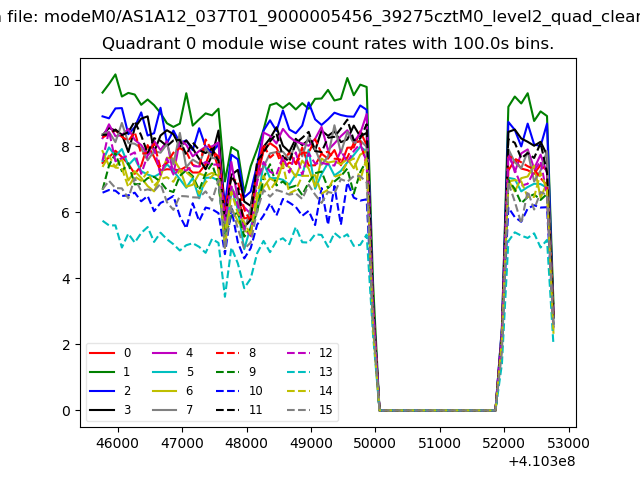 |
 |
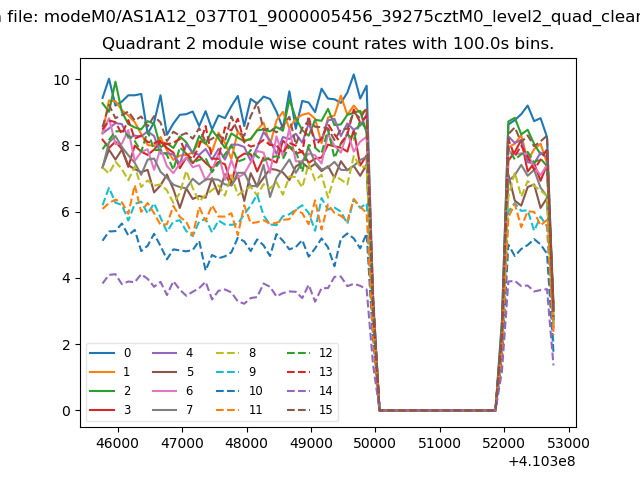
| Module-wise count rates for Quadrant B Data is divided into 100 sec bins |
 |
 |
| Module-wise count rates for Quadrant C Data is divided into 100 sec bins |
 |
 |
| Module-wise count rates for Quadrant D Data is divided into 100 sec bins |
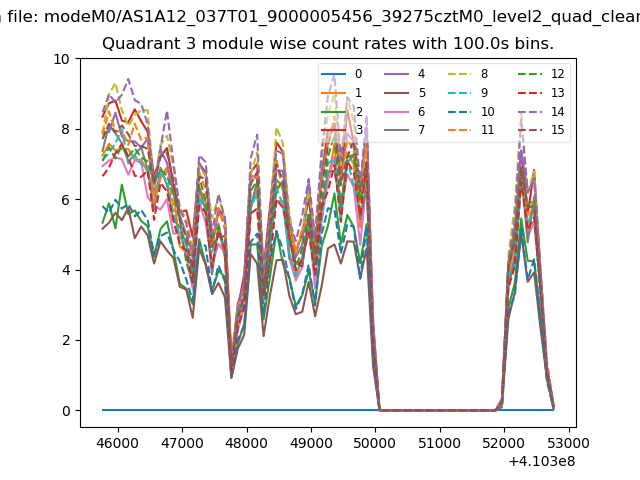 |
 |
| Parameter | Plot |
|---|---|
| CZT HV Monitor | 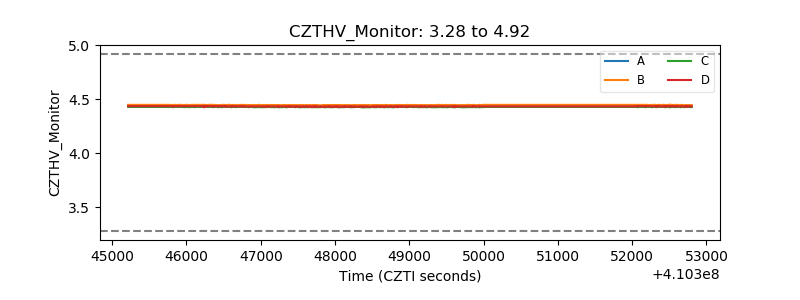 |
| D_VDD | 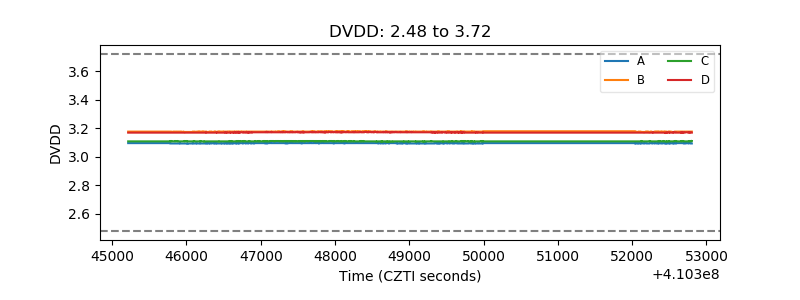 |
| Temperature 1 | 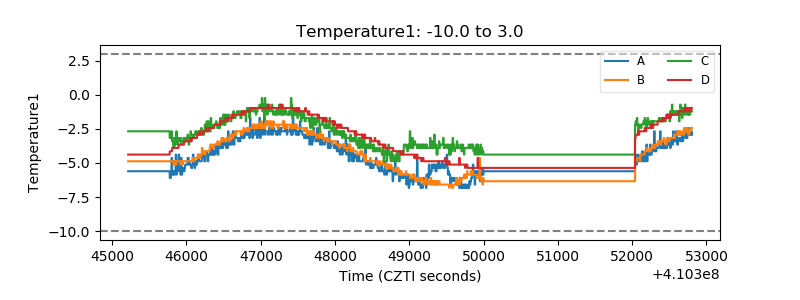 |
| Veto HV Monitor | 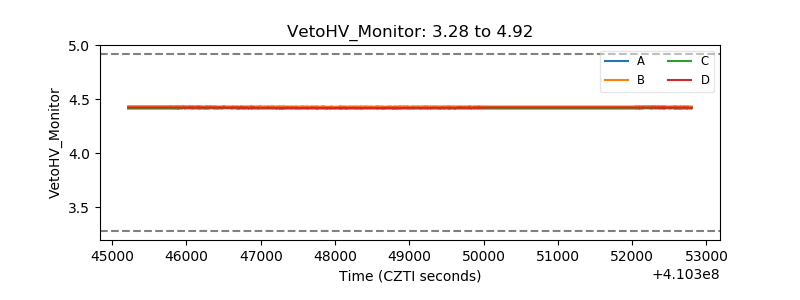 |
| Veto LLD | 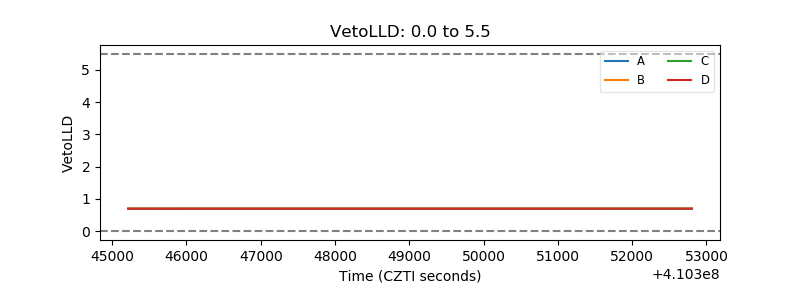 |
| Alpha Counter | 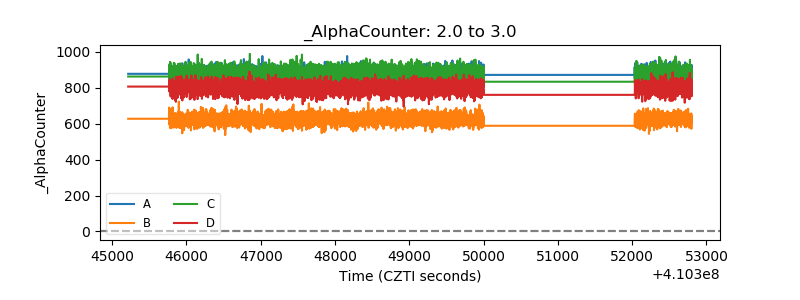 |
| _CPM_Rate | 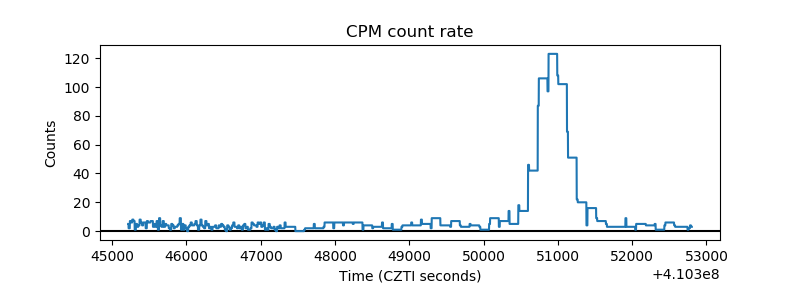 |
| CZT Counter | 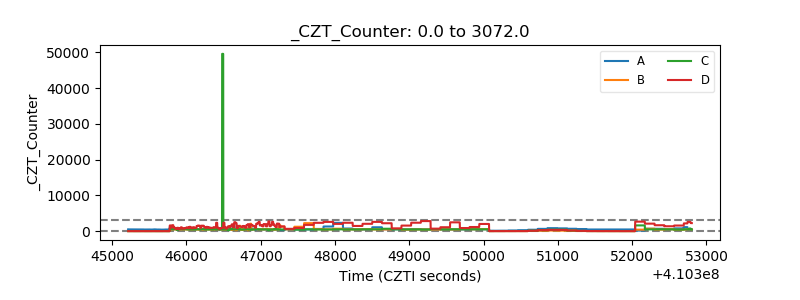 |
| +2.5 Volts monitor | 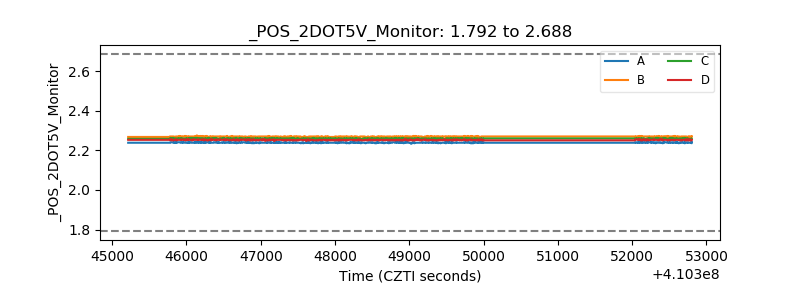 |
| +5 Volts monitor |  |
| _ROLL_ROT | 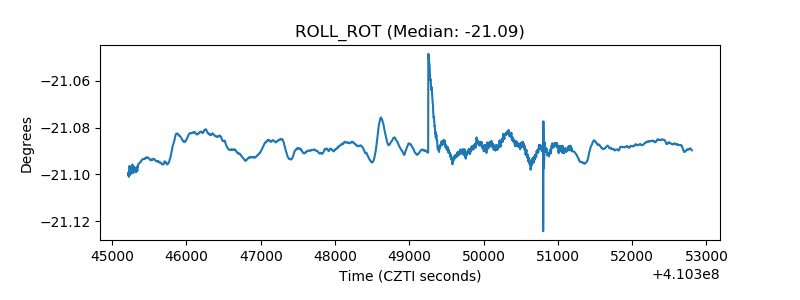 |
| _Roll_DEC | 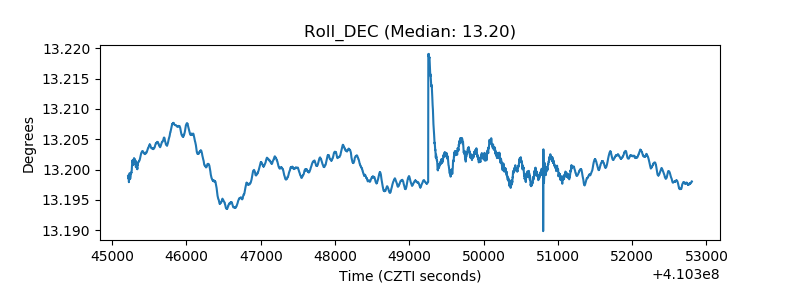 |
| _Roll_RA | 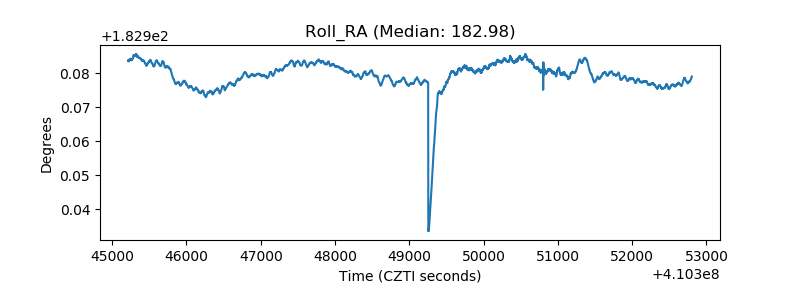 |
| Veto Counter | 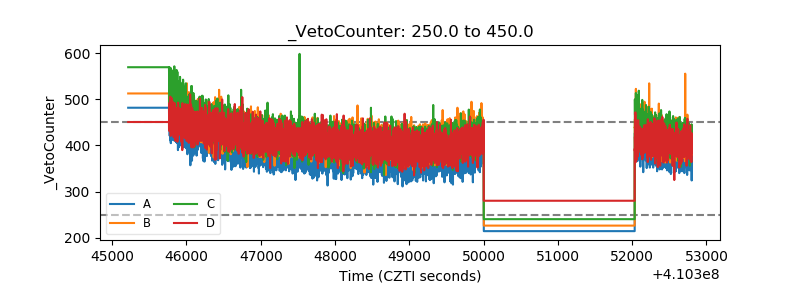 |