| Param | Original file | Final file |
|---|---|---|
| Filename | modeM0/AS1A12_037T01_9000005456_39276cztM0_level2.fits | modeM0/AS1A12_037T01_9000005456_39276cztM0_level2_quad_clean.evt |
| Size (bytes) | 517,158,720 | 81,696,960 |
| Size | 493.2 MB | 77.9 MB |
| Events in quadrant A | 4,289,625 | 566,651 |
| Events in quadrant B | 2,705,452 | 605,227 |
| Events in quadrant C | 2,531,300 | 579,260 |
| Events in quadrant D | 9,211,841 | 357,012 |
| Mode M0 | |||
|---|---|---|---|
| Quadrant | BADHDUFLAG | Total packets | Discarded packets |
| A | 0 | 16011 | 3 |
| B | 0 | 11334 | 2 |
| C | 0 | 10527 | 2 |
| D | 0 | 30985 | 2 |
| Mode SS | |||
|---|---|---|---|
| Quadrant | BADHDUFLAG | Total packets | Discarded packets |
| A | 0 | 106 | 0 |
| B | 0 | 106 | 0 |
| C | 0 | 106 | 0 |
| D | 0 | 106 | 0 |
| Mode M9 | |||
|---|---|---|---|
| Quadrant | BADHDUFLAG | Total packets | Discarded packets |
| A | 0 | 27 | 0 |
| B | 0 | 27 | 0 |
| C | 0 | 27 | 0 |
| D | 0 | 28 | 0 |
| Quadrant | Total seconds | Saturated seconds | Saturation percentage |
|---|---|---|---|
| A | 5218 | 373 | 7.148333% |
| B | 5218 | 54 | 1.034879% |
| C | 5218 | 4 | 0.076658% |
| D | 5218 | 2128 | 40.781909% |
Noise dominated data is calculated using 1-second bins in cleaned event files. If a bin has >2000 counts, and if more than 50% of those come from <1% of pixels, then it is considered to be noise-dominated and hence unusable.
| Quadrant | # 1 sec bins | Bins with >0 counts | Bins with >2000 counts | High rate bins dominated by noise | Noise dominated (total time) | Noise dominated (detector-on time) | Marked lightcurve |
|---|---|---|---|---|---|---|---|
| A | 7009 | 5219 | 310 | 310 | 4.42% | 5.94% | 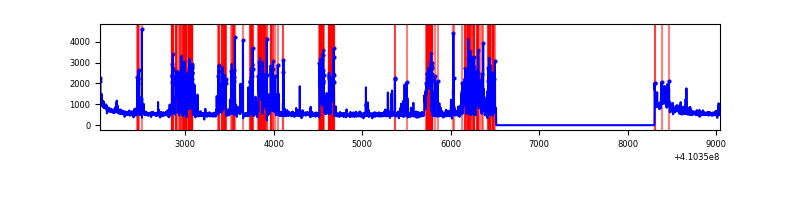 |
| B | 7009 | 5219 | 39 | 39 | 0.56% | 0.75% | 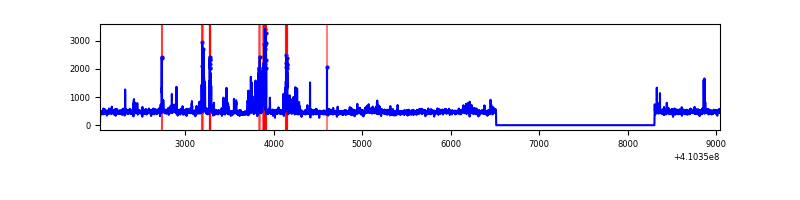 |
| C | 7009 | 5219 | 0 | 0 | 0.00% | 0.00% | 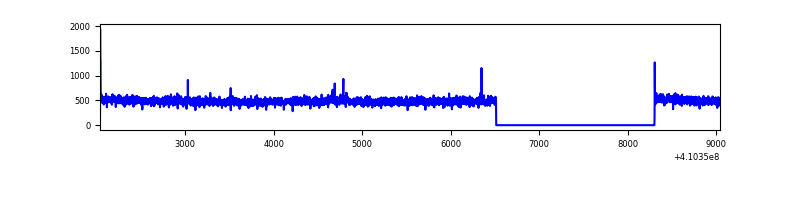 |
| D | 7009 | 5218 | 2038 | 2038 | 29.08% | 39.06% | 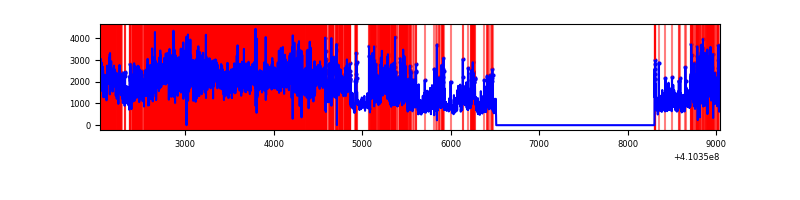 |
Top three noisy pixels from each quadrant. If the there are fewer than three noisy pixels in the level2.evt file, extra rows are filled as -1
| Pixel properties | Quadrant properties | ||||||
|---|---|---|---|---|---|---|---|
| Quadrant | DetID | PixID | Counts | Sigma | Mean | Median | Sigma |
| A | 15 | 222 | 1609447 | 13533.94 | 584 | 572 | 118.9 |
| A | 10 | 83 | 413610 | 3474.5 | 584 | 572 | 118.9 |
| A | 13 | 254 | 8241 | 64.51 | 584 | 572 | 118.9 |
| B | 5 | 172 | 241321 | 2096.27 | 589 | 574 | 114.8 |
| B | 0 | 189 | 59164 | 510.16 | 589 | 574 | 114.8 |
| B | 0 | 190 | 41392 | 355.42 | 589 | 574 | 114.8 |
| C | 15 | 214 | 239183 | 1744.47 | 582 | 584 | 136.8 |
| C | 0 | 10 | 7883 | 53.37 | 582 | 584 | 136.8 |
| C | 9 | 187 | 5469 | 35.72 | 582 | 584 | 136.8 |
| D | 12 | 235 | 5666139 | 44378.36 | 512 | 496 | 127.7 |
| D | 12 | 227 | 1237021 | 9685.57 | 512 | 496 | 127.7 |
| D | 1 | 47 | 116445 | 908.22 | 512 | 496 | 127.7 |
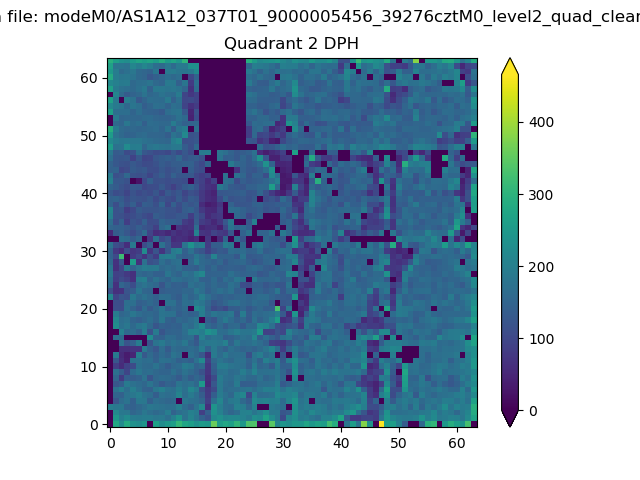
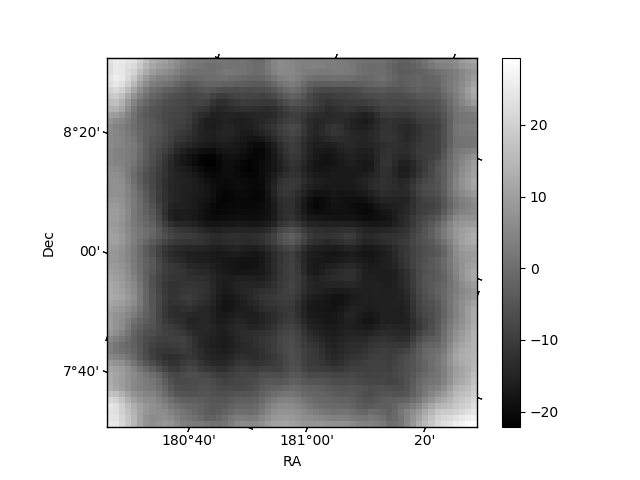
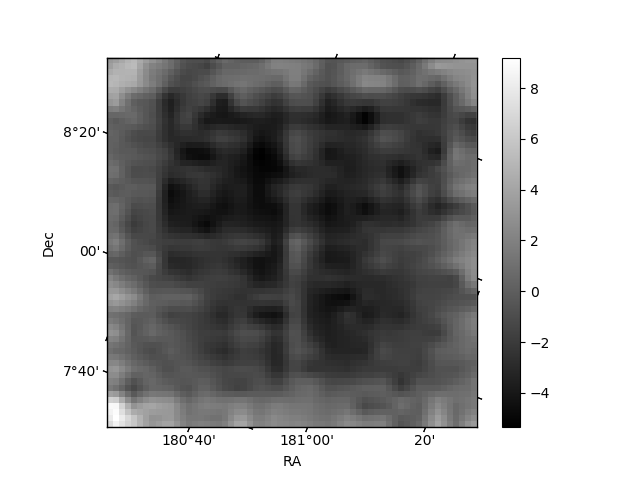
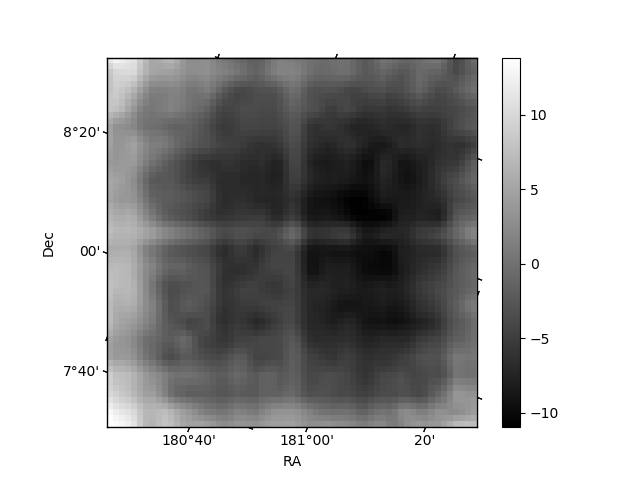
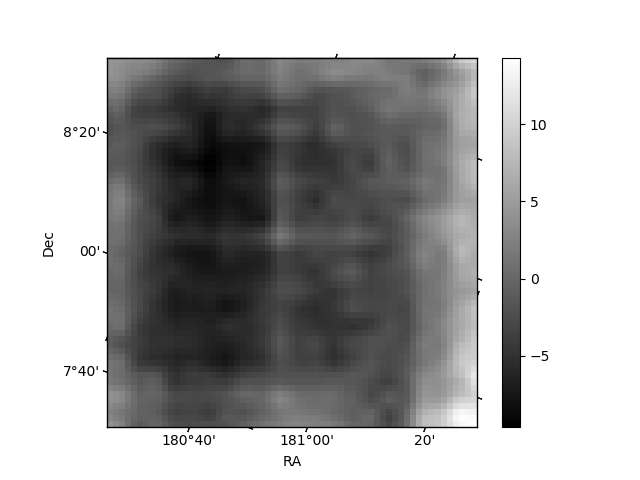
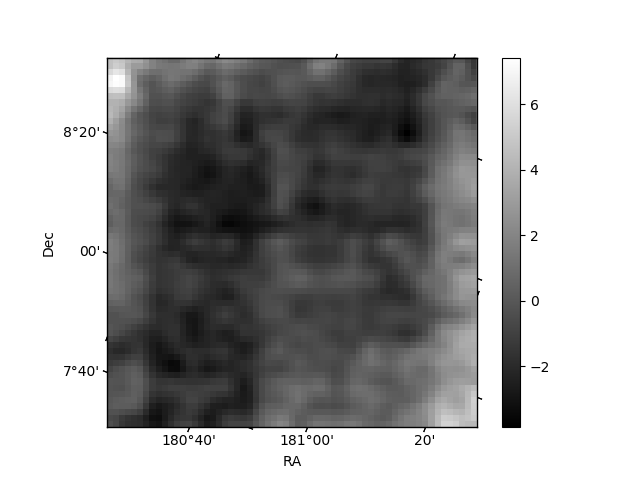
Histogram calculated using DETX and DETY for each event in the final _common_clean file
| Quadrant A | 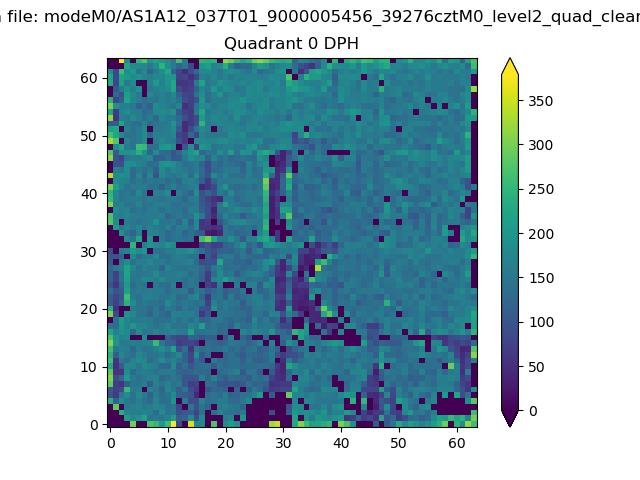 |
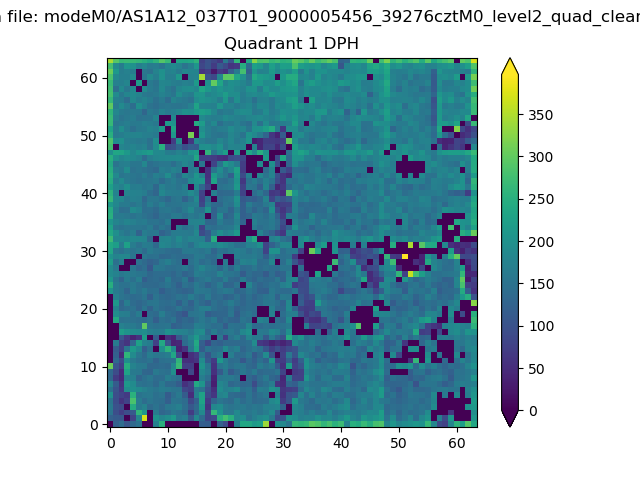 |
Quadrant B |
|---|---|---|---|
| Quadrant D | 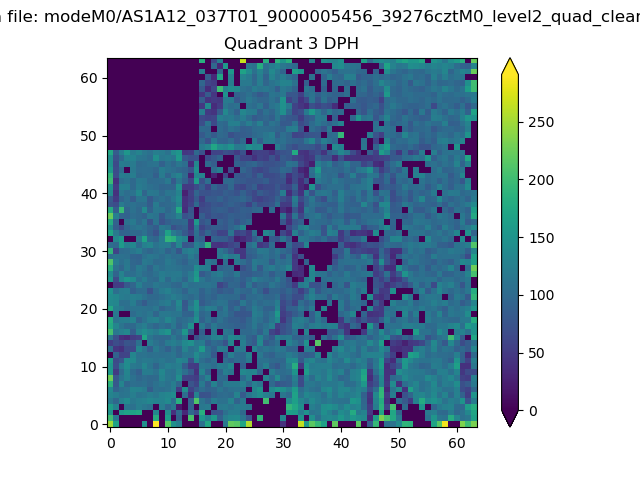 |
 |
Quadrant C |
| Plot type | Count rate plots | Images |
|---|---|---|
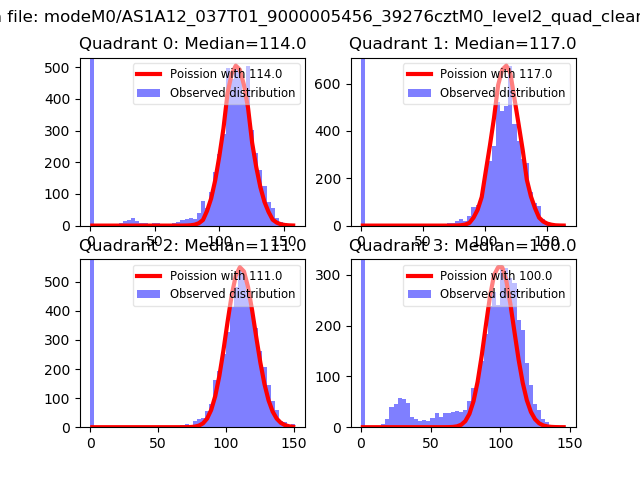
| Comparison with Poisson distribution Blue bars denote a histogram of data divided into 1 sec bins. Red curve is a Poisson curve with rate = median count rate of data. |
 |
 |
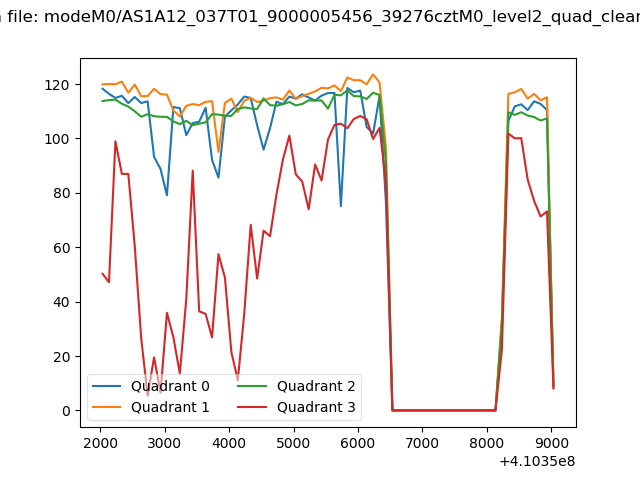
| Quadrant-wise count rates Data is divided into 100 sec bins |
 |
|
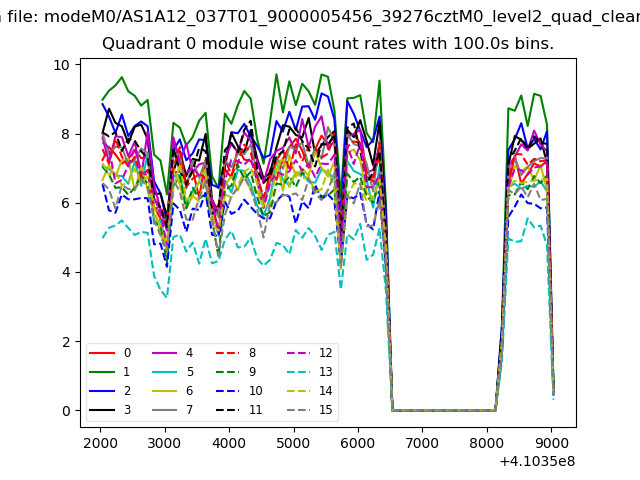
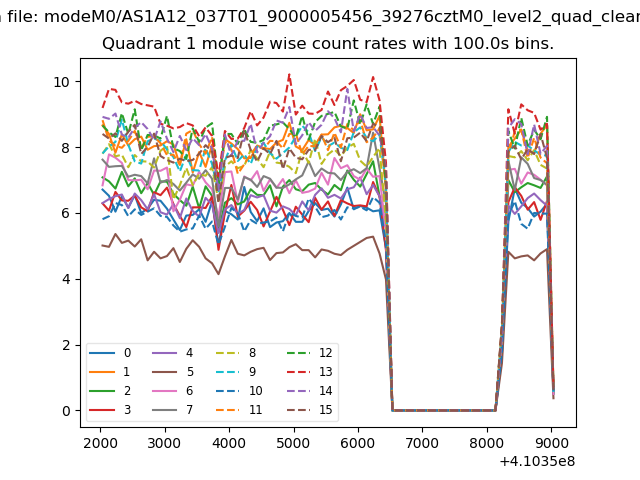
| Module-wise count rates for Quadrant A Data is divided into 100 sec bins |
 |
 |
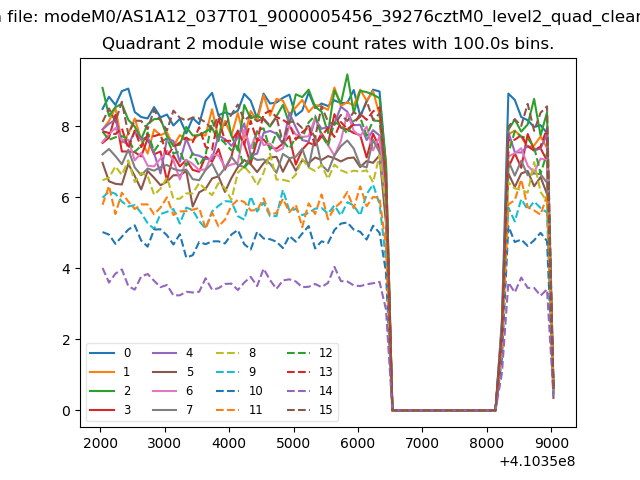
| Module-wise count rates for Quadrant B Data is divided into 100 sec bins |
 |
 |
| Module-wise count rates for Quadrant C Data is divided into 100 sec bins |
 |
 |
| Module-wise count rates for Quadrant D Data is divided into 100 sec bins |
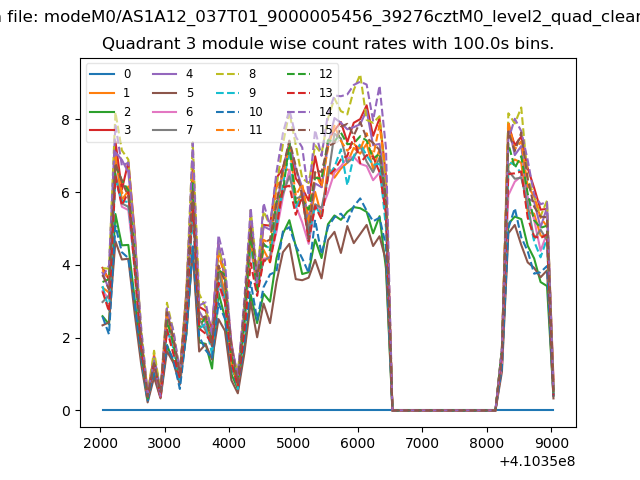 |
 |
| Parameter | Plot |
|---|---|
| CZT HV Monitor | 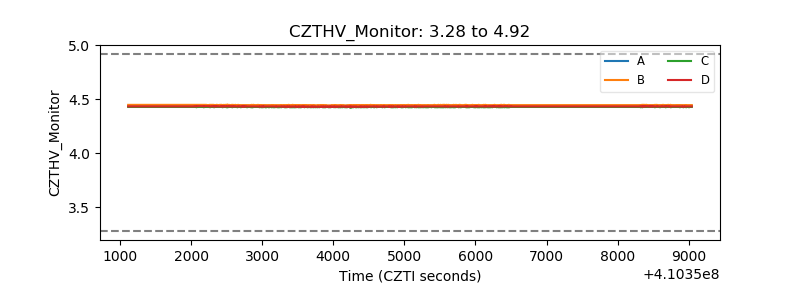 |
| D_VDD | 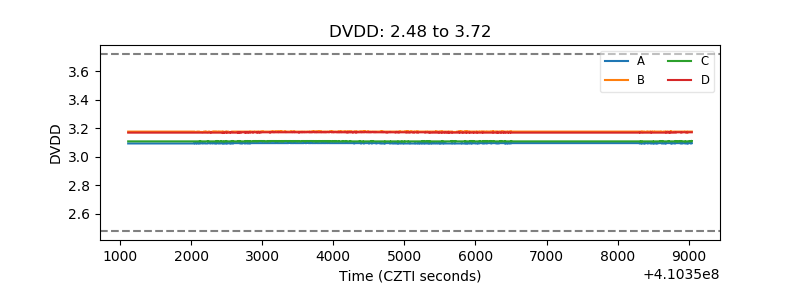 |
| Temperature 1 | 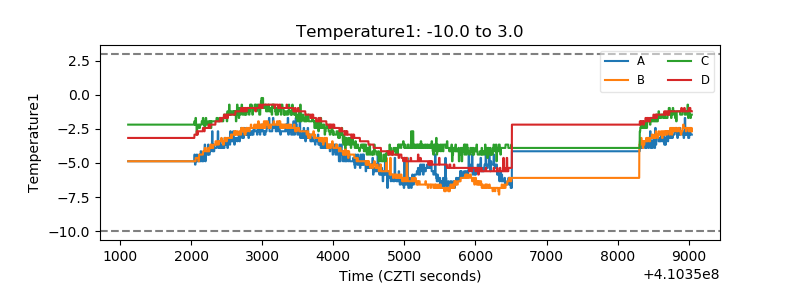 |
| Veto HV Monitor | 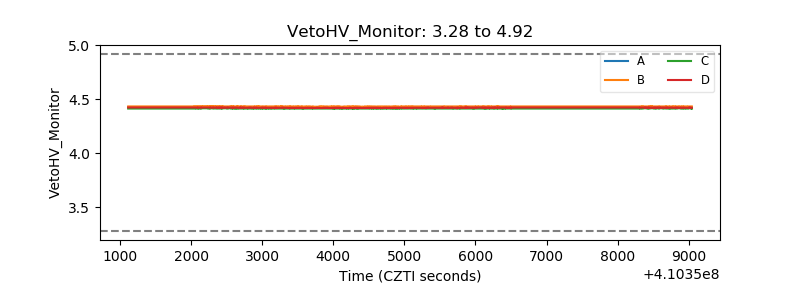 |
| Veto LLD | 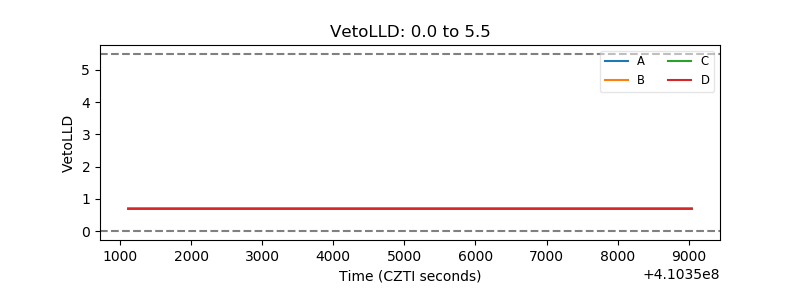 |
| Alpha Counter | 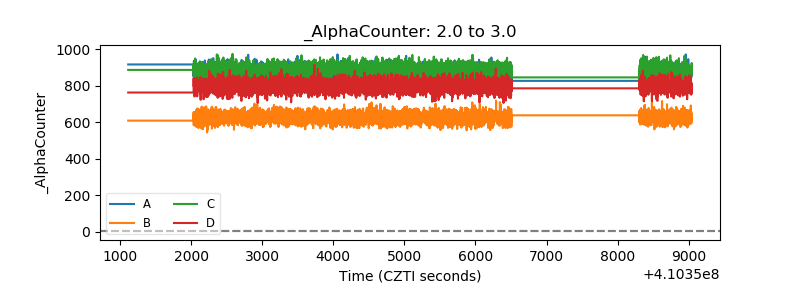 |
| _CPM_Rate | 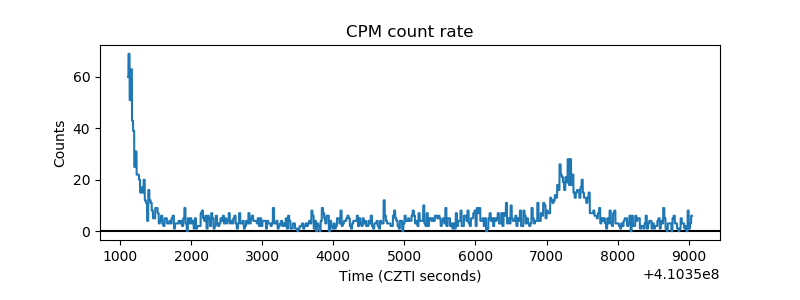 |
| CZT Counter | 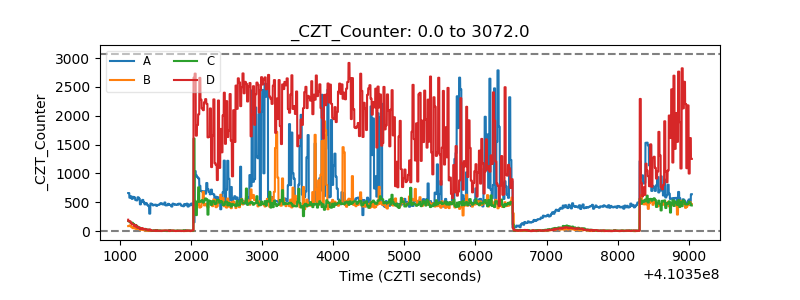 |
| +2.5 Volts monitor |  |
| +5 Volts monitor | 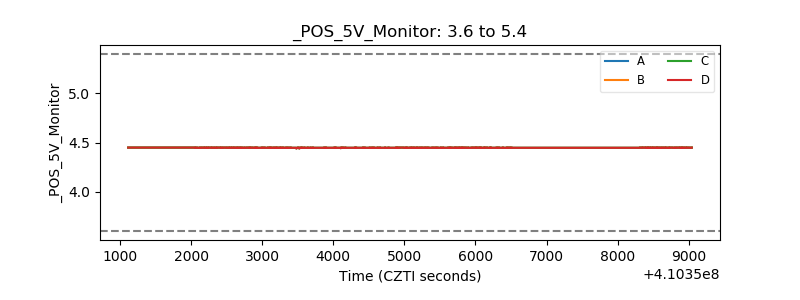 |
| _ROLL_ROT | 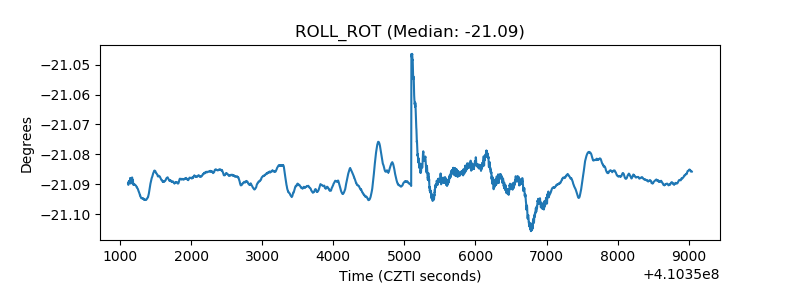 |
| _Roll_DEC | 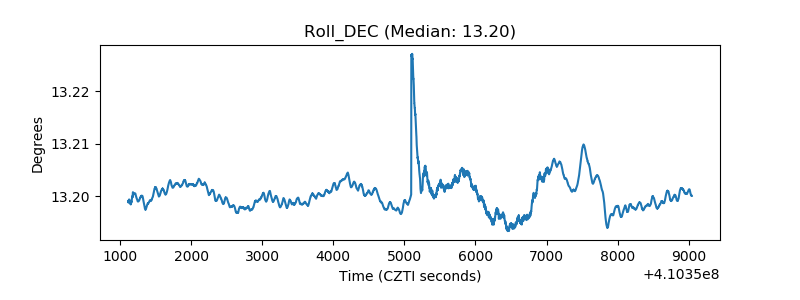 |
| _Roll_RA | 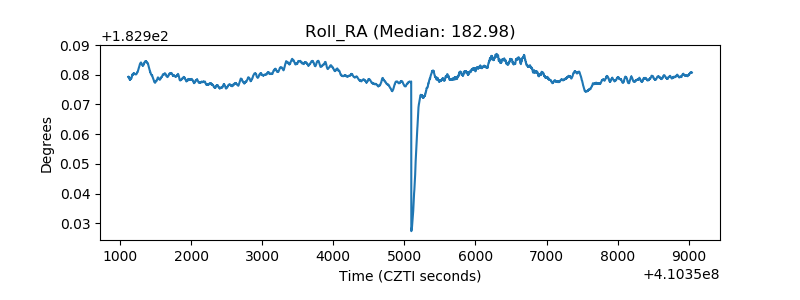 |
| Veto Counter | 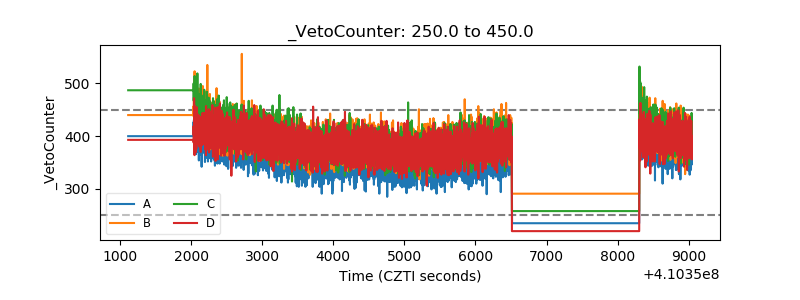 |