| Param | Original file | Final file |
|---|---|---|
| Filename | modeM0/AS1A12_037T01_9000005456_39277cztM0_level2.fits | modeM0/AS1A12_037T01_9000005456_39277cztM0_level2_quad_clean.evt |
| Size (bytes) | 558,840,960 | 87,912,000 |
| Size | 533.0 MB | 83.8 MB |
| Events in quadrant A | 4,987,774 | 581,698 |
| Events in quadrant B | 3,019,835 | 648,264 |
| Events in quadrant C | 2,726,016 | 619,683 |
| Events in quadrant D | 9,512,435 | 414,820 |
| Mode M0 | |||
|---|---|---|---|
| Quadrant | BADHDUFLAG | Total packets | Discarded packets |
| A | 0 | 18359 | 3 |
| B | 0 | 12581 | 2 |
| C | 0 | 11465 | 2 |
| D | 0 | 32213 | 2 |
| Mode SS | |||
|---|---|---|---|
| Quadrant | BADHDUFLAG | Total packets | Discarded packets |
| A | 0 | 116 | 0 |
| B | 0 | 116 | 0 |
| C | 0 | 116 | 0 |
| D | 0 | 116 | 0 |
| Mode M9 | |||
|---|---|---|---|
| Quadrant | BADHDUFLAG | Total packets | Discarded packets |
| A | 0 | 20 | 0 |
| B | 0 | 20 | 0 |
| C | 0 | 20 | 0 |
| D | 0 | 21 | 0 |
| Quadrant | Total seconds | Saturated seconds | Saturation percentage |
|---|---|---|---|
| A | 5678 | 576 | 10.144417% |
| B | 5678 | 70 | 1.232828% |
| C | 5678 | 7 | 0.123283% |
| D | 5678 | 1996 | 35.153223% |
Noise dominated data is calculated using 1-second bins in cleaned event files. If a bin has >2000 counts, and if more than 50% of those come from <1% of pixels, then it is considered to be noise-dominated and hence unusable.
| Quadrant | # 1 sec bins | Bins with >0 counts | Bins with >2000 counts | High rate bins dominated by noise | Noise dominated (total time) | Noise dominated (detector-on time) | Marked lightcurve |
|---|---|---|---|---|---|---|---|
| A | 7139 | 5679 | 422 | 422 | 5.91% | 7.43% | 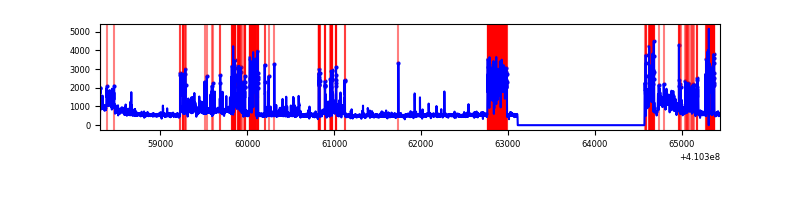 |
| B | 7139 | 5679 | 40 | 40 | 0.56% | 0.70% | 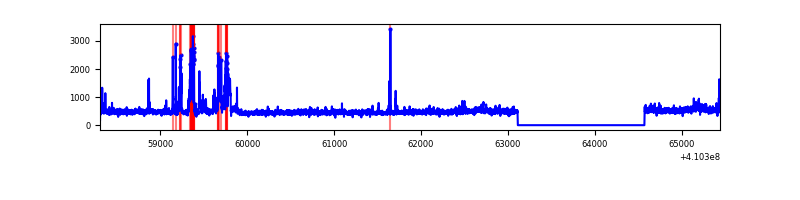 |
| C | 7139 | 5679 | 0 | 0 | 0.00% | 0.00% | 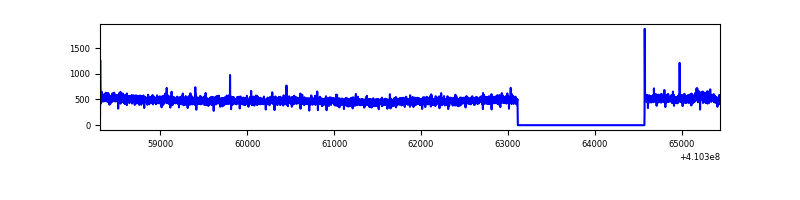 |
| D | 7139 | 5679 | 1761 | 1761 | 24.67% | 31.01% | 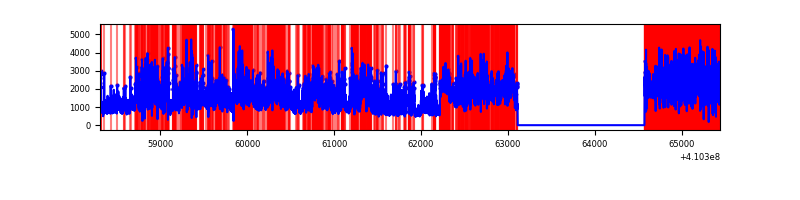 |
Top three noisy pixels from each quadrant. If the there are fewer than three noisy pixels in the level2.evt file, extra rows are filled as -1
| Pixel properties | Quadrant properties | ||||||
|---|---|---|---|---|---|---|---|
| Quadrant | DetID | PixID | Counts | Sigma | Mean | Median | Sigma |
| A | 15 | 222 | 2123466 | 16734.72 | 618 | 605 | 126.9 |
| A | 10 | 83 | 424525 | 3341.8 | 618 | 605 | 126.9 |
| A | 13 | 248 | 35743 | 277.0 | 618 | 605 | 126.9 |
| B | 5 | 172 | 323161 | 2593.33 | 636 | 618 | 124.4 |
| B | 0 | 189 | 88887 | 709.71 | 636 | 618 | 124.4 |
| B | 0 | 190 | 79481 | 634.08 | 636 | 618 | 124.4 |
| C | 15 | 214 | 242492 | 1636.28 | 629 | 630 | 147.8 |
| C | 3 | 233 | 23631 | 155.61 | 629 | 630 | 147.8 |
| C | 0 | 10 | 7397 | 45.78 | 629 | 630 | 147.8 |
| D | 12 | 235 | 5849160 | 43356.43 | 546 | 530 | 134.9 |
| D | 12 | 227 | 1120143 | 8299.79 | 546 | 530 | 134.9 |
| D | 2 | 249 | 161826 | 1195.7 | 546 | 530 | 134.9 |
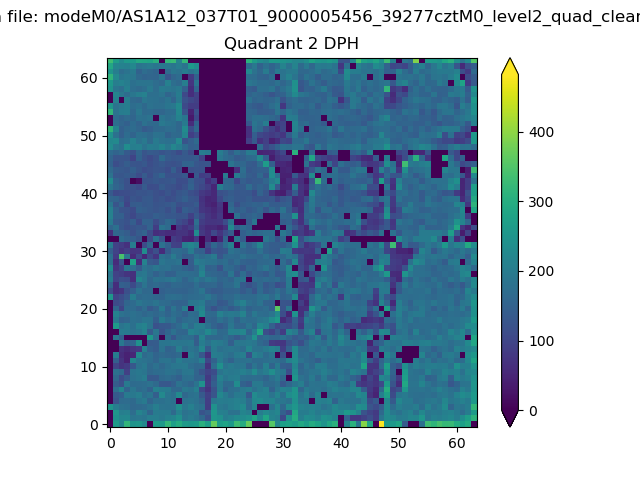
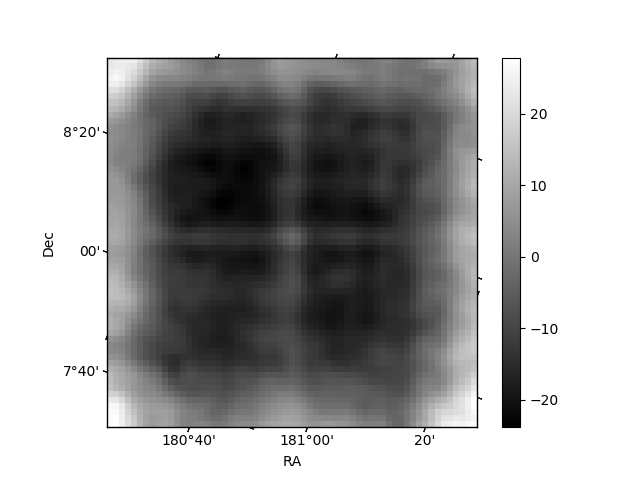
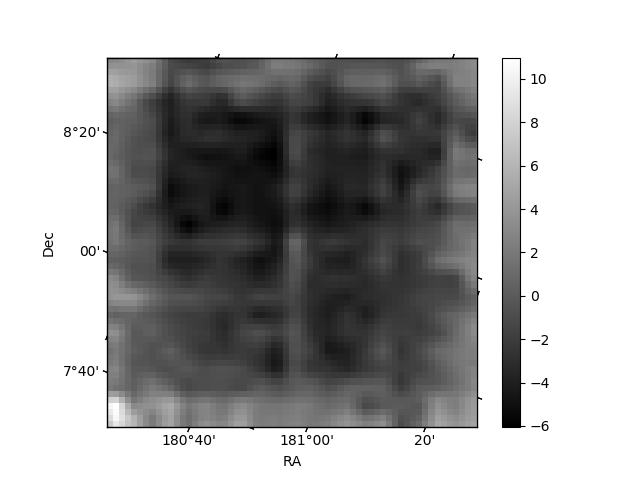
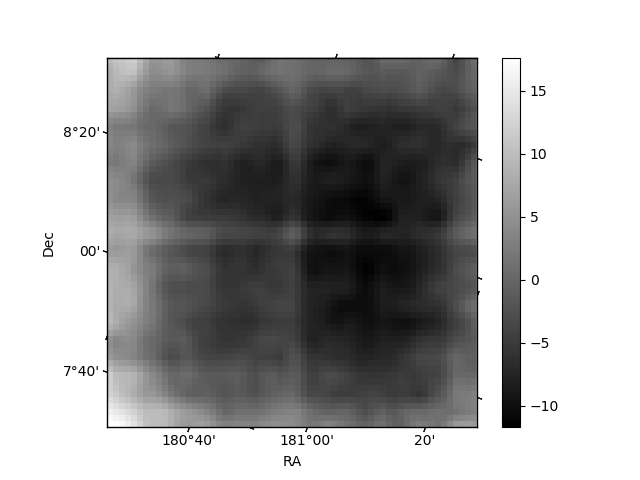
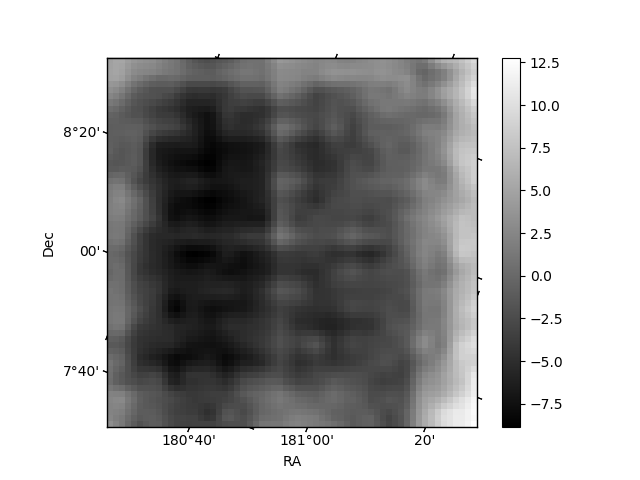
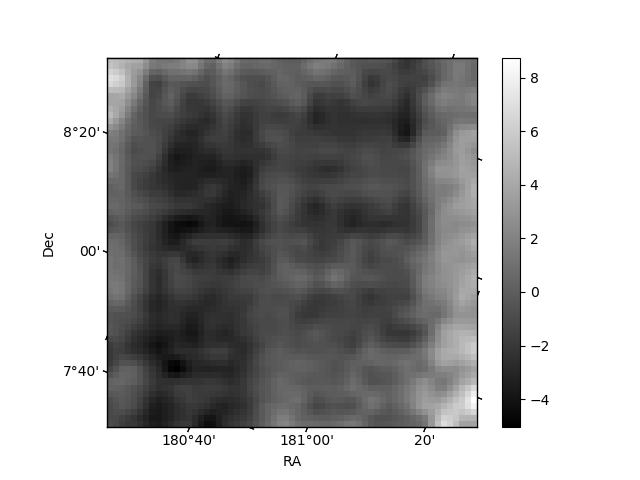
Histogram calculated using DETX and DETY for each event in the final _common_clean file
| Quadrant A | 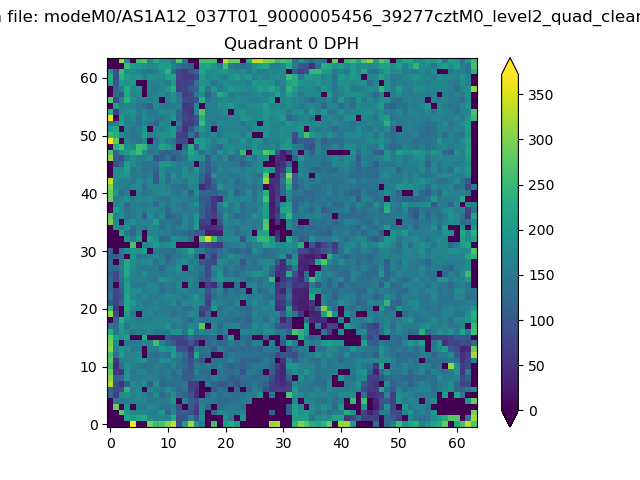 |
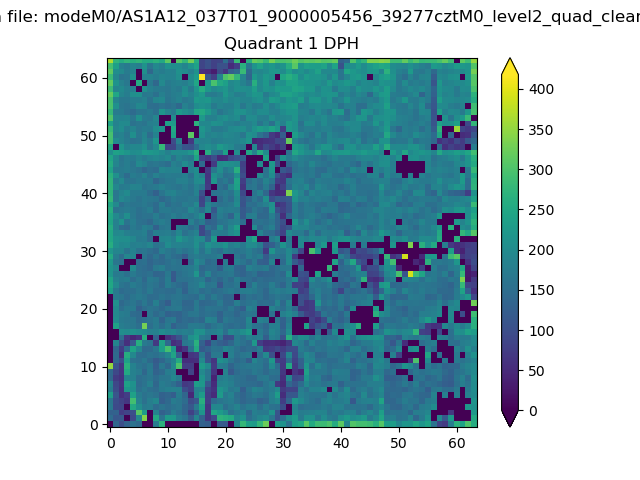 |
Quadrant B |
|---|---|---|---|
| Quadrant D | 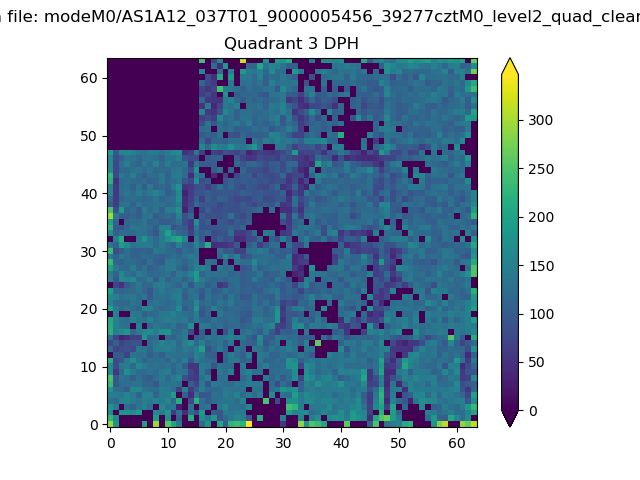 |
 |
Quadrant C |
| Plot type | Count rate plots | Images |
|---|---|---|
| Comparison with Poisson distribution Blue bars denote a histogram of data divided into 1 sec bins. Red curve is a Poisson curve with rate = median count rate of data. |
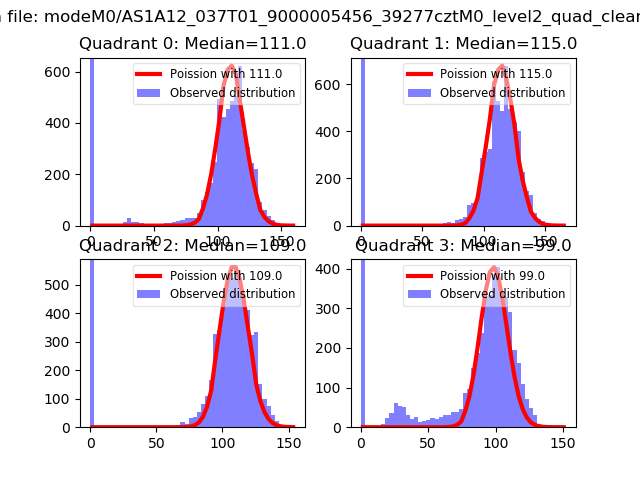 |
 |
| Quadrant-wise count rates Data is divided into 100 sec bins |
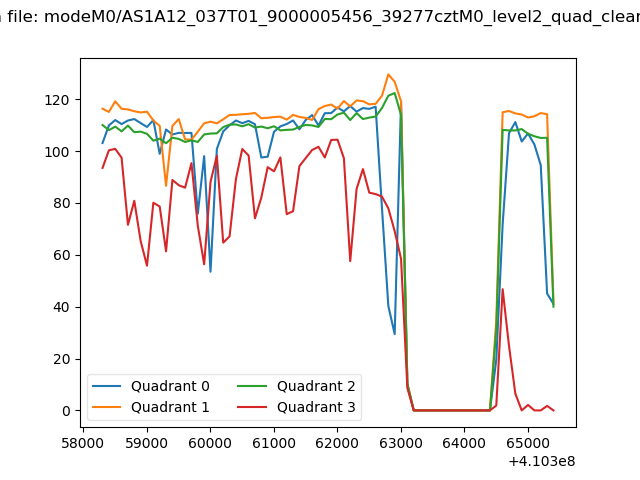 |
|
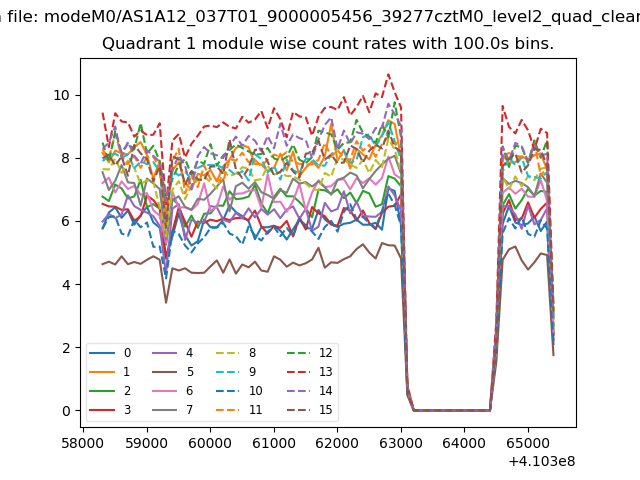
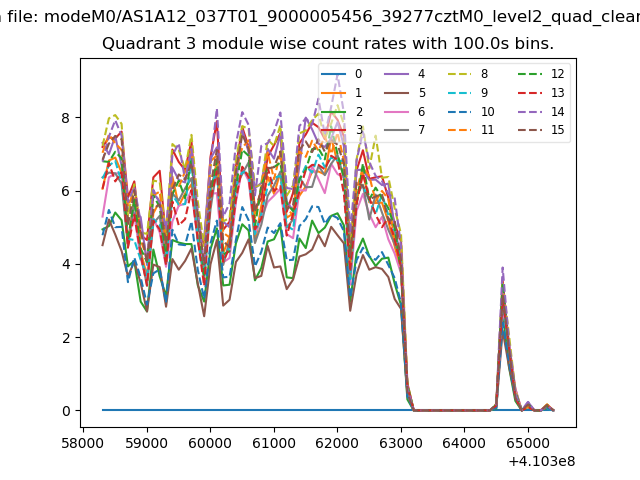
| Module-wise count rates for Quadrant A Data is divided into 100 sec bins |
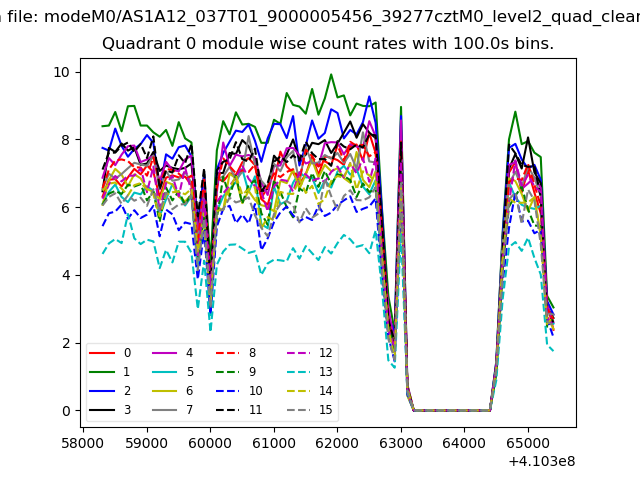 |
 |
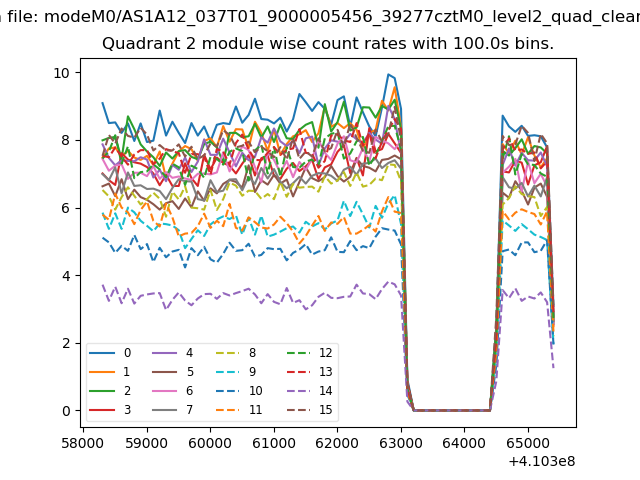
| Module-wise count rates for Quadrant B Data is divided into 100 sec bins |
 |
 |
| Module-wise count rates for Quadrant C Data is divided into 100 sec bins |
 |
 |
| Module-wise count rates for Quadrant D Data is divided into 100 sec bins |
 |
 |
| Parameter | Plot |
|---|---|
| CZT HV Monitor | 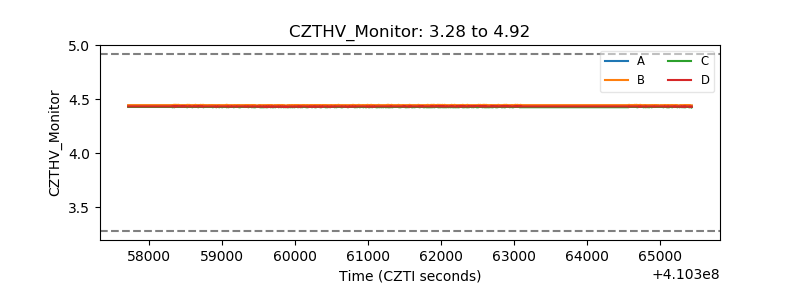 |
| D_VDD | 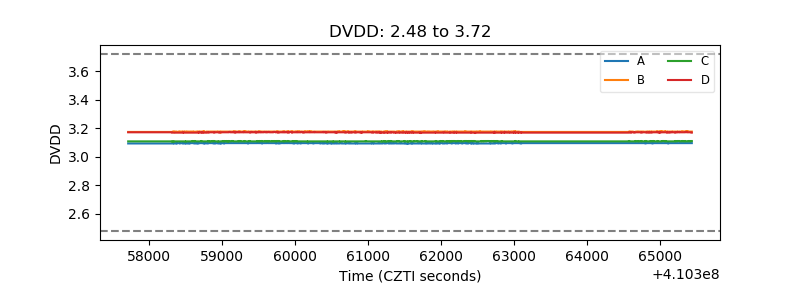 |
| Temperature 1 | 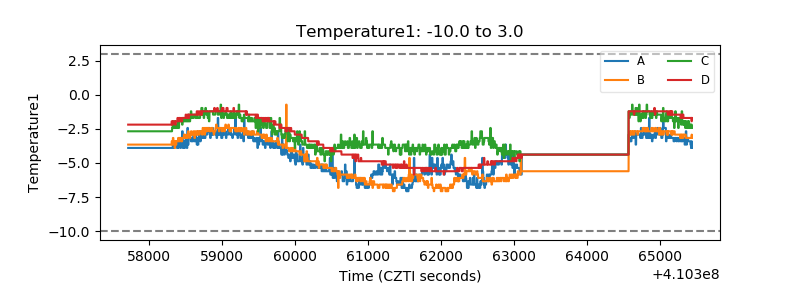 |
| Veto HV Monitor | 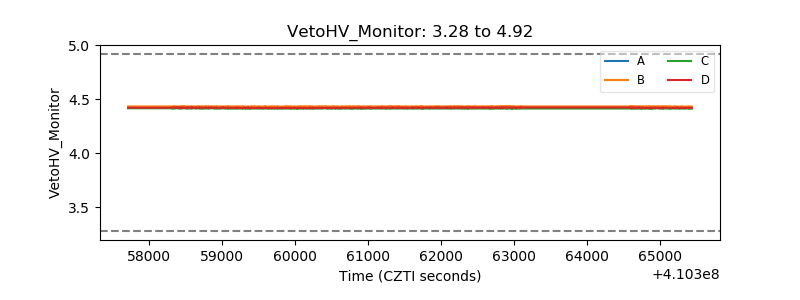 |
| Veto LLD | 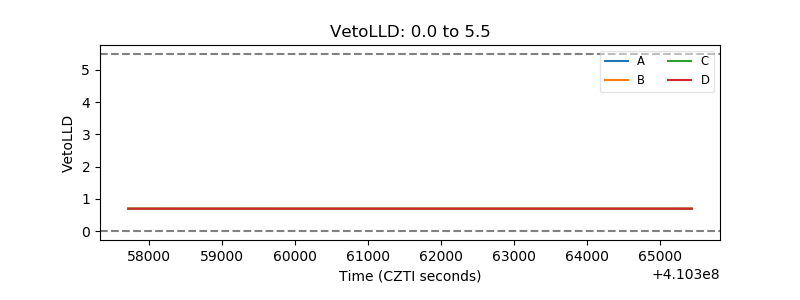 |
| Alpha Counter | 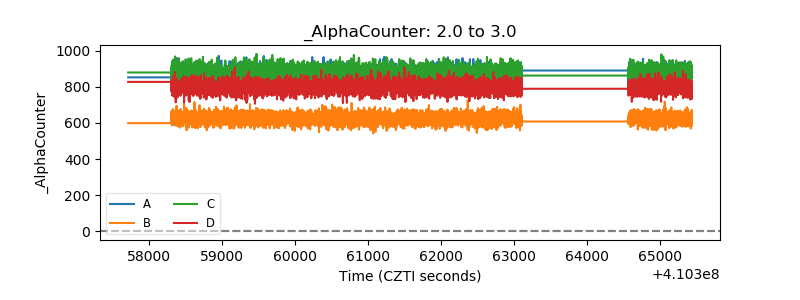 |
| _CPM_Rate | 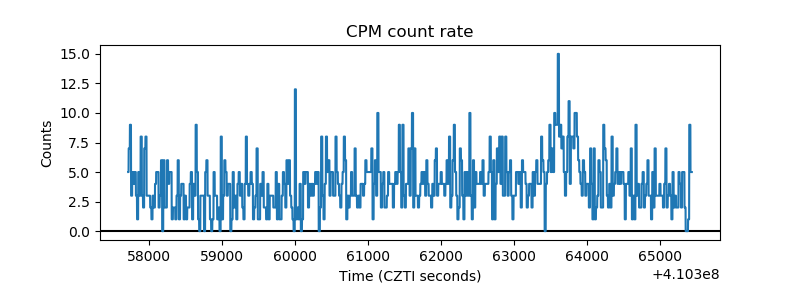 |
| CZT Counter | 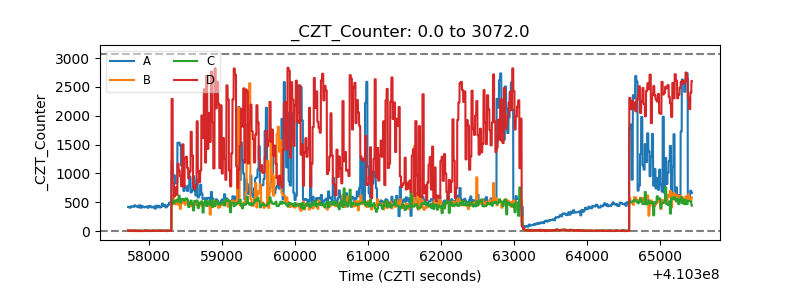 |
| +2.5 Volts monitor | 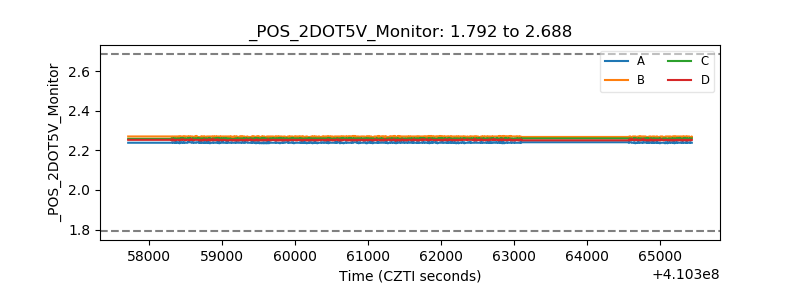 |
| +5 Volts monitor | 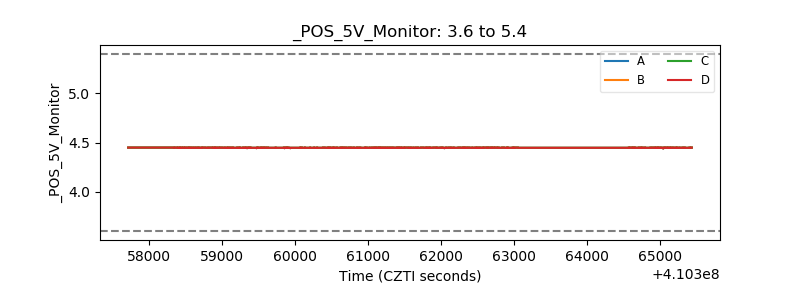 |
| _ROLL_ROT | 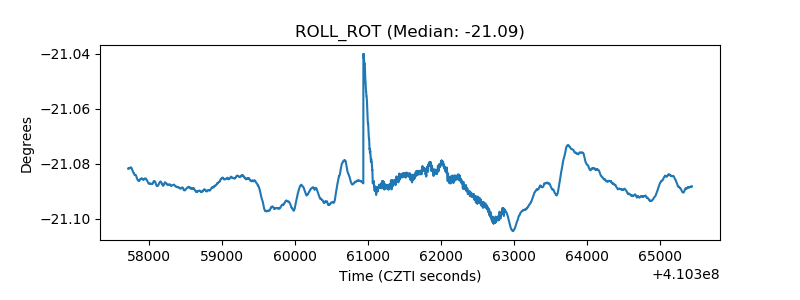 |
| _Roll_DEC | 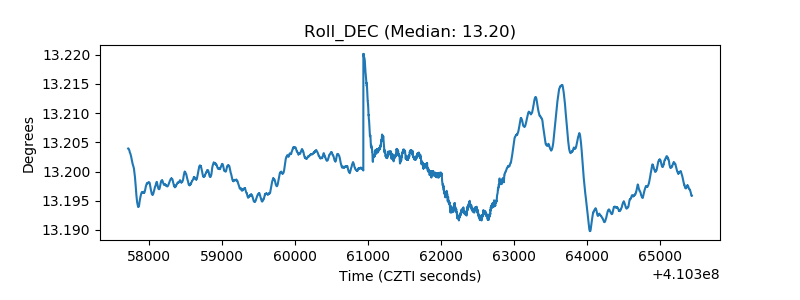 |
| _Roll_RA | 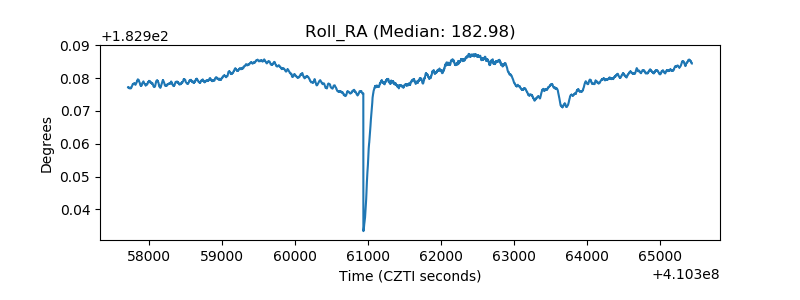 |
| Veto Counter | 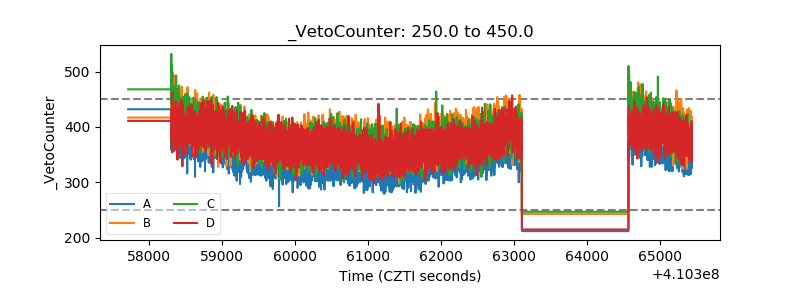 |