| Param | Original file | Final file |
|---|---|---|
| Filename | modeM0/AS1A12_037T01_9000005456_39278cztM0_level2.fits | modeM0/AS1A12_037T01_9000005456_39278cztM0_level2_quad_clean.evt |
| Size (bytes) | 681,232,320 | 80,484,480 |
| Size | 649.7 MB | 76.8 MB |
| Events in quadrant A | 5,849,075 | 564,184 |
| Events in quadrant B | 2,980,810 | 663,584 |
| Events in quadrant C | 2,816,634 | 630,714 |
| Events in quadrant D | 13,116,676 | 169,584 |
| Mode M0 | |||
|---|---|---|---|
| Quadrant | BADHDUFLAG | Total packets | Discarded packets |
| A | 0 | 21231 | 3 |
| B | 0 | 12421 | 2 |
| C | 0 | 11910 | 2 |
| D | 0 | 42940 | 2 |
| Mode SS | |||
|---|---|---|---|
| Quadrant | BADHDUFLAG | Total packets | Discarded packets |
| A | 0 | 120 | 0 |
| B | 0 | 120 | 0 |
| C | 0 | 120 | 0 |
| D | 0 | 120 | 0 |
| Mode M9 | |||
|---|---|---|---|
| Quadrant | BADHDUFLAG | Total packets | Discarded packets |
| A | 0 | 18 | 0 |
| B | 0 | 18 | 0 |
| C | 0 | 18 | 0 |
| D | 0 | 19 | 0 |
| Quadrant | Total seconds | Saturated seconds | Saturation percentage |
|---|---|---|---|
| A | 5840 | 929 | 15.907534% |
| B | 5840 | 13 | 0.222603% |
| C | 5840 | 9 | 0.154110% |
| D | 5840 | 4554 | 77.979452% |
Noise dominated data is calculated using 1-second bins in cleaned event files. If a bin has >2000 counts, and if more than 50% of those come from <1% of pixels, then it is considered to be noise-dominated and hence unusable.
| Quadrant | # 1 sec bins | Bins with >0 counts | Bins with >2000 counts | High rate bins dominated by noise | Noise dominated (total time) | Noise dominated (detector-on time) | Marked lightcurve |
|---|---|---|---|---|---|---|---|
| A | 7151 | 5840 | 756 | 756 | 10.57% | 12.95% | 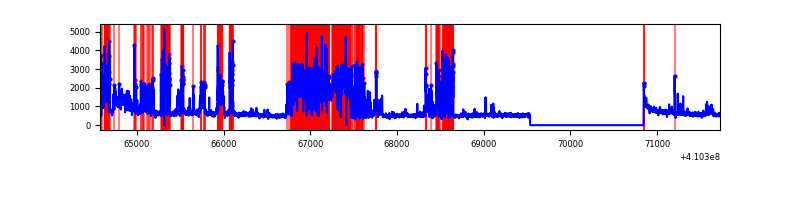 |
| B | 7151 | 5841 | 3 | 3 | 0.04% | 0.05% | 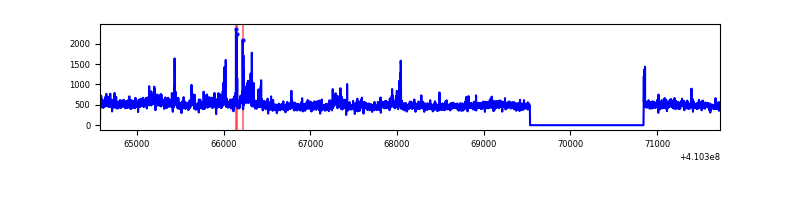 |
| C | 7151 | 5841 | 2 | 2 | 0.03% | 0.03% | 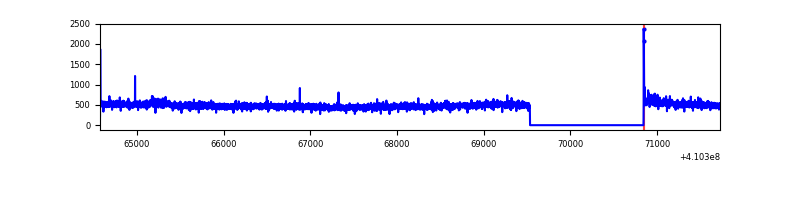 |
| D | 7151 | 5840 | 3406 | 3406 | 47.63% | 58.32% | 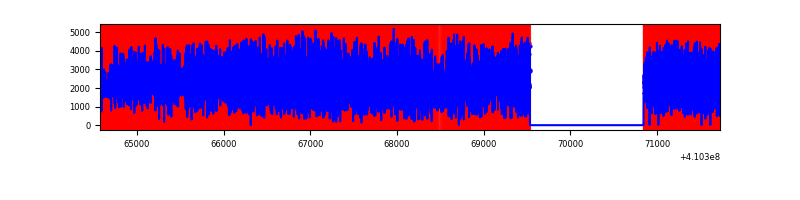 |
Top three noisy pixels from each quadrant. If the there are fewer than three noisy pixels in the level2.evt file, extra rows are filled as -1
| Pixel properties | Quadrant properties | ||||||
|---|---|---|---|---|---|---|---|
| Quadrant | DetID | PixID | Counts | Sigma | Mean | Median | Sigma |
| A | 15 | 222 | 2930327 | 22811.92 | 624 | 613 | 128.4 |
| A | 10 | 83 | 432078 | 3359.56 | 624 | 613 | 128.4 |
| A | 13 | 248 | 44541 | 342.04 | 624 | 613 | 128.4 |
| B | 0 | 189 | 234994 | 1825.91 | 654 | 635 | 128.4 |
| B | 0 | 190 | 141706 | 1099.1 | 654 | 635 | 128.4 |
| B | 5 | 172 | 19144 | 144.21 | 654 | 635 | 128.4 |
| C | 15 | 214 | 243588 | 1591.76 | 646 | 649 | 152.6 |
| C | 3 | 233 | 42237 | 272.49 | 646 | 649 | 152.6 |
| C | 0 | 10 | 11970 | 74.18 | 646 | 649 | 152.6 |
| D | 12 | 235 | 10359830 | 105983.99 | 396 | 385 | 97.7 |
| D | 12 | 227 | 1098570 | 11235.16 | 396 | 385 | 97.7 |
| D | 5 | 222 | 37423 | 378.92 | 396 | 385 | 97.7 |
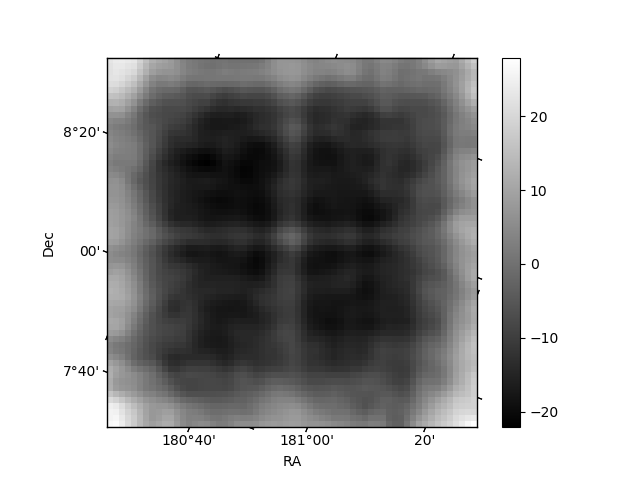
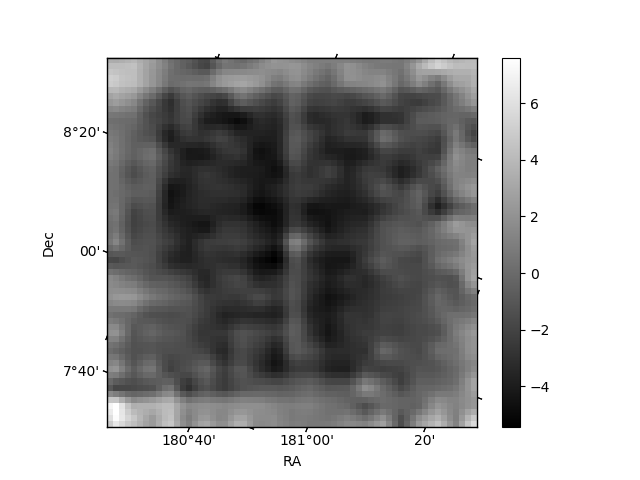
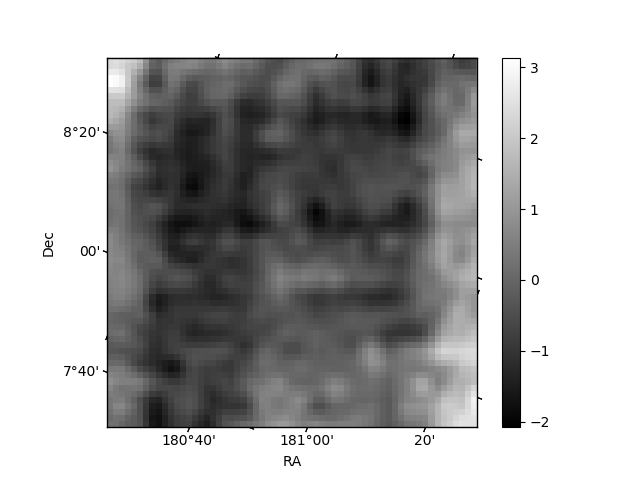
Histogram calculated using DETX and DETY for each event in the final _common_clean file
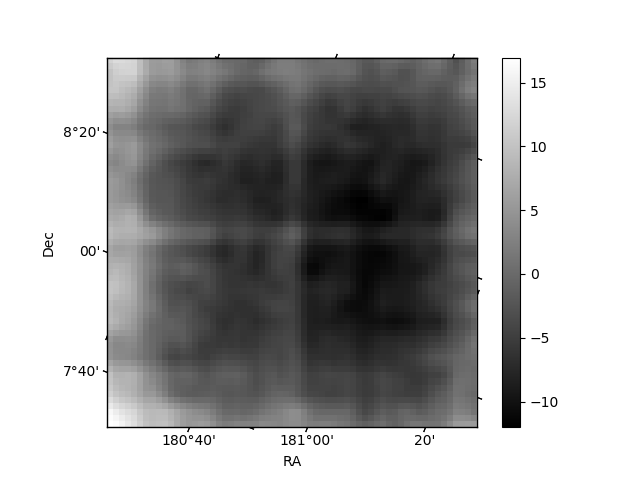
| Quadrant A | 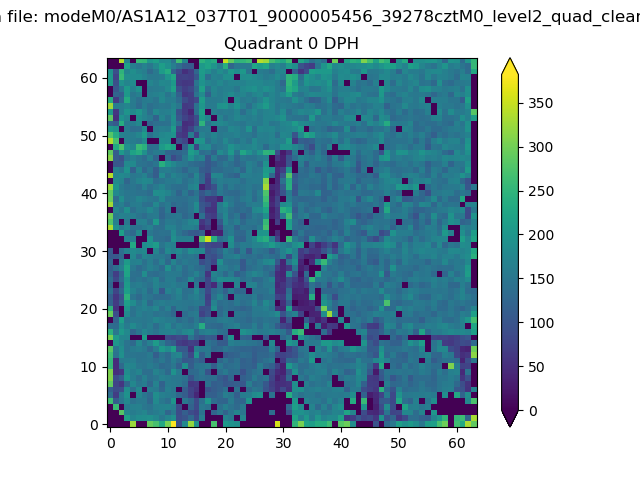 |
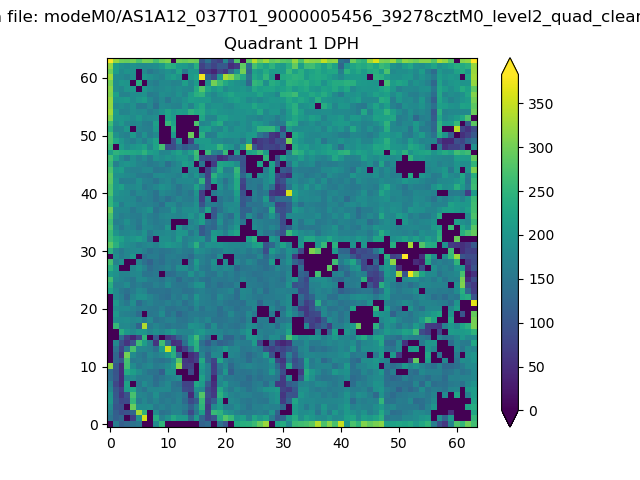 |
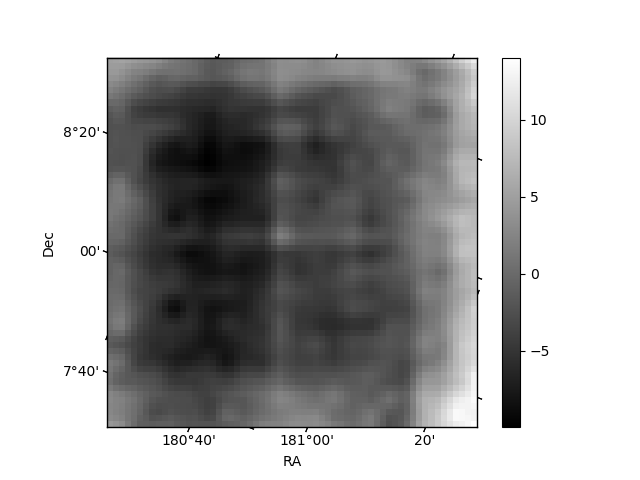
Quadrant B |
|---|---|---|---|
| Quadrant D | 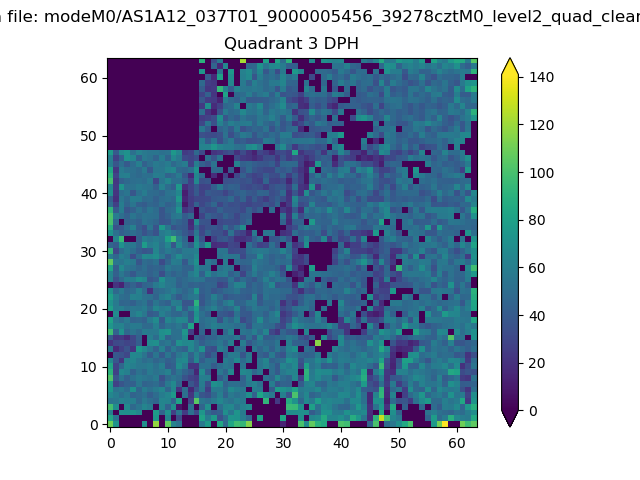 |
 |
Quadrant C |
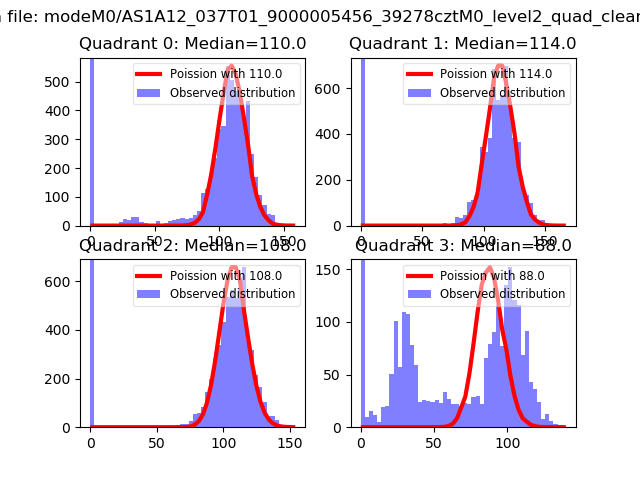
| Plot type | Count rate plots | Images |
|---|---|---|
| Comparison with Poisson distribution Blue bars denote a histogram of data divided into 1 sec bins. Red curve is a Poisson curve with rate = median count rate of data. |
 |
 |
| Quadrant-wise count rates Data is divided into 100 sec bins |
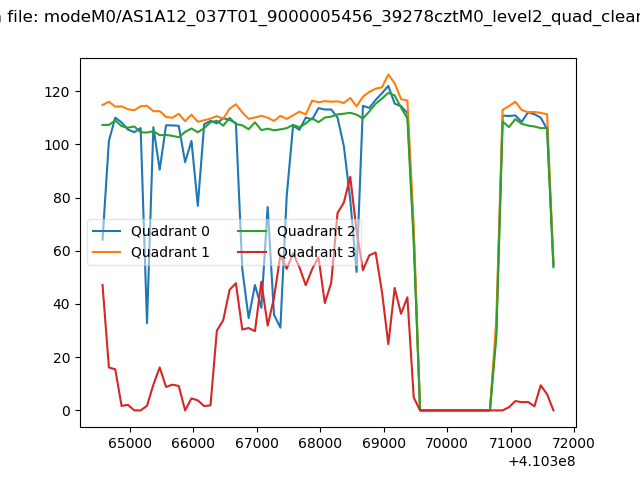 |
|
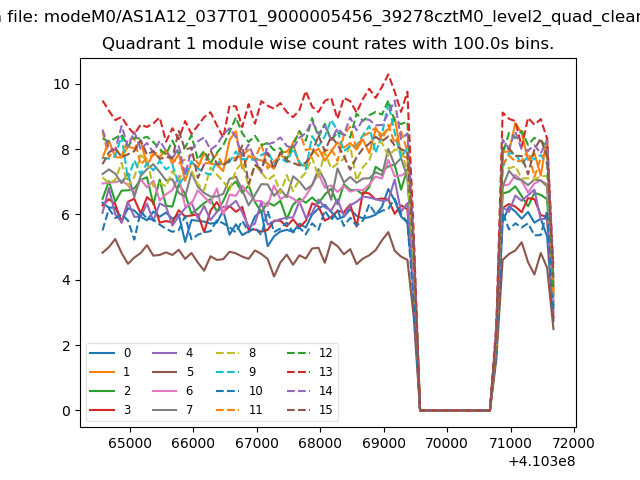
| Module-wise count rates for Quadrant A Data is divided into 100 sec bins |
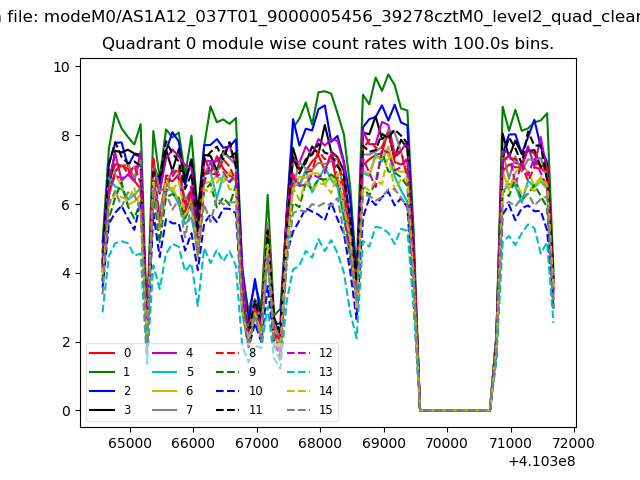 |
 |
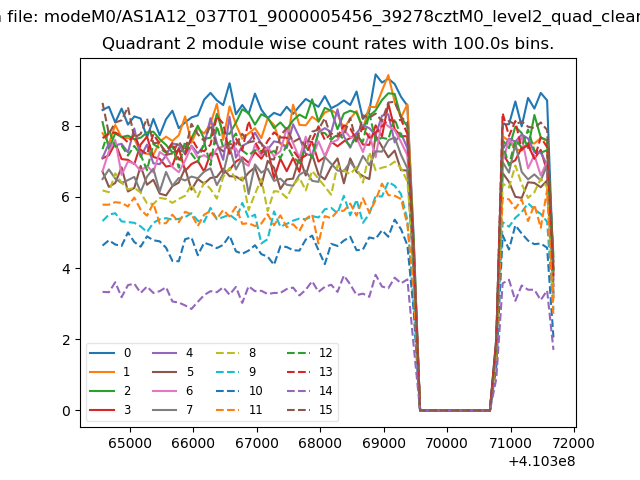
| Module-wise count rates for Quadrant B Data is divided into 100 sec bins |
 |
 |
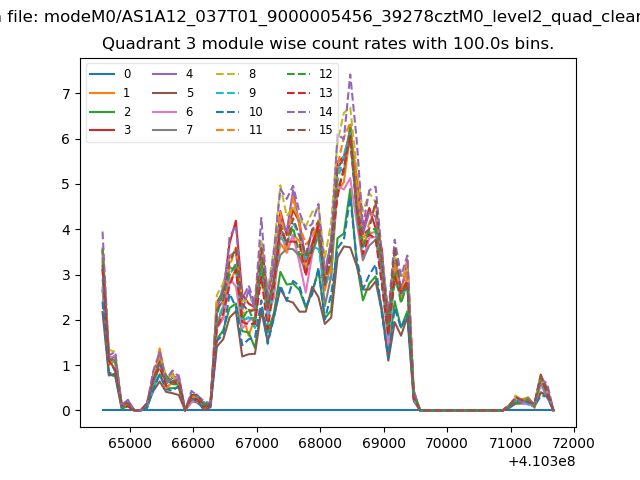
| Module-wise count rates for Quadrant C Data is divided into 100 sec bins |
 |
 |
| Module-wise count rates for Quadrant D Data is divided into 100 sec bins |
 |
 |
| Parameter | Plot |
|---|---|
| CZT HV Monitor | 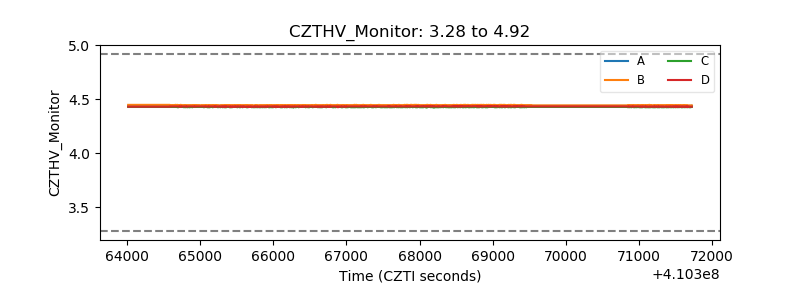 |
| D_VDD | 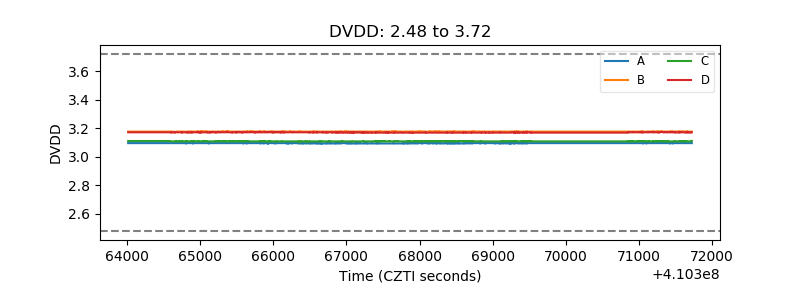 |
| Temperature 1 | 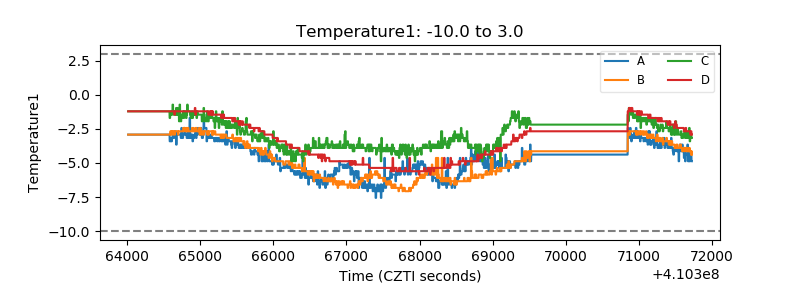 |
| Veto HV Monitor | 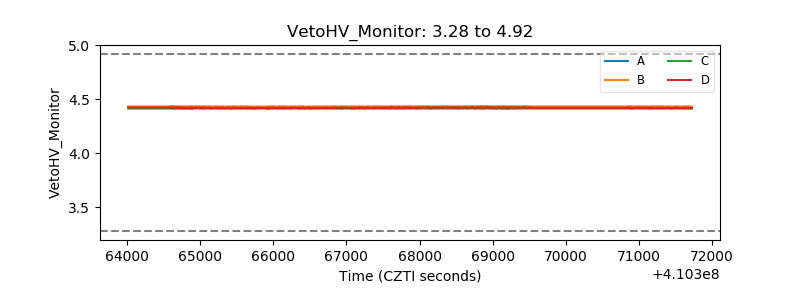 |
| Veto LLD | 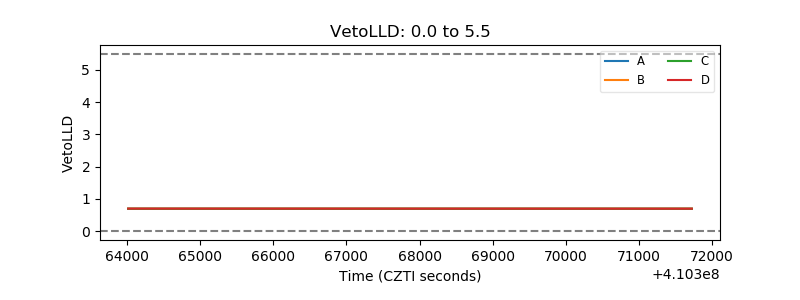 |
| Alpha Counter | 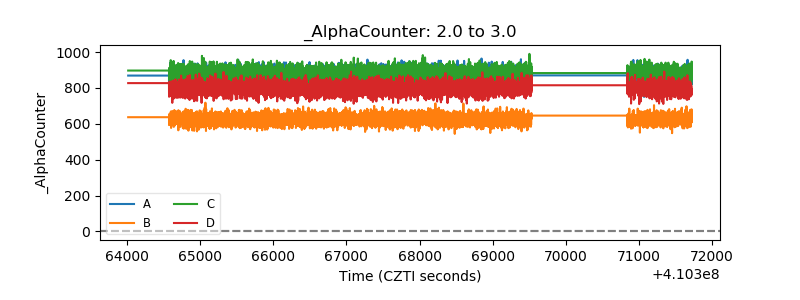 |
| _CPM_Rate | 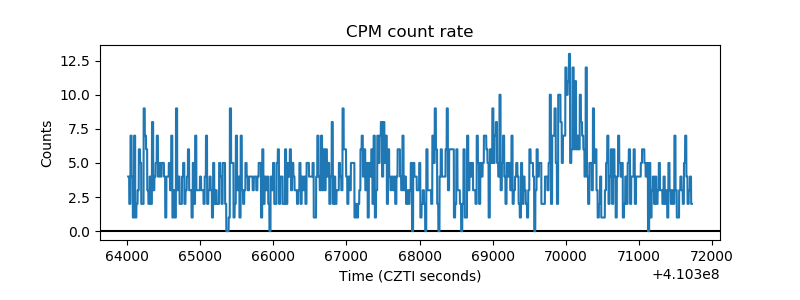 |
| CZT Counter | 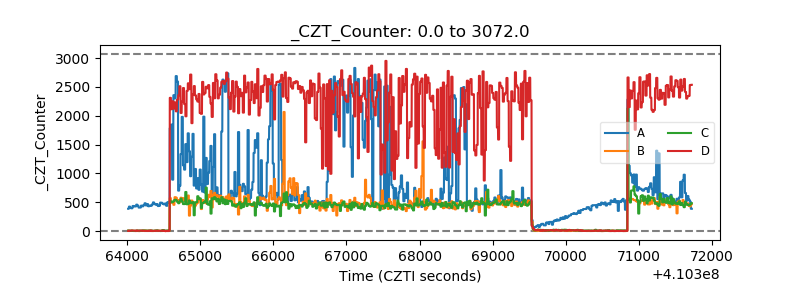 |
| +2.5 Volts monitor | 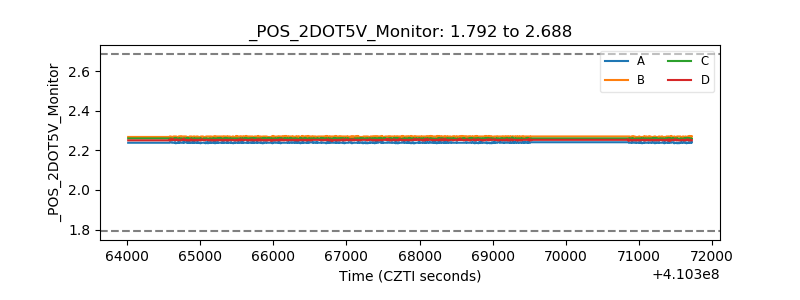 |
| +5 Volts monitor | 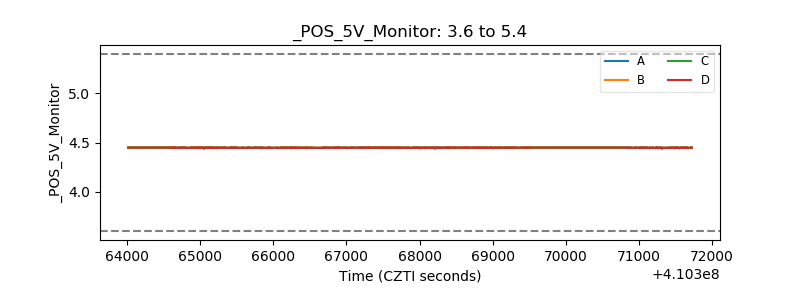 |
| _ROLL_ROT | 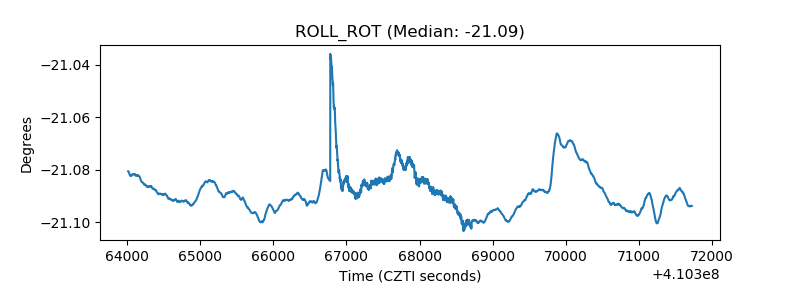 |
| _Roll_DEC | 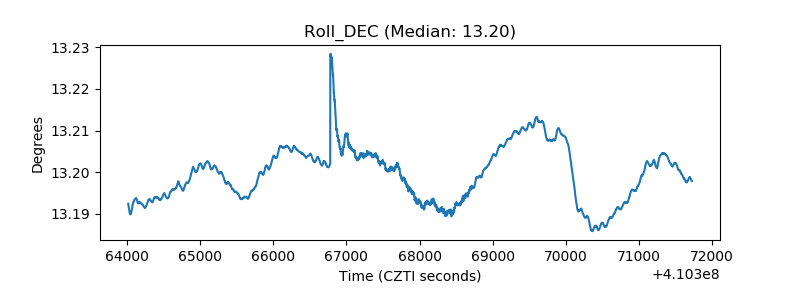 |
| _Roll_RA | 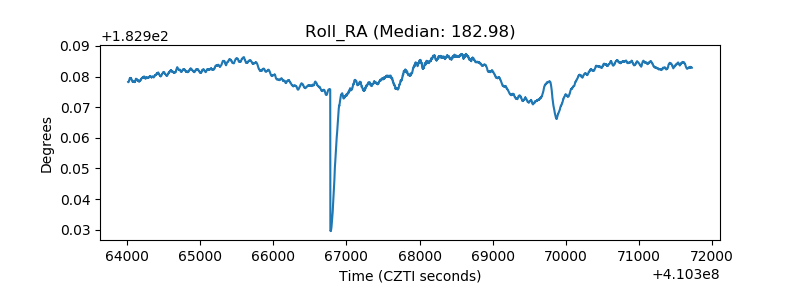 |
| Veto Counter | 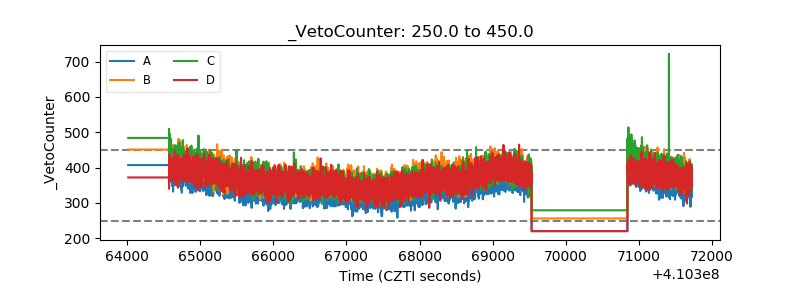 |