| Param | Original file | Final file |
|---|---|---|
| Filename | modeM0/AS1A12_037T01_9000005456_39284cztM0_level2.fits | modeM0/AS1A12_037T01_9000005456_39284cztM0_level2_quad_clean.evt |
| Size (bytes) | 591,500,160 | 109,555,200 |
| Size | 564.1 MB | 104.5 MB |
| Events in quadrant A | 3,912,544 | 782,897 |
| Events in quadrant B | 3,350,229 | 799,043 |
| Events in quadrant C | 3,427,960 | 764,916 |
| Events in quadrant D | 10,661,728 | 483,619 |
| Mode M0 | |||
|---|---|---|---|
| Quadrant | BADHDUFLAG | Total packets | Discarded packets |
| A | 0 | 15973 | 1 |
| B | 0 | 14560 | 1 |
| C | 0 | 14390 | 1 |
| D | 0 | 36528 | 1 |
| Mode SS | |||
|---|---|---|---|
| Quadrant | BADHDUFLAG | Total packets | Discarded packets |
| A | 0 | 142 | 0 |
| B | 0 | 142 | 0 |
| C | 0 | 142 | 0 |
| D | 0 | 142 | 0 |
| Mode M9 | |||
|---|---|---|---|
| Quadrant | BADHDUFLAG | Total packets | Discarded packets |
| A | 0 | 28 | 0 |
| B | 0 | 28 | 0 |
| C | 0 | 28 | 0 |
| D | 0 | 28 | 0 |
| Quadrant | Total seconds | Saturated seconds | Saturation percentage |
|---|---|---|---|
| A | 6991 | 26 | 0.371907% |
| B | 6991 | 43 | 0.615077% |
| C | 6991 | 11 | 0.157345% |
| D | 6991 | 2542 | 36.361036% |
Noise dominated data is calculated using 1-second bins in cleaned event files. If a bin has >2000 counts, and if more than 50% of those come from <1% of pixels, then it is considered to be noise-dominated and hence unusable.
| Quadrant | # 1 sec bins | Bins with >0 counts | Bins with >2000 counts | High rate bins dominated by noise | Noise dominated (total time) | Noise dominated (detector-on time) | Marked lightcurve |
|---|---|---|---|---|---|---|---|
| A | 9678 | 6993 | 11 | 11 | 0.11% | 0.16% | 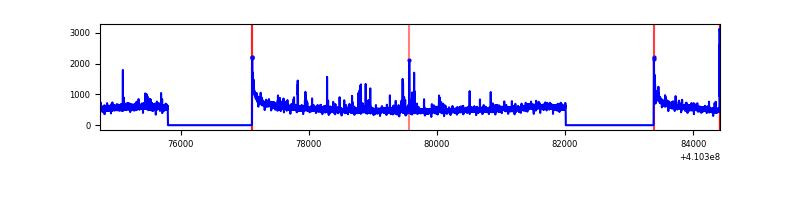 |
| B | 9678 | 6993 | 15 | 15 | 0.15% | 0.21% | 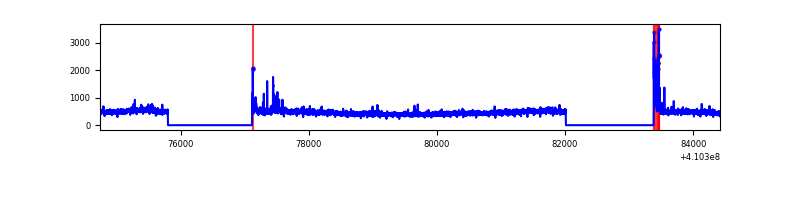 |
| C | 9678 | 6993 | 5 | 5 | 0.05% | 0.07% | 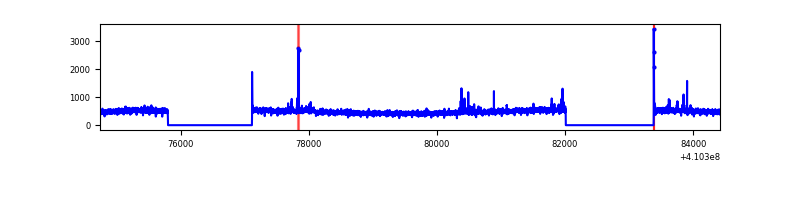 |
| D | 9678 | 6993 | 2014 | 2014 | 20.81% | 28.80% | 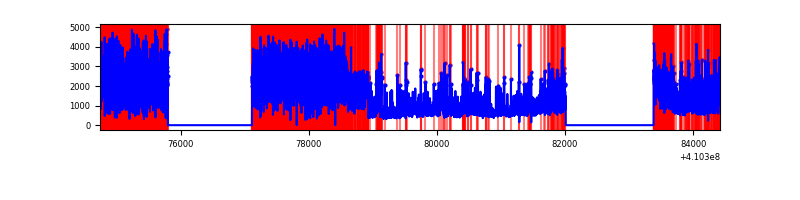 |
Top three noisy pixels from each quadrant. If the there are fewer than three noisy pixels in the level2.evt file, extra rows are filled as -1
| Pixel properties | Quadrant properties | ||||||
|---|---|---|---|---|---|---|---|
| Quadrant | DetID | PixID | Counts | Sigma | Mean | Median | Sigma |
| A | 10 | 83 | 499182 | 3039.87 | 799 | 783 | 164.0 |
| A | 15 | 222 | 288735 | 1756.3 | 799 | 783 | 164.0 |
| A | 2 | 79 | 25734 | 152.18 | 799 | 783 | 164.0 |
| B | 5 | 172 | 143123 | 911.82 | 790 | 768 | 156.1 |
| B | 0 | 189 | 47297 | 298.03 | 790 | 768 | 156.1 |
| B | 0 | 190 | 22075 | 136.48 | 790 | 768 | 156.1 |
| C | 15 | 214 | 290447 | 1578.32 | 779 | 785 | 183.5 |
| C | 9 | 187 | 53104 | 285.08 | 779 | 785 | 183.5 |
| C | 3 | 233 | 21602 | 113.43 | 779 | 785 | 183.5 |
| D | 12 | 235 | 6597660 | 40932.76 | 656 | 638 | 161.2 |
| D | 12 | 227 | 1134095 | 7032.8 | 656 | 638 | 161.2 |
| D | 5 | 222 | 181604 | 1122.85 | 656 | 638 | 161.2 |
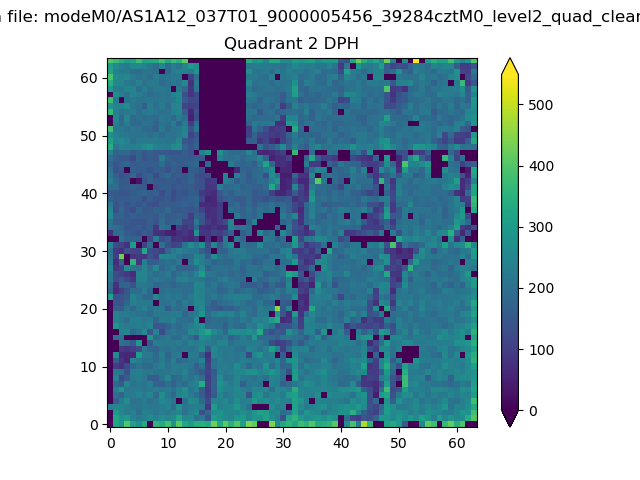
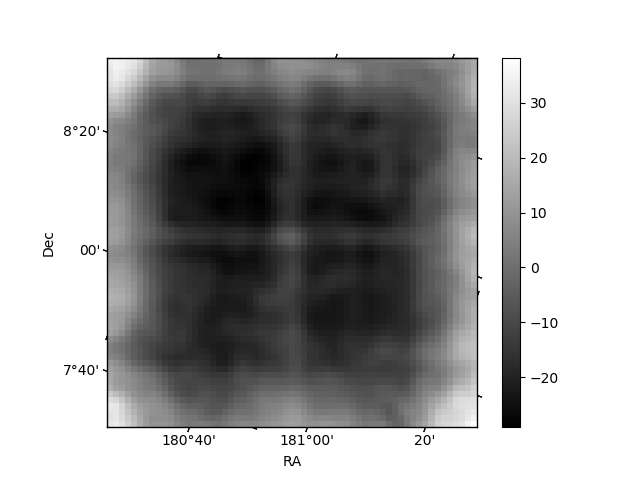
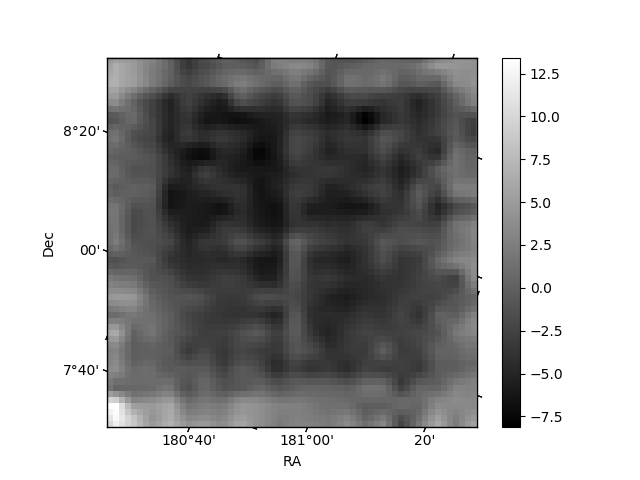
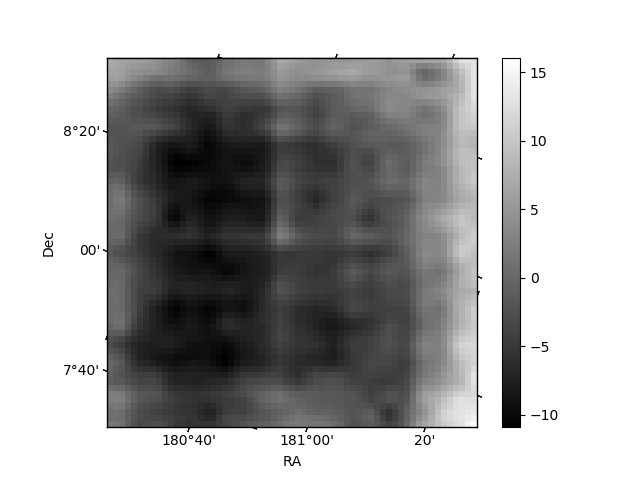
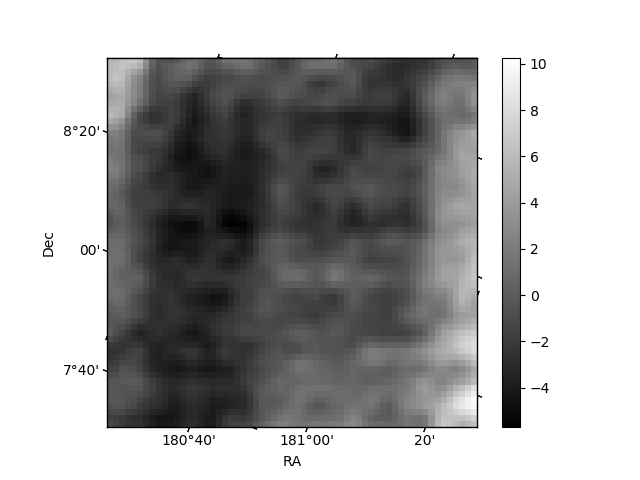
Histogram calculated using DETX and DETY for each event in the final _common_clean file
| Quadrant A | 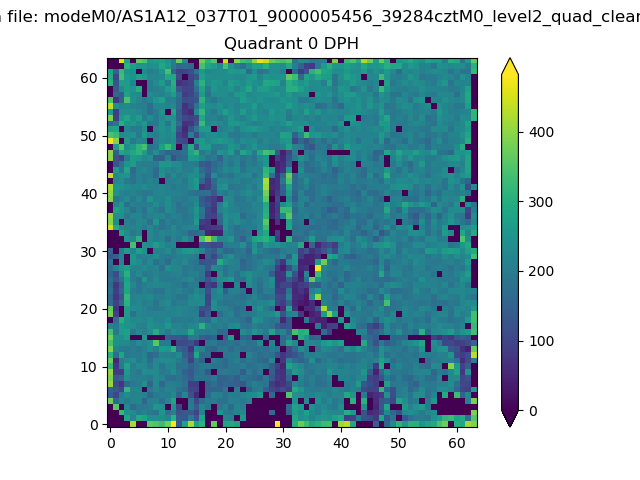 |
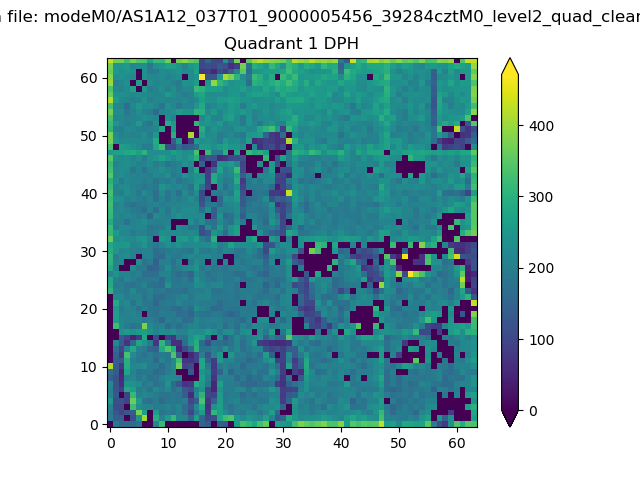 |
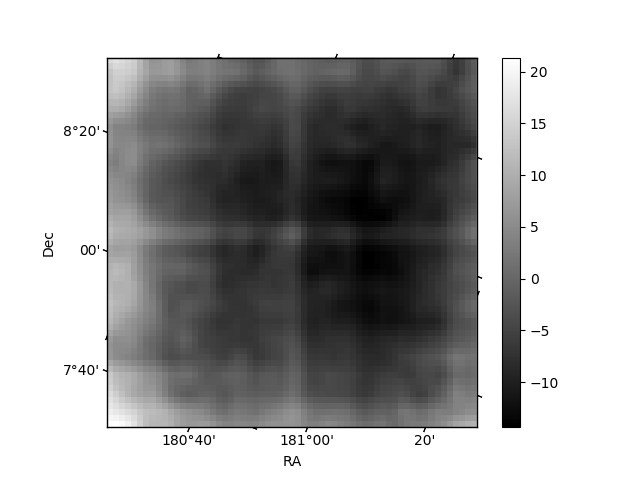
Quadrant B |
|---|---|---|---|
| Quadrant D | 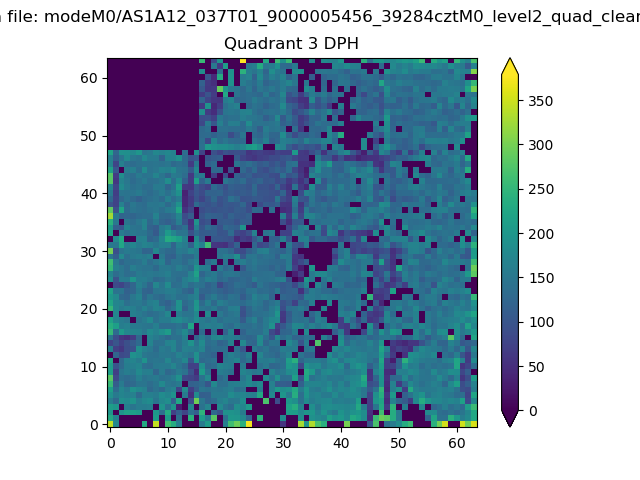 |
 |
Quadrant C |
| Plot type | Count rate plots | Images |
|---|---|---|
| Comparison with Poisson distribution Blue bars denote a histogram of data divided into 1 sec bins. Red curve is a Poisson curve with rate = median count rate of data. |
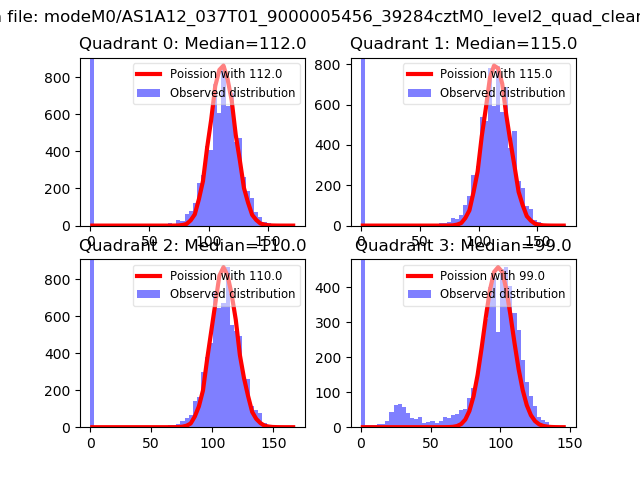 |
 |
| Quadrant-wise count rates Data is divided into 100 sec bins |
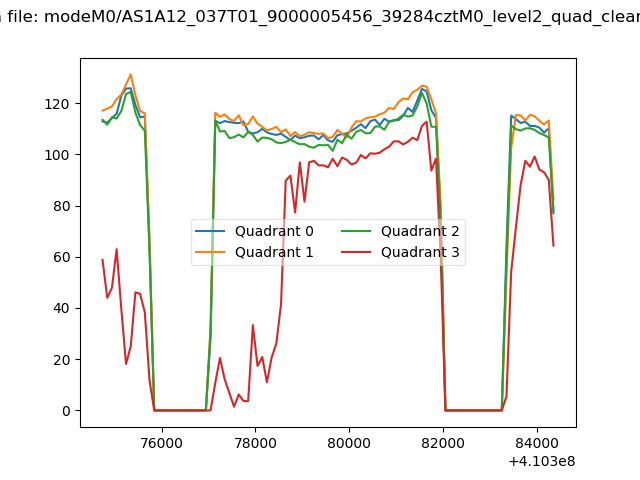 |
|
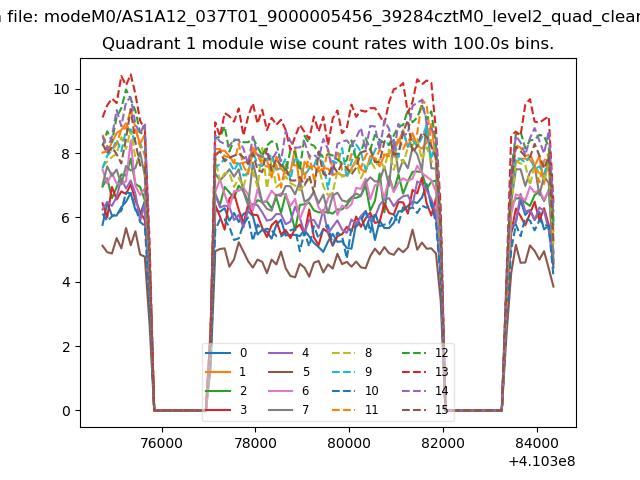
| Module-wise count rates for Quadrant A Data is divided into 100 sec bins |
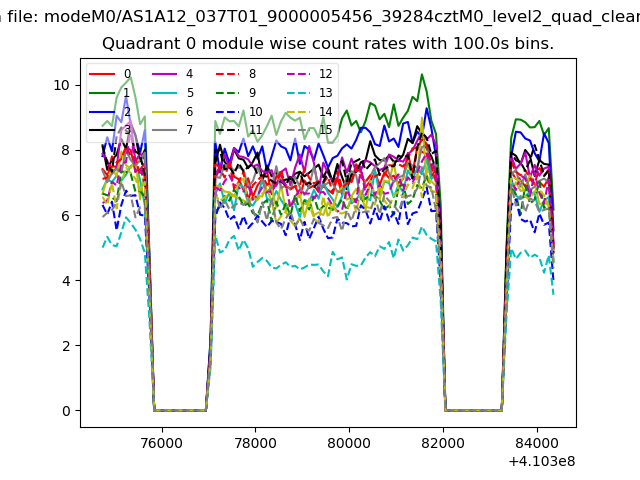 |
 |
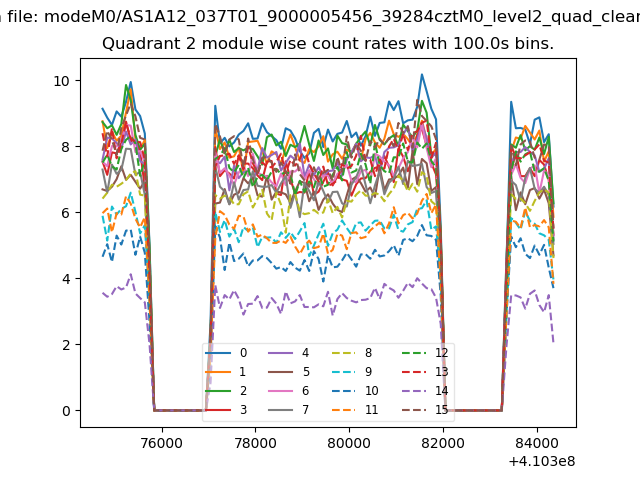
| Module-wise count rates for Quadrant B Data is divided into 100 sec bins |
 |
 |
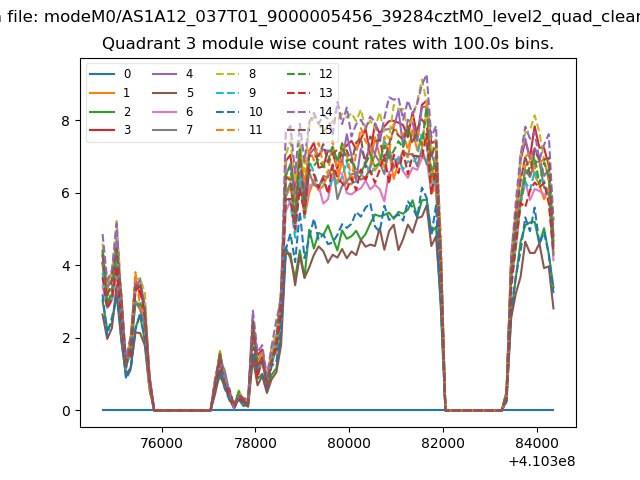
| Module-wise count rates for Quadrant C Data is divided into 100 sec bins |
 |
 |
| Module-wise count rates for Quadrant D Data is divided into 100 sec bins |
 |
 |
| Parameter | Plot |
|---|---|
| CZT HV Monitor |  |
| D_VDD | 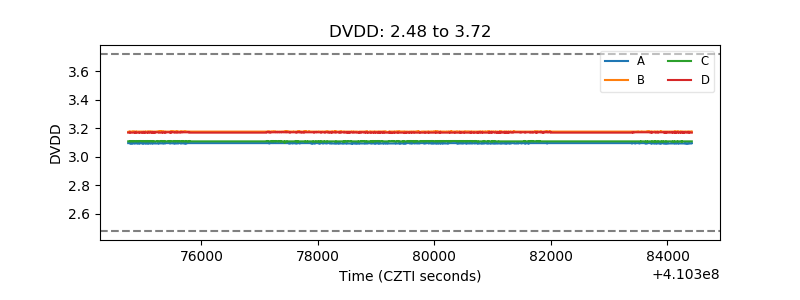 |
| Temperature 1 | 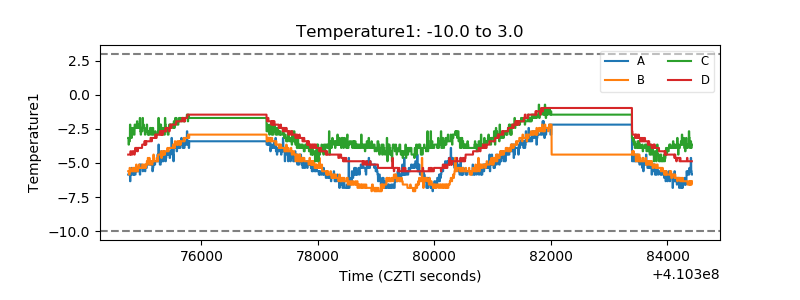 |
| Veto HV Monitor | 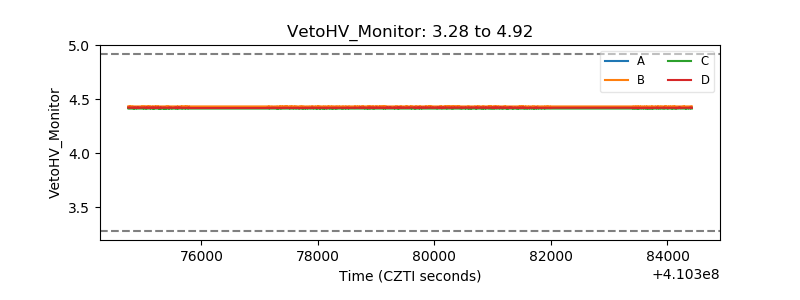 |
| Veto LLD | 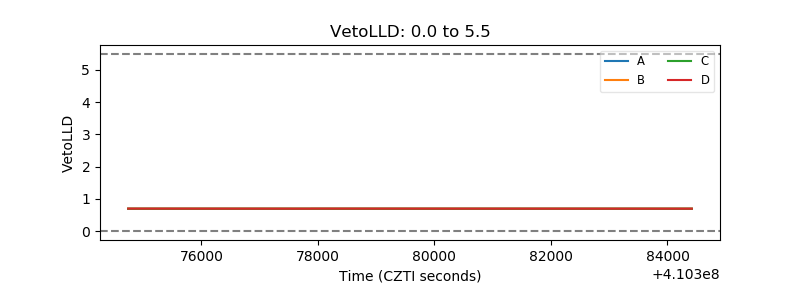 |
| Alpha Counter | 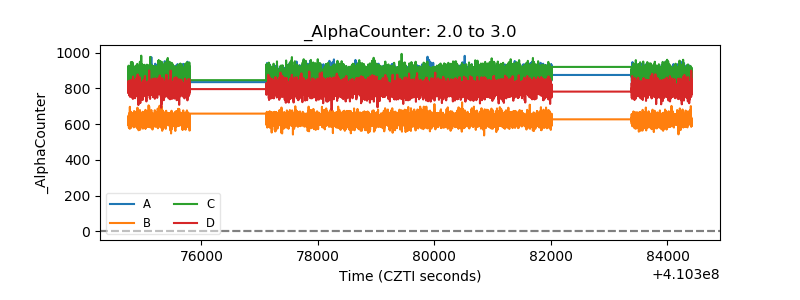 |
| _CPM_Rate | 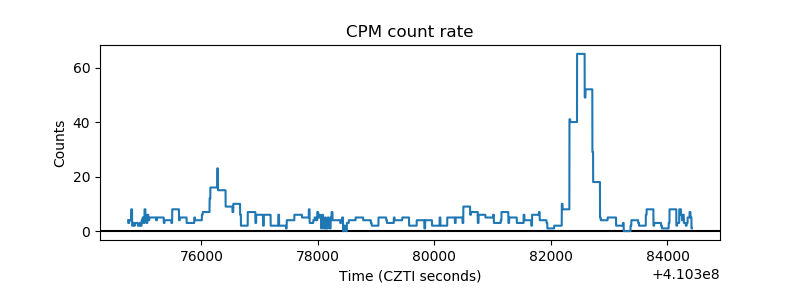 |
| CZT Counter | 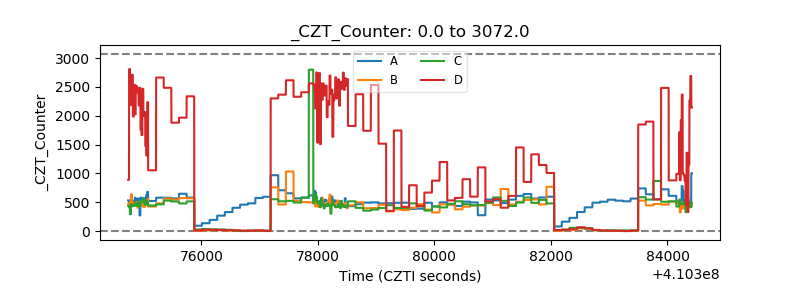 |
| +2.5 Volts monitor | 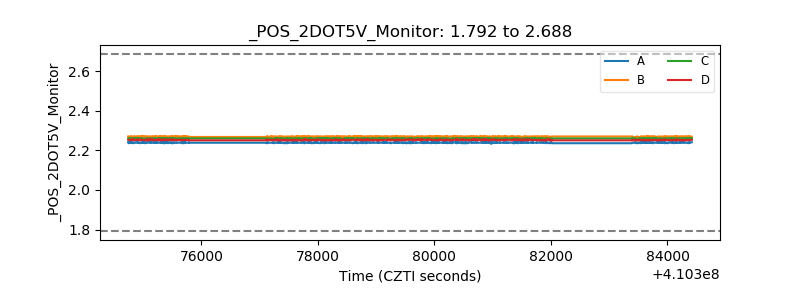 |
| +5 Volts monitor | 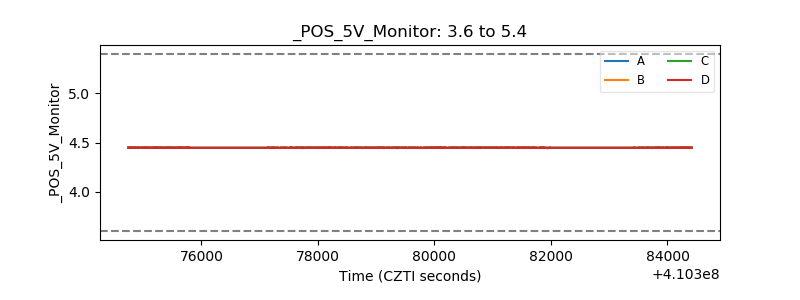 |
| _ROLL_ROT | 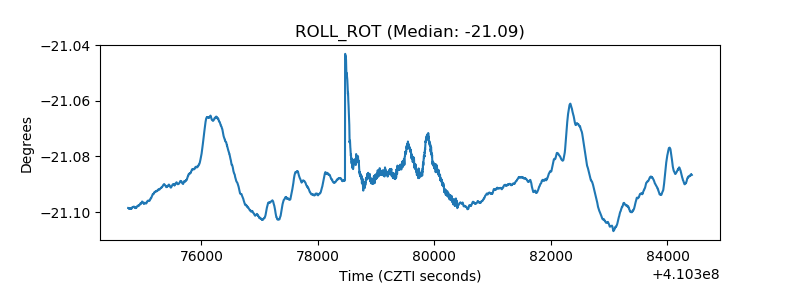 |
| _Roll_DEC | 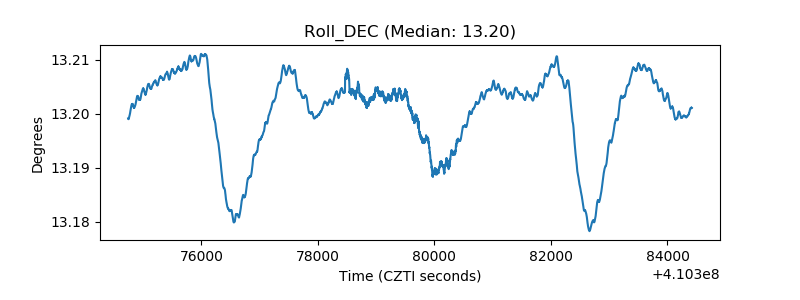 |
| _Roll_RA | 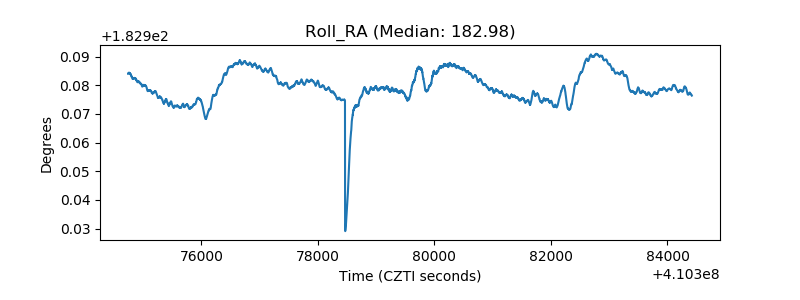 |
| Veto Counter | 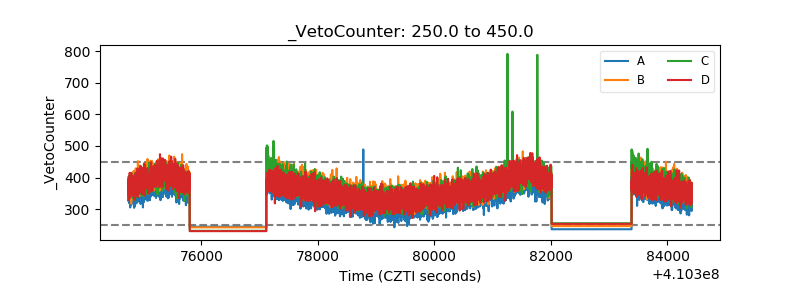 |