| Param | Original file | Final file |
|---|---|---|
| Filename | modeM0/AS1A12_025T12_9000005458_39284cztM0_level2.fits | modeM0/AS1A12_025T12_9000005458_39284cztM0_level2_quad_clean.evt |
| Size (bytes) | 964,552,320 | 224,323,200 |
| Size | 919.9 MB | 213.9 MB |
| Events in quadrant A | 7,479,690 | 1,516,362 |
| Events in quadrant B | 6,809,129 | 1,557,193 |
| Events in quadrant C | 6,522,554 | 1,487,550 |
| Events in quadrant D | 13,827,324 | 1,279,540 |
| Mode SS | |||
|---|---|---|---|
| Quadrant | BADHDUFLAG | Total packets | Discarded packets |
| A | 0 | 282 | 0 |
| B | 0 | 282 | 0 |
| C | 0 | 282 | 0 |
| D | 0 | 282 | 0 |
| Mode M0 | |||
|---|---|---|---|
| Quadrant | BADHDUFLAG | Total packets | Discarded packets |
| A | 0 | 31124 | 4 |
| B | 0 | 29729 | 3 |
| C | 0 | 28117 | 3 |
| D | 0 | 50657 | 3 |
| Mode M9 | |||
|---|---|---|---|
| Quadrant | BADHDUFLAG | Total packets | Discarded packets |
| A | 0 | 48 | 0 |
| B | 0 | 48 | 0 |
| C | 0 | 48 | 0 |
| D | 0 | 48 | 0 |
| Quadrant | Total seconds | Saturated seconds | Saturation percentage |
|---|---|---|---|
| A | 13775 | 67 | 0.486388% |
| B | 13775 | 88 | 0.638838% |
| C | 13775 | 14 | 0.101633% |
| D | 13775 | 1317 | 9.560799% |
Noise dominated data is calculated using 1-second bins in cleaned event files. If a bin has >2000 counts, and if more than 50% of those come from <1% of pixels, then it is considered to be noise-dominated and hence unusable.
| Quadrant | # 1 sec bins | Bins with >0 counts | Bins with >2000 counts | High rate bins dominated by noise | Noise dominated (total time) | Noise dominated (detector-on time) | Marked lightcurve |
|---|---|---|---|---|---|---|---|
| A | 18583 | 13778 | 48 | 48 | 0.26% | 0.35% | 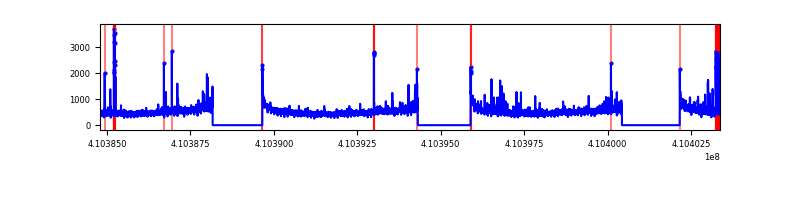 |
| B | 18583 | 13778 | 37 | 37 | 0.20% | 0.27% | 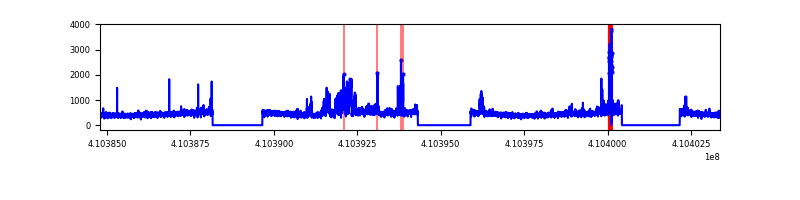 |
| C | 18583 | 13778 | 6 | 6 | 0.03% | 0.04% | 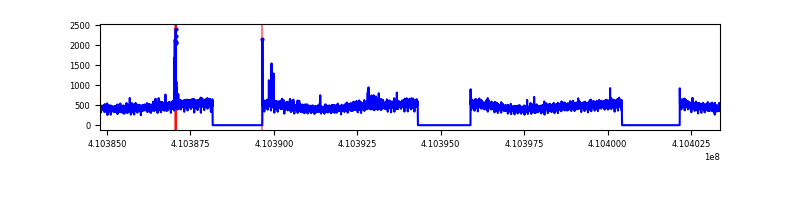 |
| D | 18583 | 13778 | 1182 | 1182 | 6.36% | 8.58% | 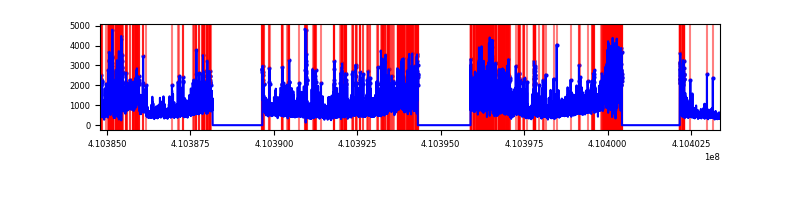 |
Top three noisy pixels from each quadrant. If the there are fewer than three noisy pixels in the level2.evt file, extra rows are filled as -1
| Pixel properties | Quadrant properties | ||||||
|---|---|---|---|---|---|---|---|
| Quadrant | DetID | PixID | Counts | Sigma | Mean | Median | Sigma |
| A | 10 | 83 | 892774 | 2870.35 | 1530 | 1498 | 310.5 |
| A | 15 | 222 | 647155 | 2079.34 | 1530 | 1498 | 310.5 |
| A | 3 | 1 | 25776 | 78.19 | 1530 | 1498 | 310.5 |
| B | 5 | 184 | 602372 | 2054.63 | 1518 | 1473 | 292.5 |
| B | 5 | 172 | 213694 | 725.64 | 1518 | 1473 | 292.5 |
| B | 12 | 111 | 37756 | 124.06 | 1518 | 1473 | 292.5 |
| C | 15 | 214 | 570608 | 1631.64 | 1496 | 1504 | 348.8 |
| C | 9 | 187 | 70919 | 199.02 | 1496 | 1504 | 348.8 |
| C | 3 | 233 | 27753 | 75.26 | 1496 | 1504 | 348.8 |
| D | 12 | 235 | 6504880 | 18716.06 | 1428 | 1387 | 347.5 |
| D | 1 | 47 | 438572 | 1258.15 | 1428 | 1387 | 347.5 |
| D | 5 | 222 | 437350 | 1254.63 | 1428 | 1387 | 347.5 |
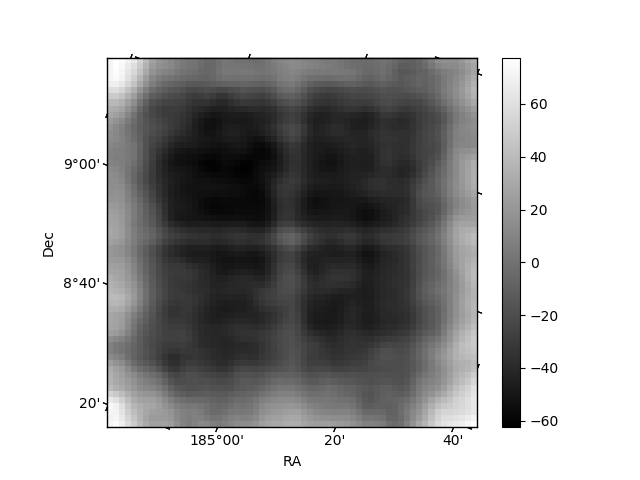
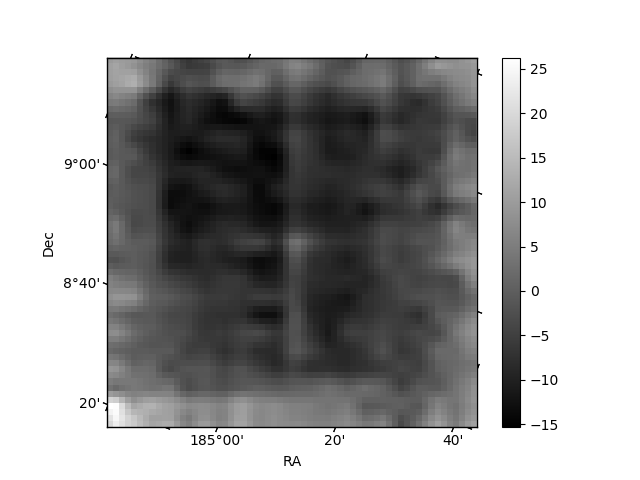
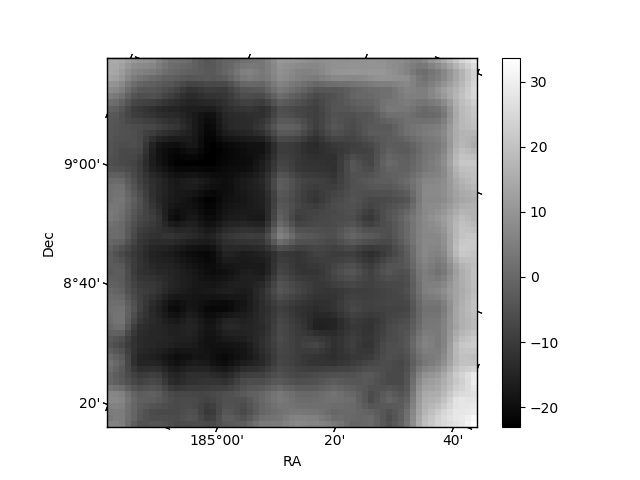
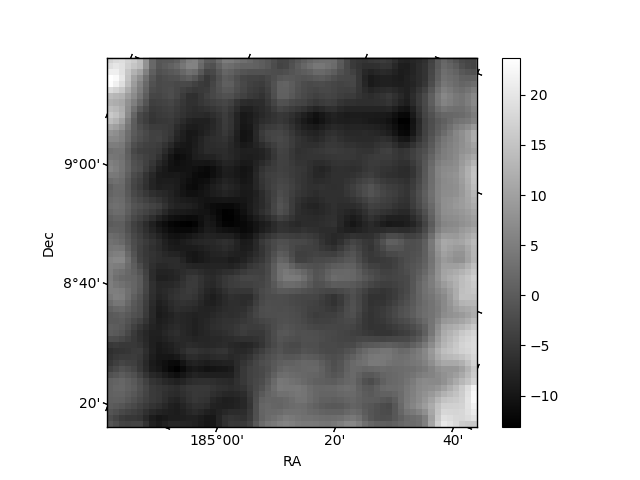
Histogram calculated using DETX and DETY for each event in the final _common_clean file
| Quadrant A | 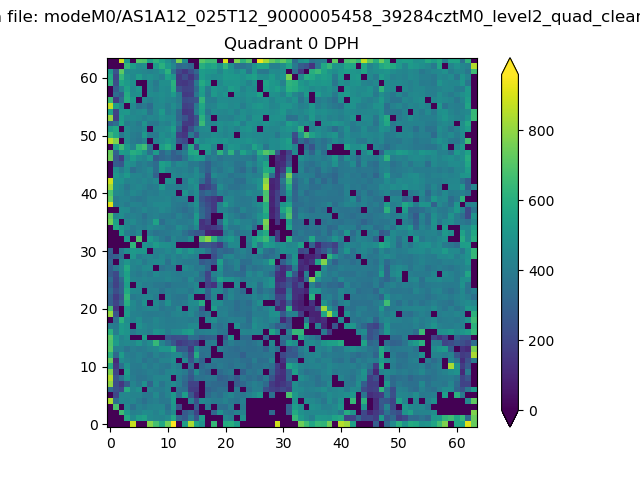 |
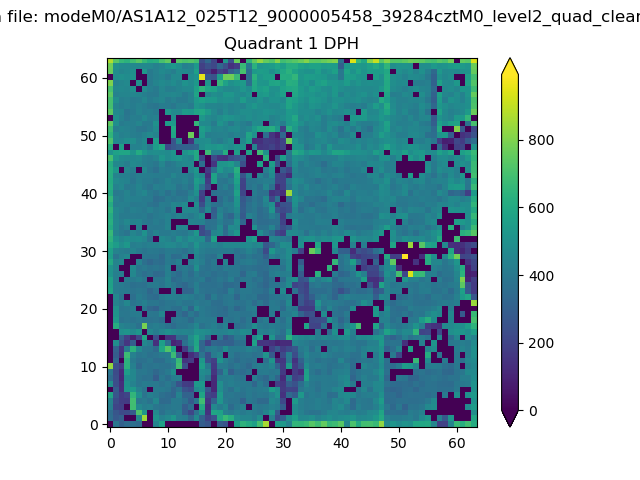 |
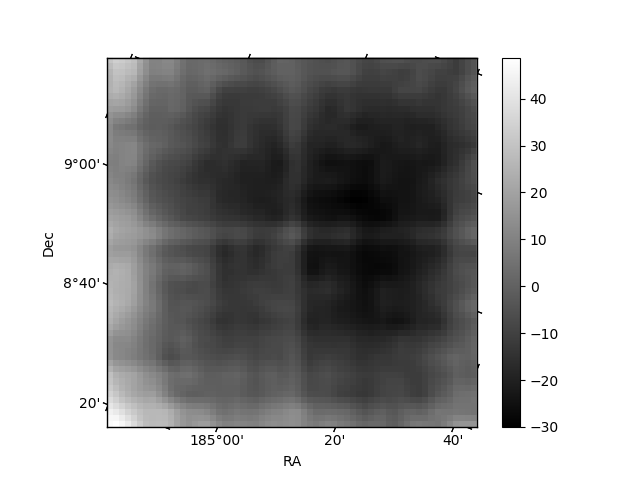
Quadrant B |
|---|---|---|---|
| Quadrant D | 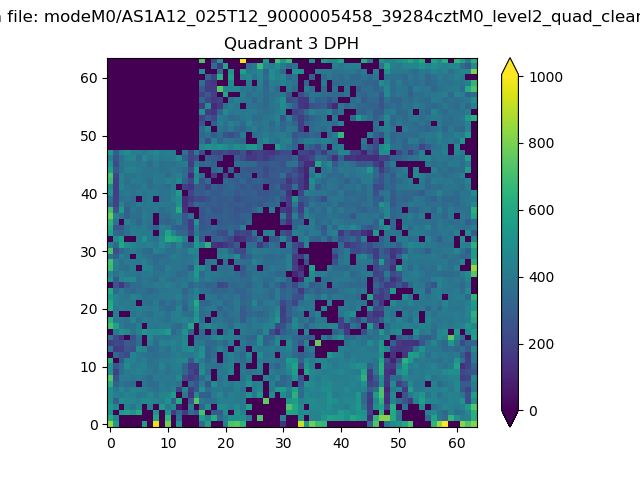 |
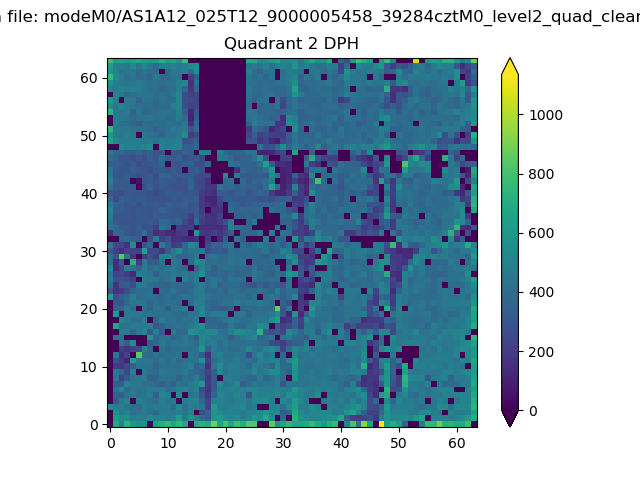 |
Quadrant C |
| Plot type | Count rate plots | Images |
|---|---|---|
| Comparison with Poisson distribution Blue bars denote a histogram of data divided into 1 sec bins. Red curve is a Poisson curve with rate = median count rate of data. |
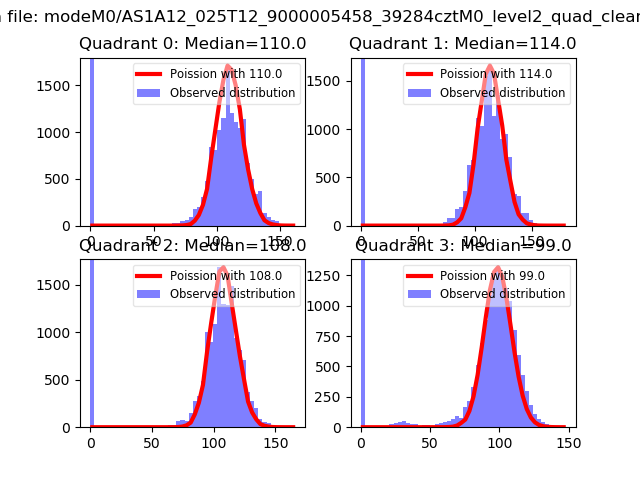 |
 |
| Quadrant-wise count rates Data is divided into 100 sec bins |
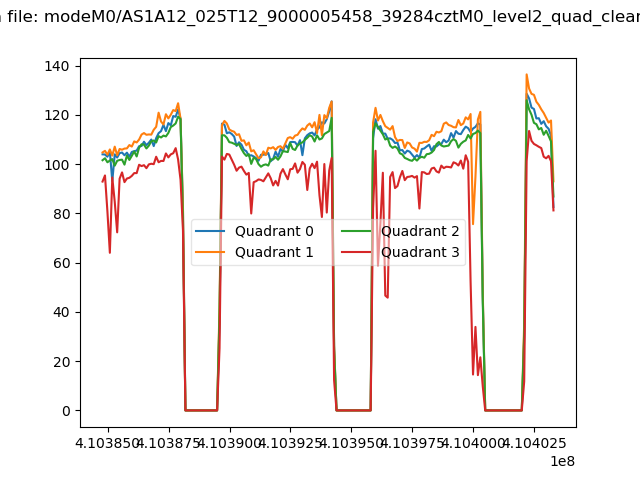 |
|
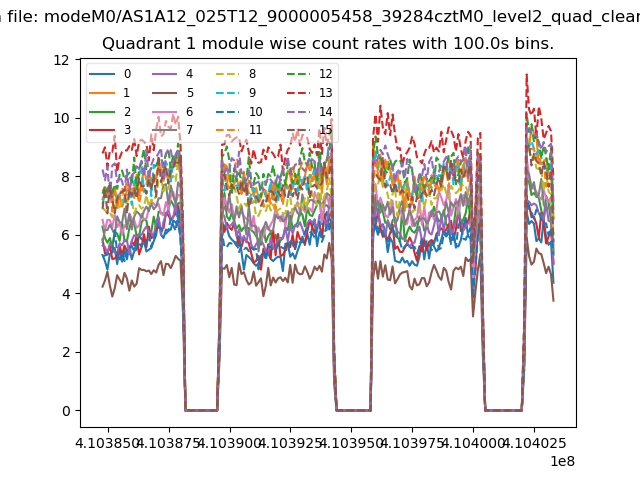
| Module-wise count rates for Quadrant A Data is divided into 100 sec bins |
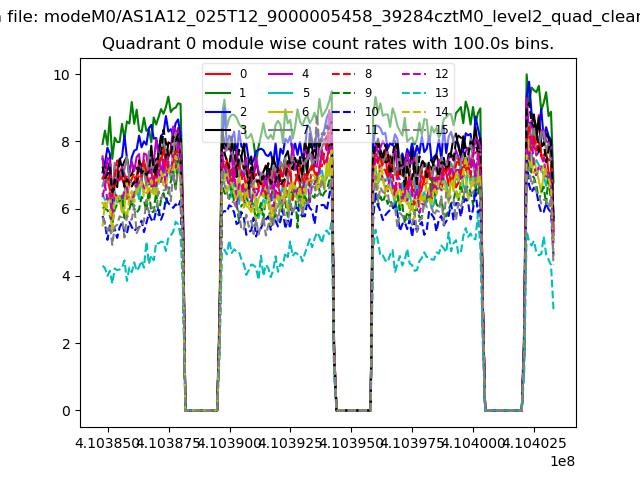 |
 |
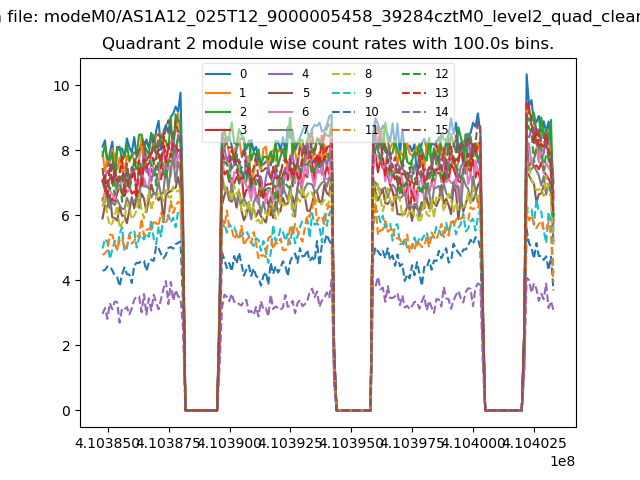
| Module-wise count rates for Quadrant B Data is divided into 100 sec bins |
 |
 |
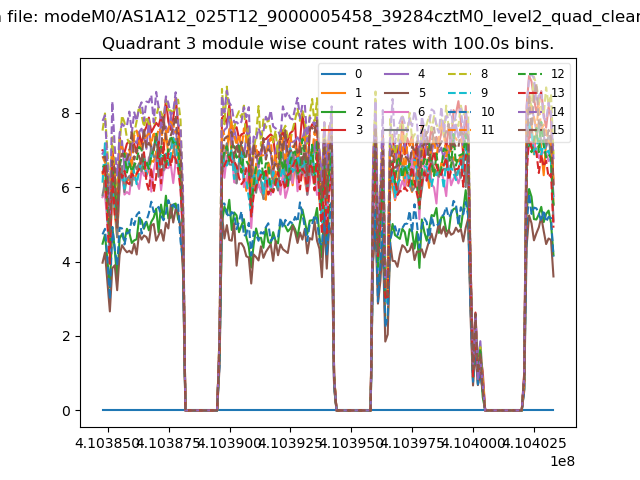
| Module-wise count rates for Quadrant C Data is divided into 100 sec bins |
 |
 |
| Module-wise count rates for Quadrant D Data is divided into 100 sec bins |
 |
 |
| Parameter | Plot |
|---|---|
| CZT HV Monitor | 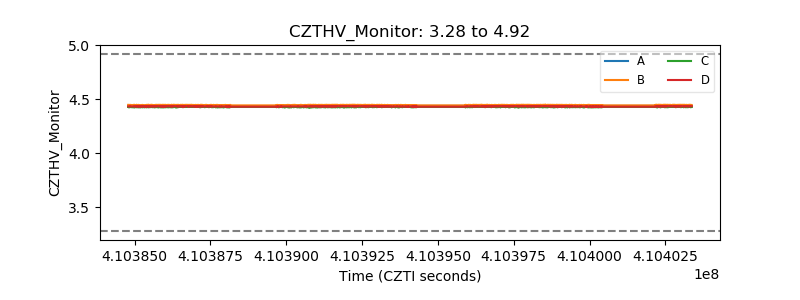 |
| D_VDD | 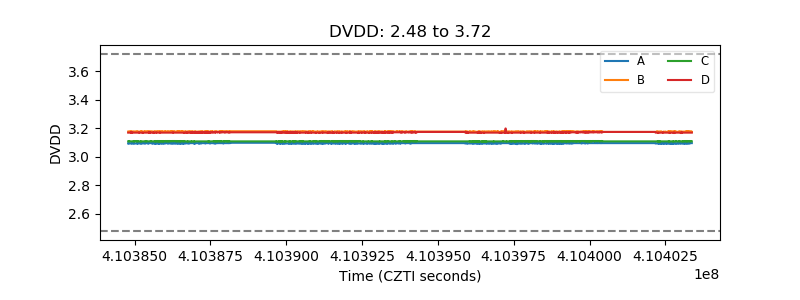 |
| Temperature 1 | 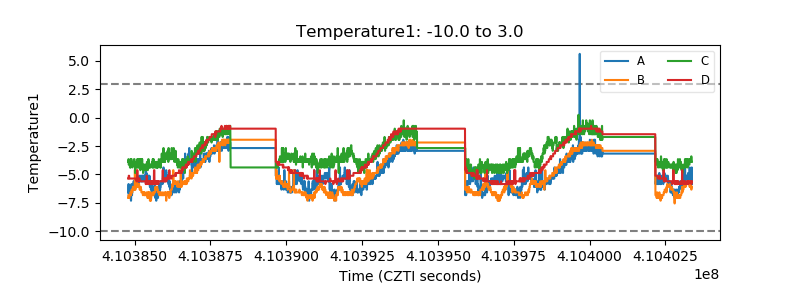 |
| Veto HV Monitor | 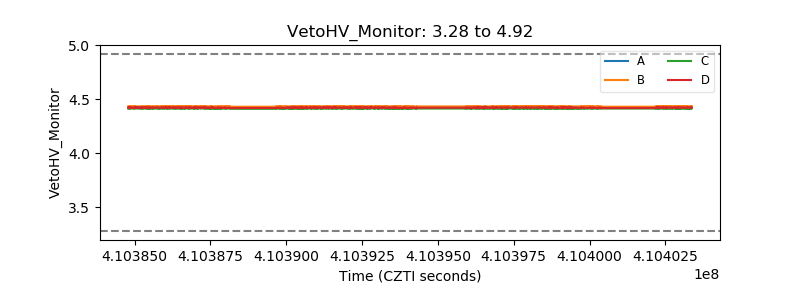 |
| Veto LLD | 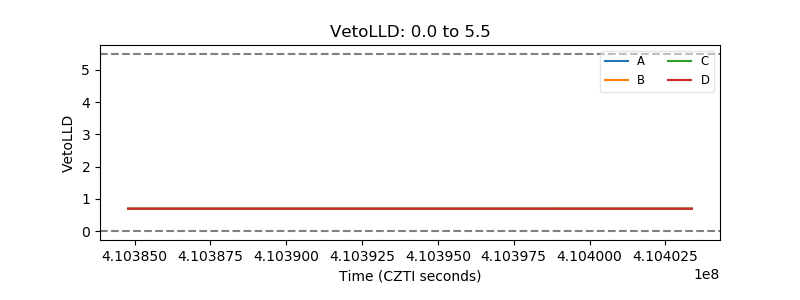 |
| Alpha Counter | 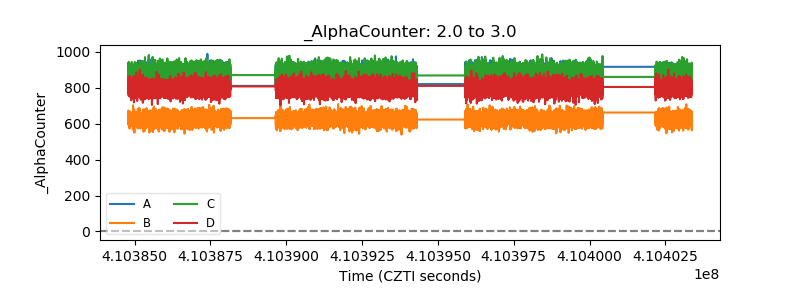 |
| _CPM_Rate | 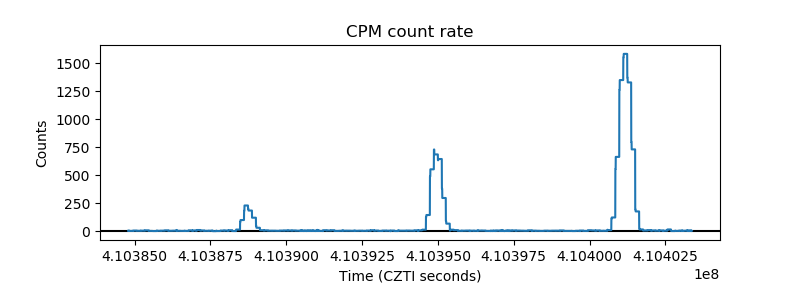 |
| CZT Counter | 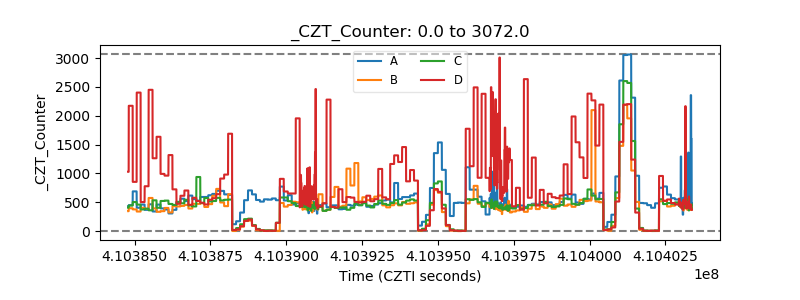 |
| +2.5 Volts monitor | 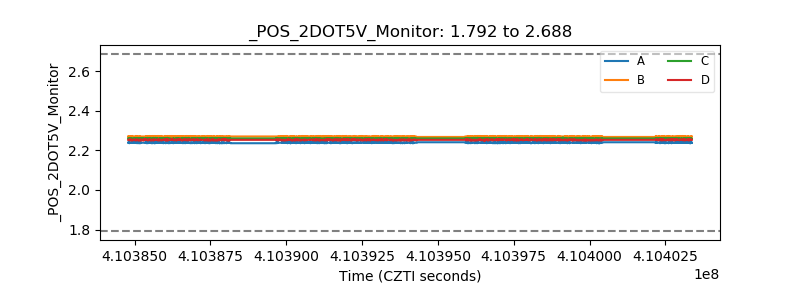 |
| +5 Volts monitor | 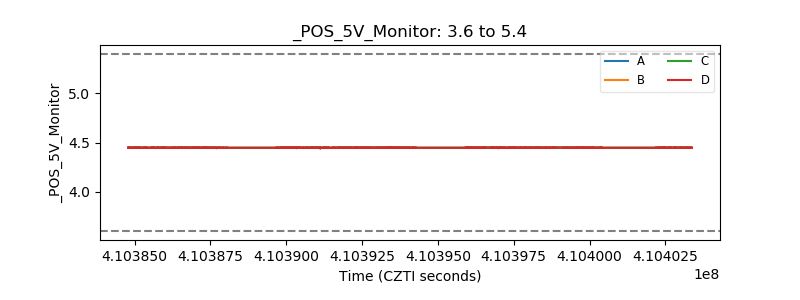 |
| _ROLL_ROT | 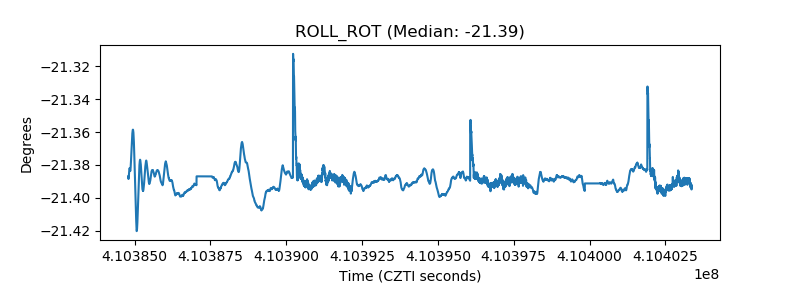 |
| _Roll_DEC | 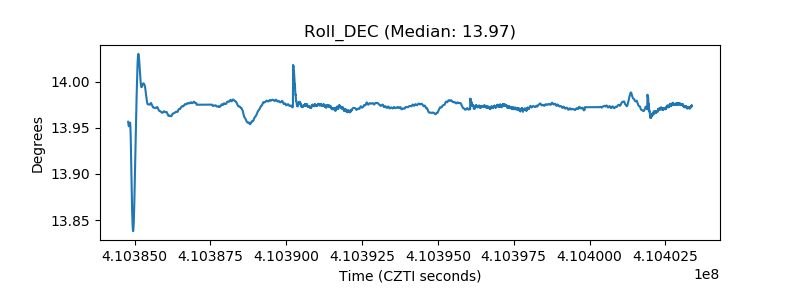 |
| _Roll_RA | 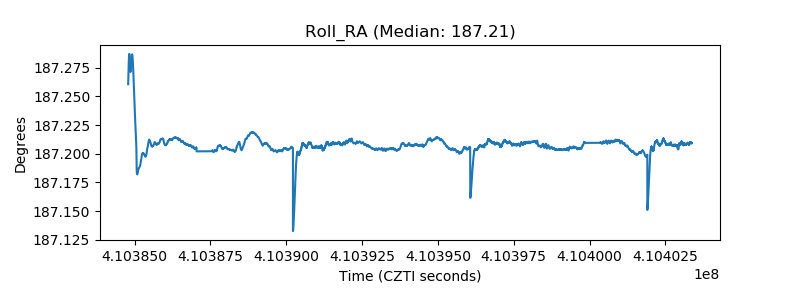 |
| Veto Counter | 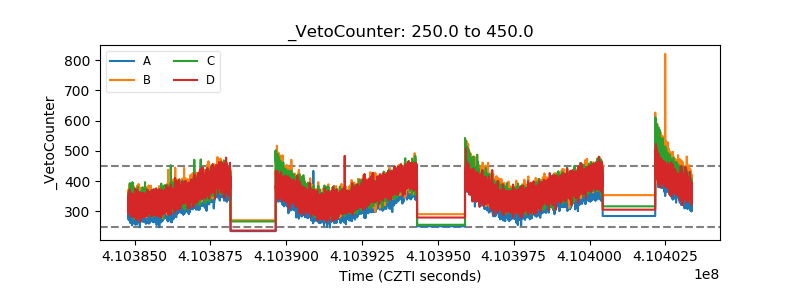 |