| Param | Original file | Final file |
|---|---|---|
| Filename | modeM0/AS1A12_025T12_9000005458_39285cztM0_level2.fits | modeM0/AS1A12_025T12_9000005458_39285cztM0_level2_quad_clean.evt |
| Size (bytes) | 370,031,040 | 97,159,680 |
| Size | 352.9 MB | 92.7 MB |
| Events in quadrant A | 3,129,962 | 664,652 |
| Events in quadrant B | 2,540,694 | 689,601 |
| Events in quadrant C | 2,729,292 | 646,245 |
| Events in quadrant D | 4,865,795 | 553,764 |
| Mode SS | |||
|---|---|---|---|
| Quadrant | BADHDUFLAG | Total packets | Discarded packets |
| A | 0 | 112 | 0 |
| B | 0 | 112 | 0 |
| C | 0 | 112 | 0 |
| D | 0 | 112 | 0 |
| Mode M0 | |||
|---|---|---|---|
| Quadrant | BADHDUFLAG | Total packets | Discarded packets |
| A | 0 | 12621 | 3 |
| B | 0 | 11246 | 2 |
| C | 0 | 11441 | 2 |
| D | 0 | 18345 | 2 |
| Mode M9 | |||
|---|---|---|---|
| Quadrant | BADHDUFLAG | Total packets | Discarded packets |
| A | 0 | 27 | 0 |
| B | 0 | 27 | 0 |
| C | 0 | 27 | 0 |
| D | 0 | 28 | 0 |
| Quadrant | Total seconds | Saturated seconds | Saturation percentage |
|---|---|---|---|
| A | 5545 | 22 | 0.396754% |
| B | 5545 | 13 | 0.234445% |
| C | 5545 | 5 | 0.090171% |
| D | 5545 | 443 | 7.989179% |
Noise dominated data is calculated using 1-second bins in cleaned event files. If a bin has >2000 counts, and if more than 50% of those come from <1% of pixels, then it is considered to be noise-dominated and hence unusable.
| Quadrant | # 1 sec bins | Bins with >0 counts | Bins with >2000 counts | High rate bins dominated by noise | Noise dominated (total time) | Noise dominated (detector-on time) | Marked lightcurve |
|---|---|---|---|---|---|---|---|
| A | 7398 | 5546 | 26 | 26 | 0.35% | 0.47% | 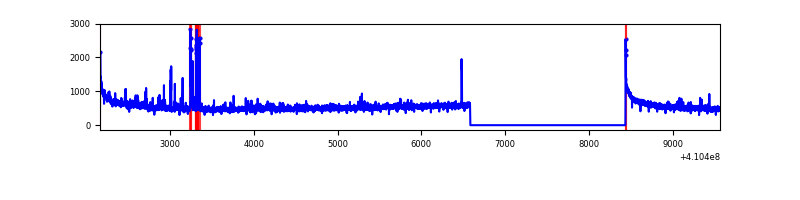 |
| B | 7398 | 5546 | 7 | 7 | 0.09% | 0.13% | 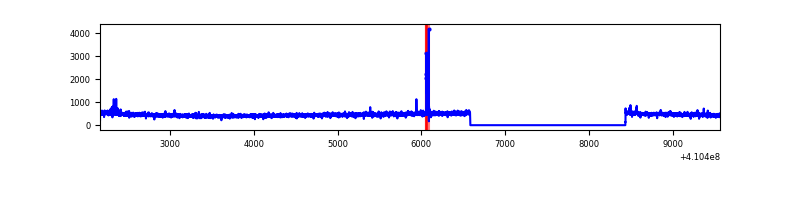 |
| C | 7398 | 5546 | 0 | 0 | 0.00% | 0.00% | 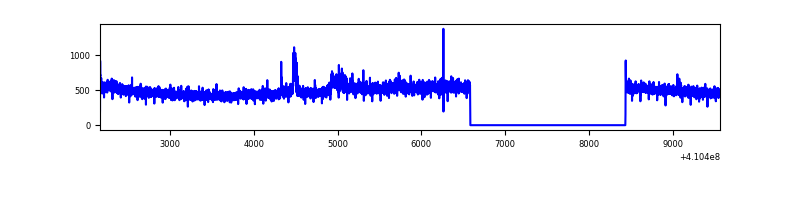 |
| D | 7398 | 5546 | 371 | 371 | 5.01% | 6.69% | 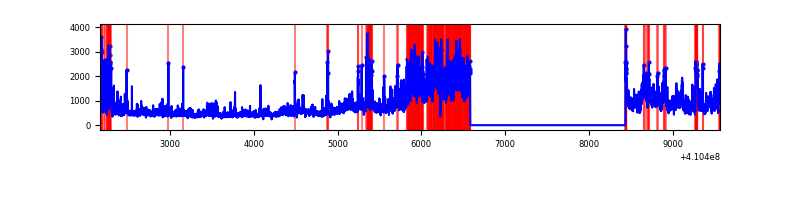 |
Top three noisy pixels from each quadrant. If the there are fewer than three noisy pixels in the level2.evt file, extra rows are filled as -1
| Pixel properties | Quadrant properties | ||||||
|---|---|---|---|---|---|---|---|
| Quadrant | DetID | PixID | Counts | Sigma | Mean | Median | Sigma |
| A | 10 | 83 | 431301 | 3360.71 | 633 | 622 | 128.2 |
| A | 15 | 222 | 227994 | 1774.25 | 633 | 622 | 128.2 |
| A | 3 | 1 | 15988 | 119.91 | 633 | 622 | 128.2 |
| B | 5 | 184 | 41048 | 334.5 | 633 | 617 | 120.9 |
| B | 12 | 111 | 15139 | 120.15 | 633 | 617 | 120.9 |
| B | 11 | 111 | 13887 | 109.79 | 633 | 617 | 120.9 |
| C | 15 | 214 | 237004 | 1640.71 | 619 | 624 | 144.1 |
| C | 9 | 187 | 69437 | 477.63 | 619 | 624 | 144.1 |
| C | 8 | 222 | 4300 | 25.52 | 619 | 624 | 144.1 |
| D | 12 | 235 | 2086073 | 14256.08 | 597 | 581 | 146.3 |
| D | 14 | 52 | 166308 | 1132.88 | 597 | 581 | 146.3 |
| D | 5 | 222 | 115089 | 782.76 | 597 | 581 | 146.3 |
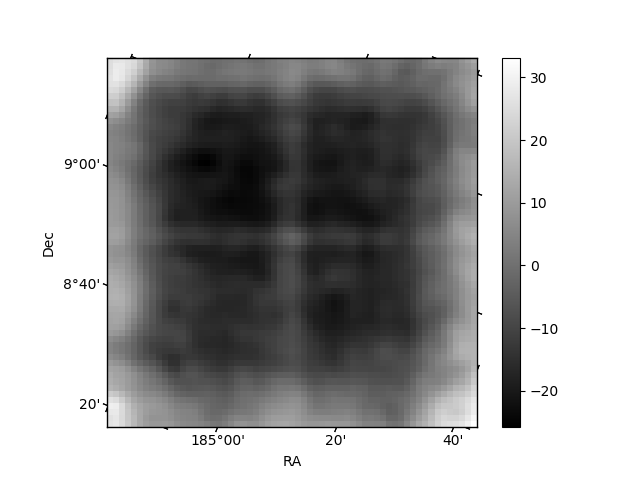
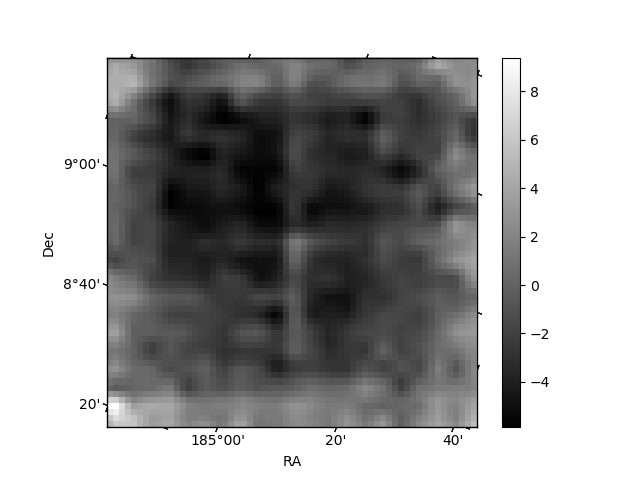
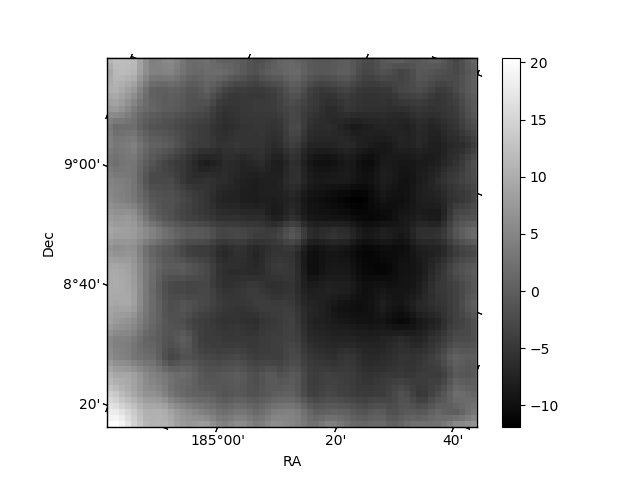
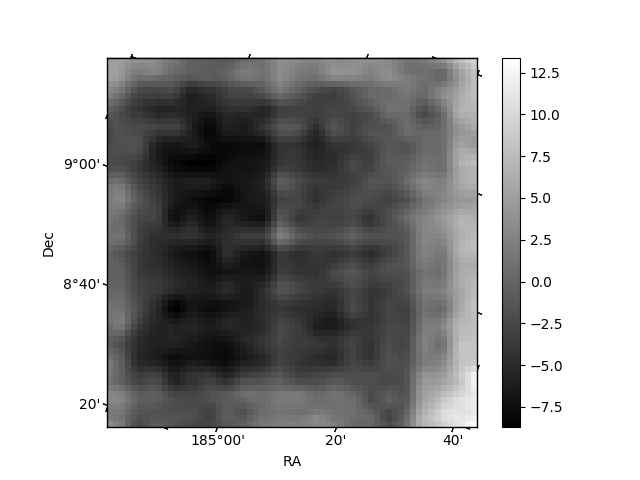
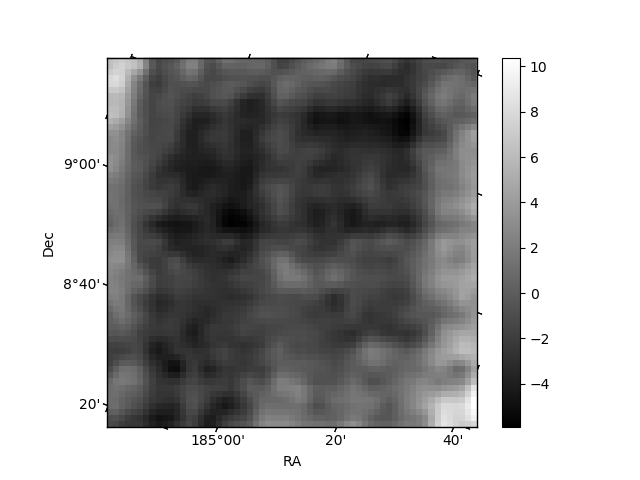
Histogram calculated using DETX and DETY for each event in the final _common_clean file
| Quadrant A | 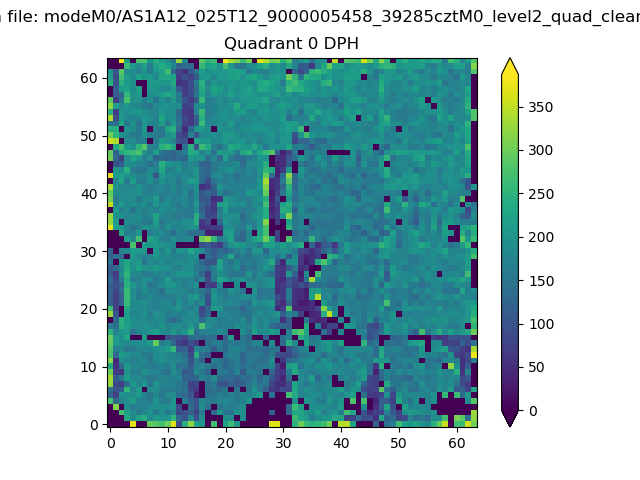 |
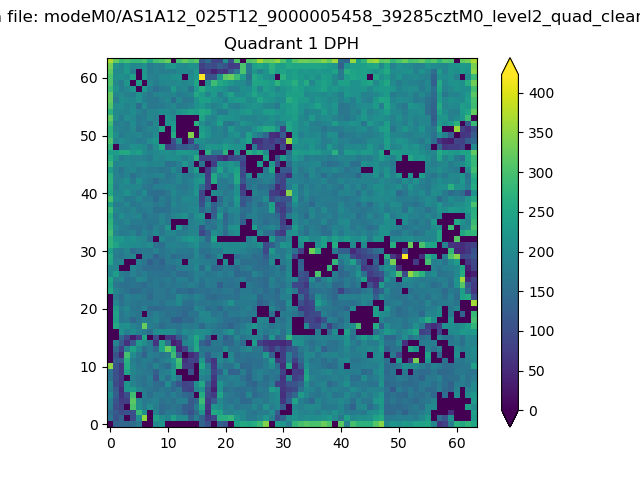 |
Quadrant B |
|---|---|---|---|
| Quadrant D | 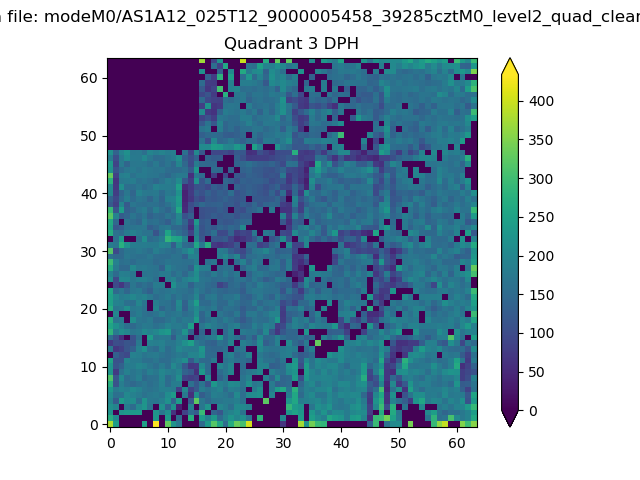 |
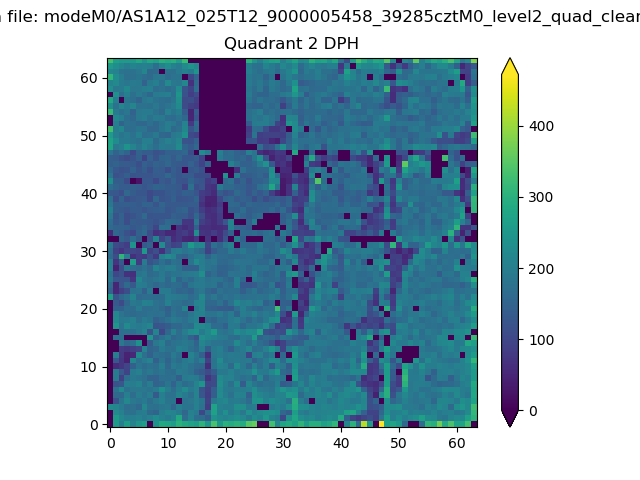 |
Quadrant C |
| Plot type | Count rate plots | Images |
|---|---|---|
| Comparison with Poisson distribution Blue bars denote a histogram of data divided into 1 sec bins. Red curve is a Poisson curve with rate = median count rate of data. |
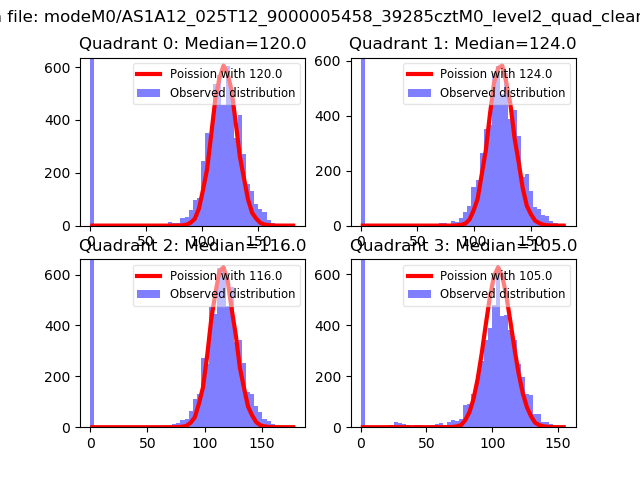 |
 |
| Quadrant-wise count rates Data is divided into 100 sec bins |
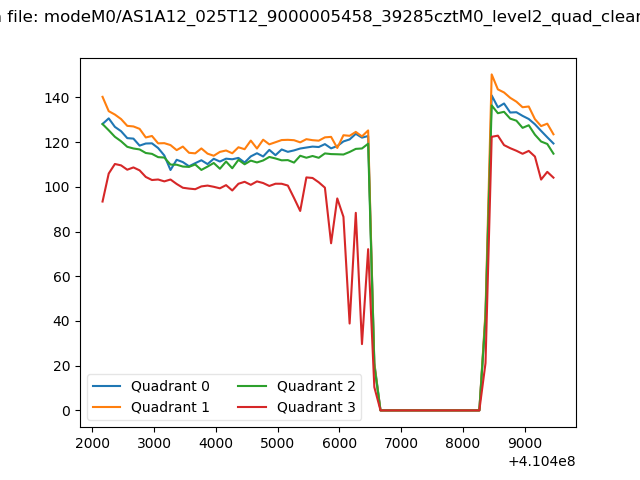 |
|
| Module-wise count rates for Quadrant A Data is divided into 100 sec bins |
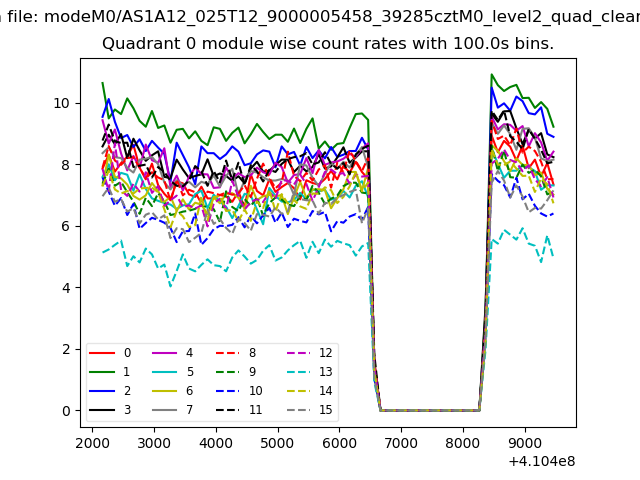 |
 |
| Module-wise count rates for Quadrant B Data is divided into 100 sec bins |
 |
 |
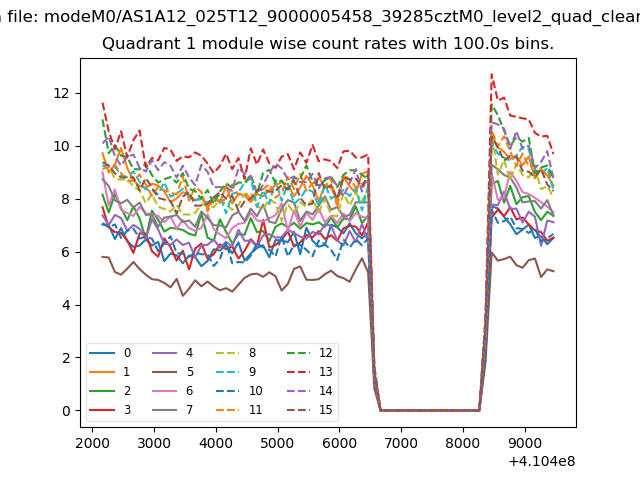
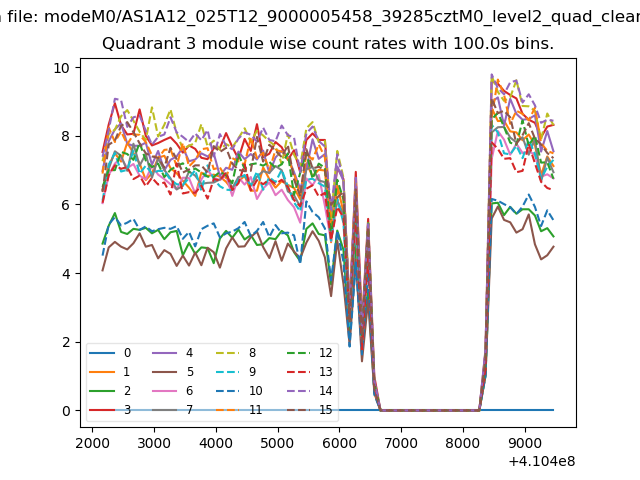
| Module-wise count rates for Quadrant C Data is divided into 100 sec bins |
 |
 |
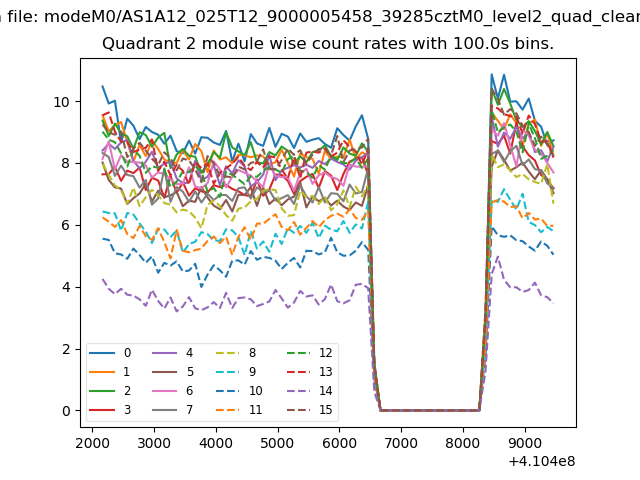
| Module-wise count rates for Quadrant D Data is divided into 100 sec bins |
 |
 |
| Parameter | Plot |
|---|---|
| CZT HV Monitor | 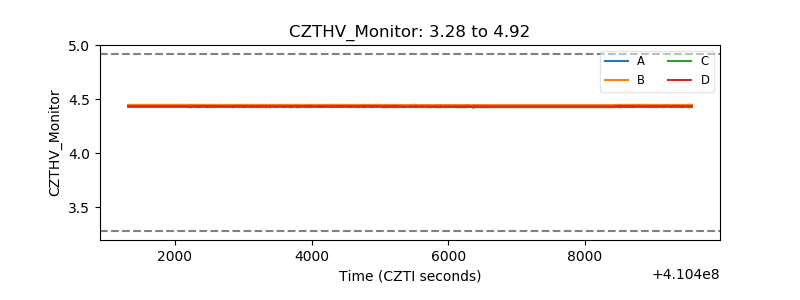 |
| D_VDD | 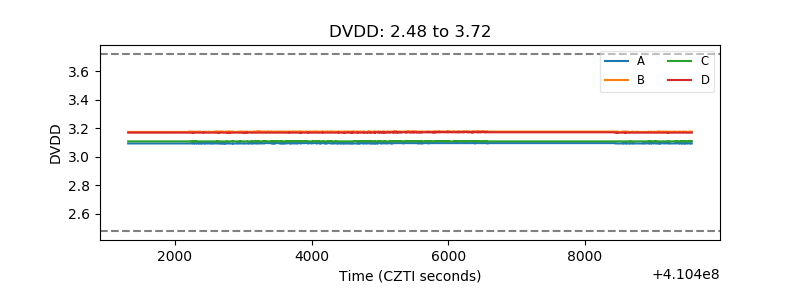 |
| Temperature 1 | 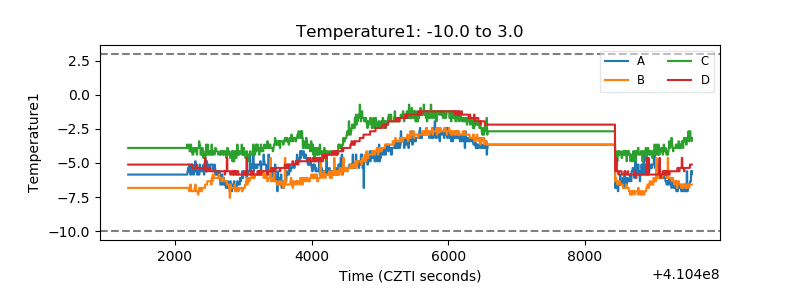 |
| Veto HV Monitor | 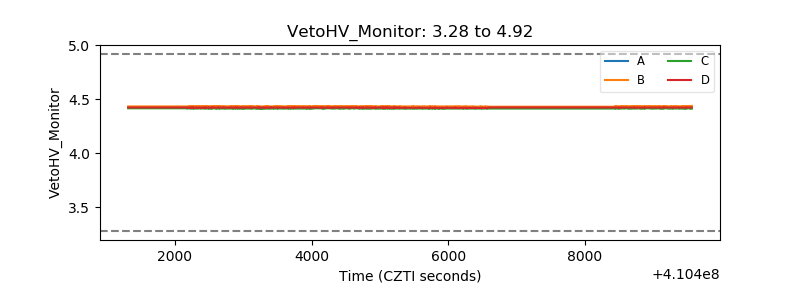 |
| Veto LLD | 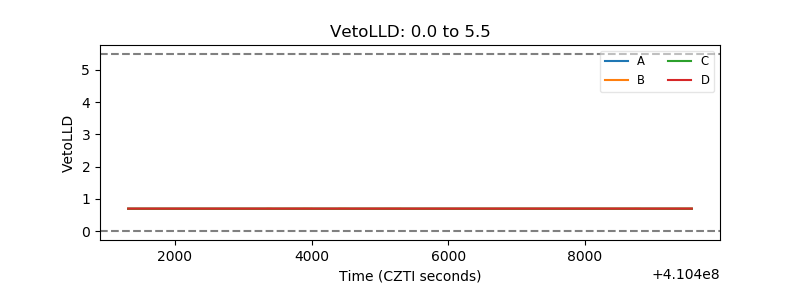 |
| Alpha Counter | 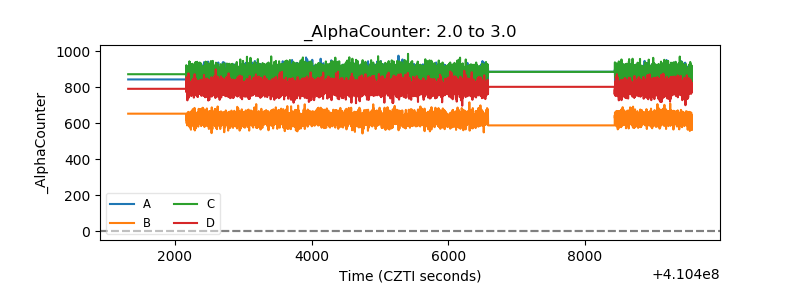 |
| _CPM_Rate | 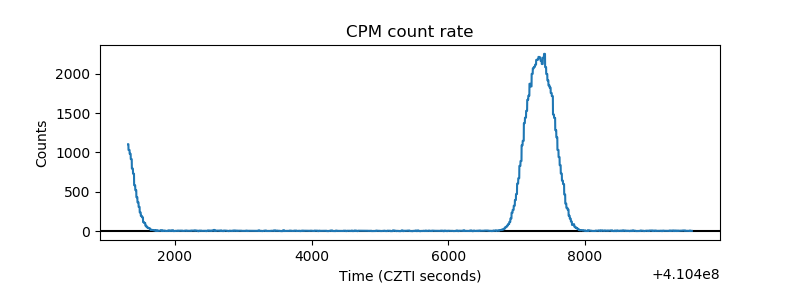 |
| CZT Counter | 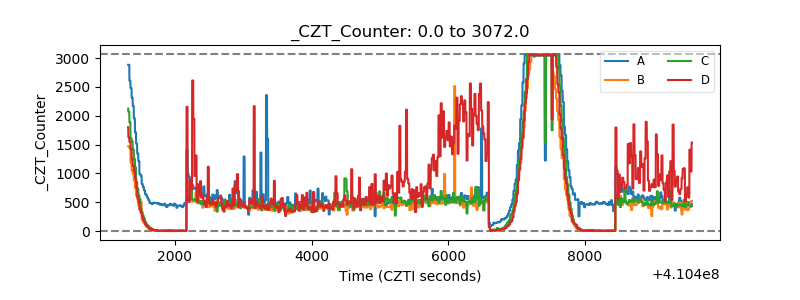 |
| +2.5 Volts monitor | 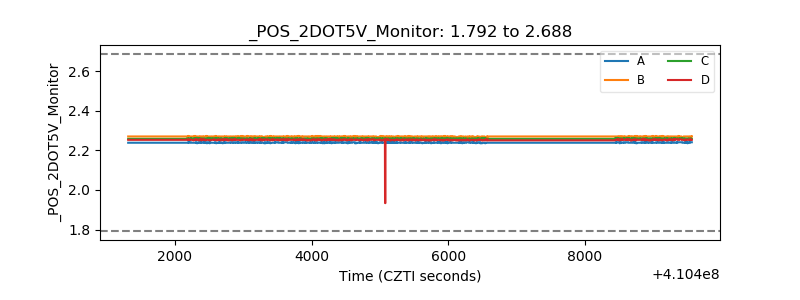 |
| +5 Volts monitor | 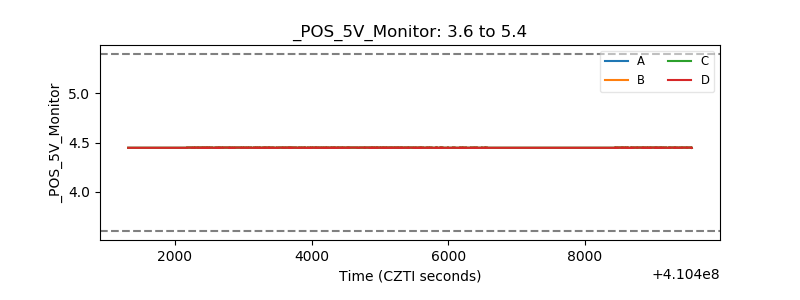 |
| _ROLL_ROT | 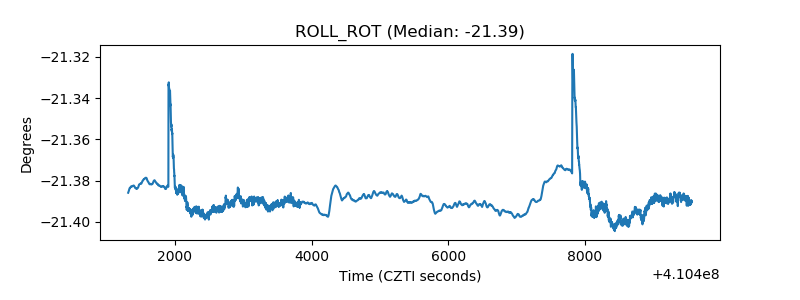 |
| _Roll_DEC | 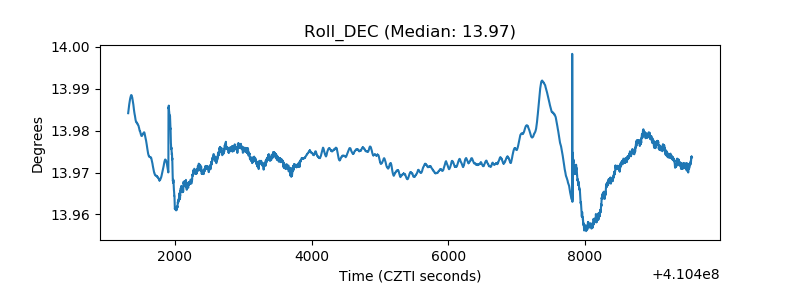 |
| _Roll_RA | 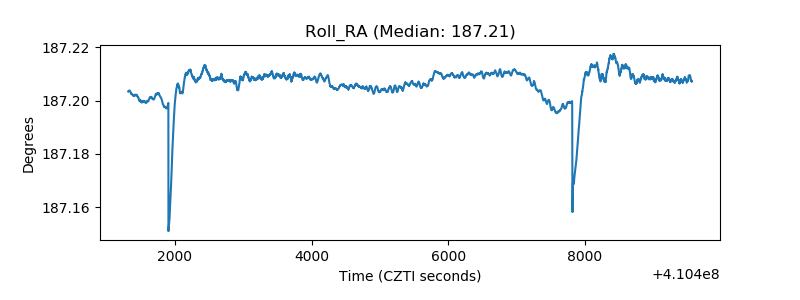 |
| Veto Counter | 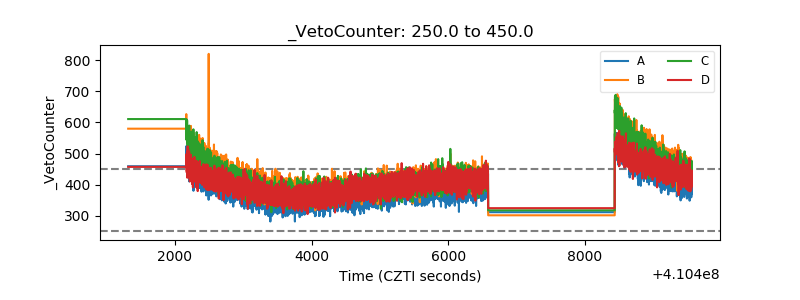 |