| Param | Original file | Final file |
|---|---|---|
| Filename | modeM0/AS1A12_025T12_9000005458_39286cztM0_level2.fits | modeM0/AS1A12_025T12_9000005458_39286cztM0_level2_quad_clean.evt |
| Size (bytes) | 510,304,320 | 92,560,320 |
| Size | 486.7 MB | 88.3 MB |
| Events in quadrant A | 2,998,577 | 678,646 |
| Events in quadrant B | 2,738,434 | 702,511 |
| Events in quadrant C | 2,828,296 | 660,963 |
| Events in quadrant D | 9,905,885 | 383,308 |
| Mode SS | |||
|---|---|---|---|
| Quadrant | BADHDUFLAG | Total packets | Discarded packets |
| A | 0 | 110 | 0 |
| B | 0 | 110 | 0 |
| C | 0 | 110 | 0 |
| D | 0 | 110 | 0 |
| Mode M0 | |||
|---|---|---|---|
| Quadrant | BADHDUFLAG | Total packets | Discarded packets |
| A | 0 | 12050 | 3 |
| B | 0 | 11501 | 2 |
| C | 0 | 11443 | 2 |
| D | 0 | 33123 | 2 |
| Mode M9 | |||
|---|---|---|---|
| Quadrant | BADHDUFLAG | Total packets | Discarded packets |
| A | 0 | 31 | 0 |
| B | 0 | 31 | 0 |
| C | 0 | 31 | 0 |
| D | 0 | 32 | 0 |
| Quadrant | Total seconds | Saturated seconds | Saturation percentage |
|---|---|---|---|
| A | 5390 | 15 | 0.278293% |
| B | 5390 | 50 | 0.927644% |
| C | 5390 | 9 | 0.166976% |
| D | 5390 | 2265 | 42.022263% |
Noise dominated data is calculated using 1-second bins in cleaned event files. If a bin has >2000 counts, and if more than 50% of those come from <1% of pixels, then it is considered to be noise-dominated and hence unusable.
| Quadrant | # 1 sec bins | Bins with >0 counts | Bins with >2000 counts | High rate bins dominated by noise | Noise dominated (total time) | Noise dominated (detector-on time) | Marked lightcurve |
|---|---|---|---|---|---|---|---|
| A | 7362 | 5391 | 7 | 7 | 0.10% | 0.13% | 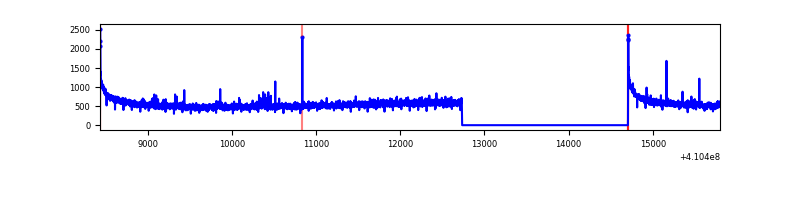 |
| B | 7362 | 5391 | 28 | 28 | 0.38% | 0.52% | 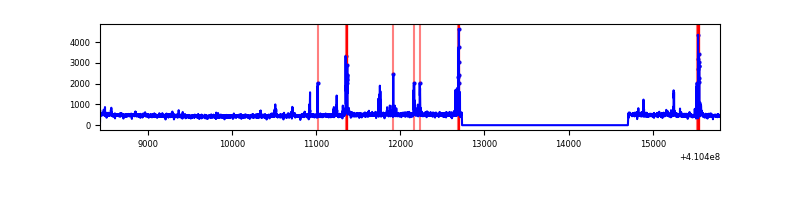 |
| C | 7362 | 5391 | 15 | 15 | 0.20% | 0.28% | 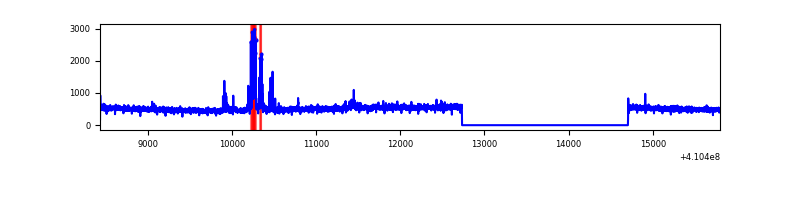 |
| D | 7362 | 5391 | 2338 | 2338 | 31.76% | 43.37% | 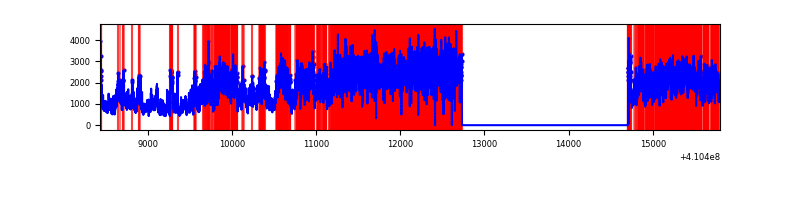 |
Top three noisy pixels from each quadrant. If the there are fewer than three noisy pixels in the level2.evt file, extra rows are filled as -1
| Pixel properties | Quadrant properties | ||||||
|---|---|---|---|---|---|---|---|
| Quadrant | DetID | PixID | Counts | Sigma | Mean | Median | Sigma |
| A | 10 | 83 | 425054 | 3287.37 | 638 | 627 | 129.1 |
| A | 15 | 222 | 94780 | 729.26 | 638 | 627 | 129.1 |
| A | 13 | 248 | 11229 | 82.12 | 638 | 627 | 129.1 |
| B | 5 | 172 | 158631 | 1308.34 | 635 | 619 | 120.8 |
| B | 5 | 255 | 62618 | 513.35 | 635 | 619 | 120.8 |
| B | 5 | 184 | 18673 | 149.49 | 635 | 619 | 120.8 |
| C | 15 | 214 | 227430 | 1585.42 | 621 | 626 | 143.1 |
| C | 9 | 187 | 170969 | 1190.74 | 621 | 626 | 143.1 |
| C | 8 | 222 | 4403 | 26.4 | 621 | 626 | 143.1 |
| D | 12 | 235 | 7635561 | 62240.24 | 506 | 491 | 122.7 |
| D | 2 | 249 | 102541 | 831.9 | 506 | 491 | 122.7 |
| D | 13 | 249 | 87960 | 713.04 | 506 | 491 | 122.7 |
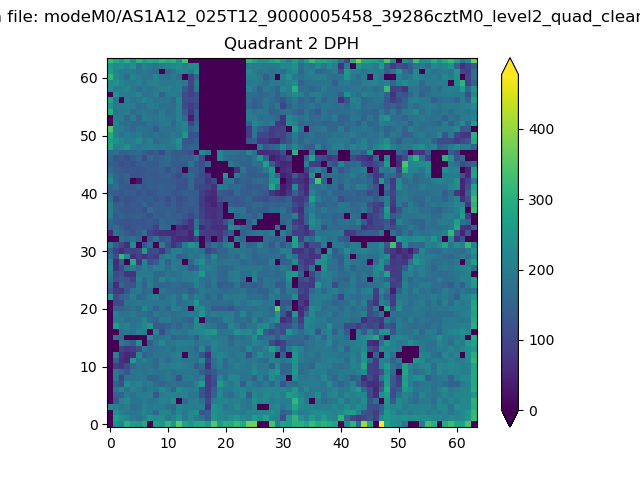
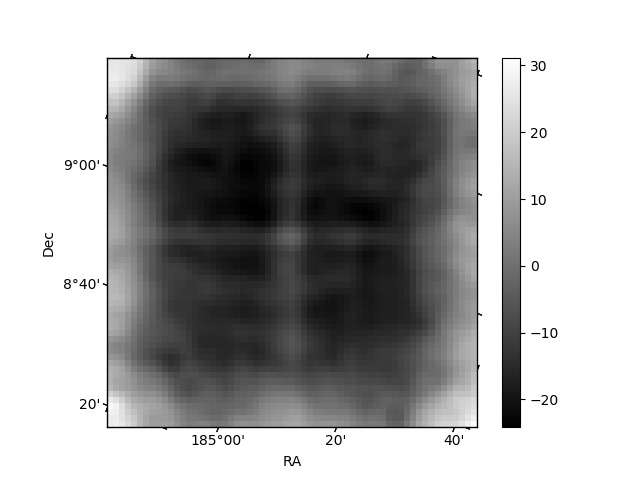
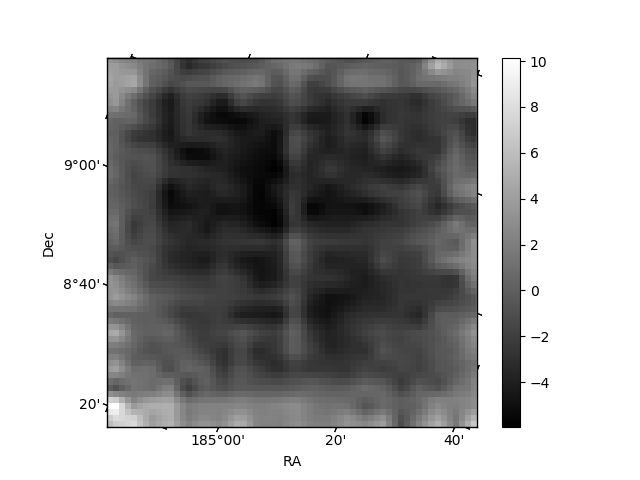
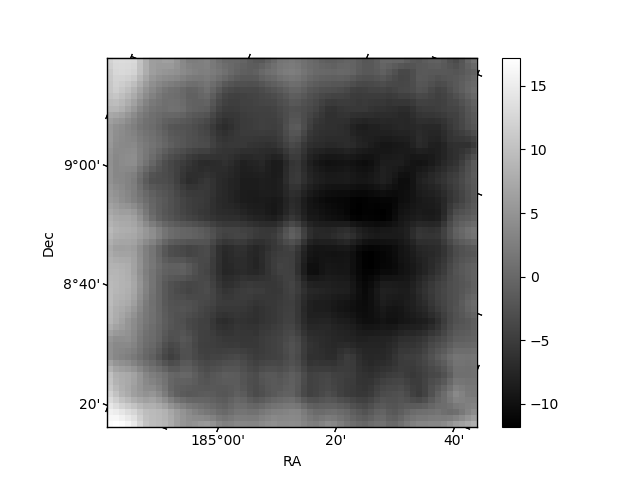
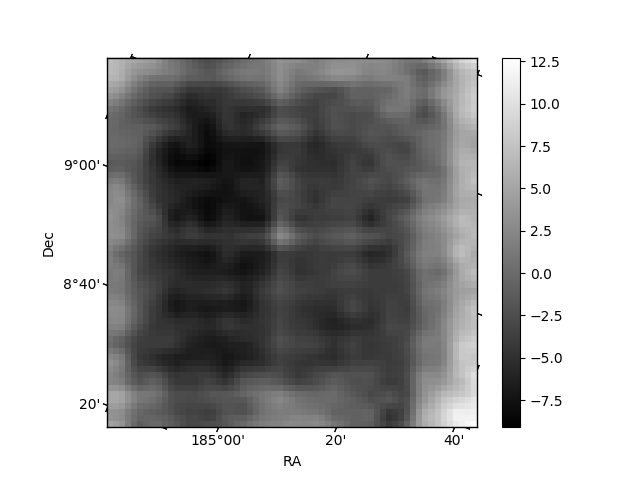
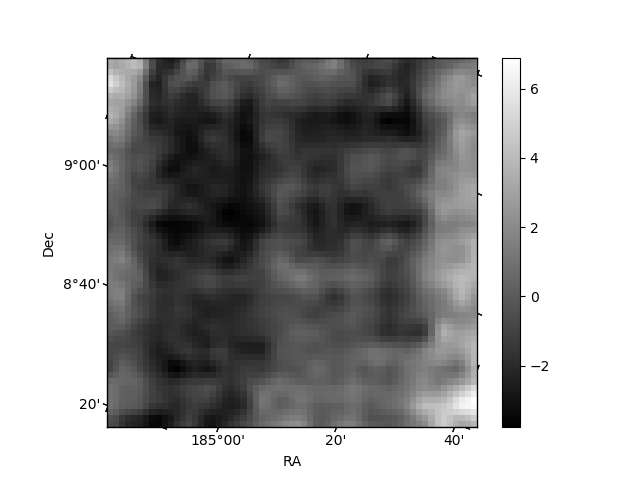
Histogram calculated using DETX and DETY for each event in the final _common_clean file
| Quadrant A | 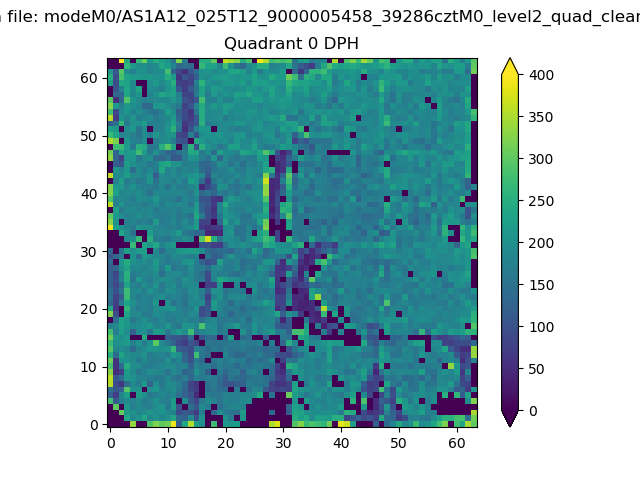 |
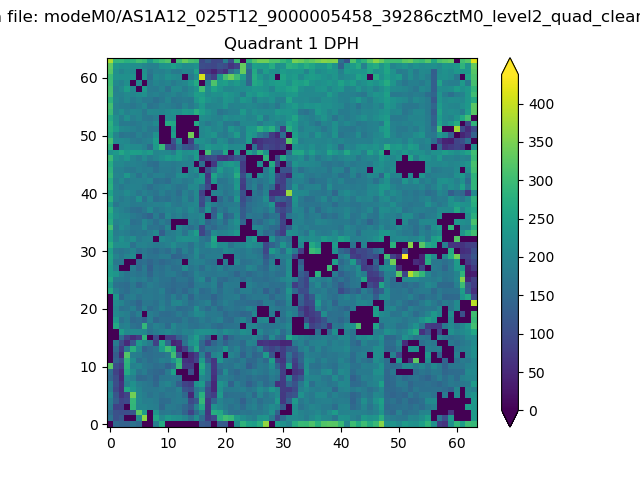 |
Quadrant B |
|---|---|---|---|
| Quadrant D | 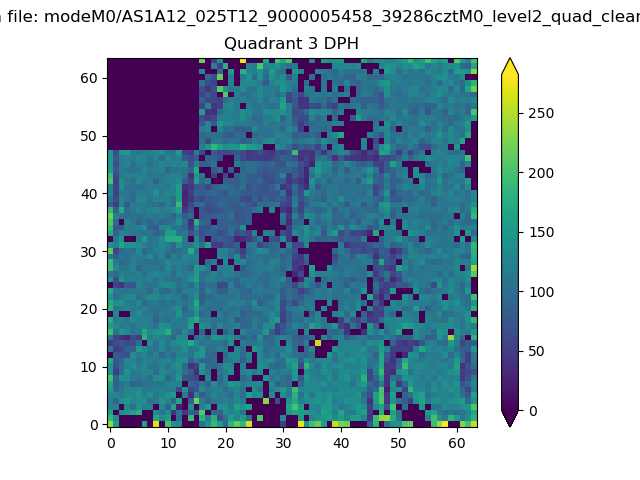 |
 |
Quadrant C |
| Plot type | Count rate plots | Images |
|---|---|---|
| Comparison with Poisson distribution Blue bars denote a histogram of data divided into 1 sec bins. Red curve is a Poisson curve with rate = median count rate of data. |
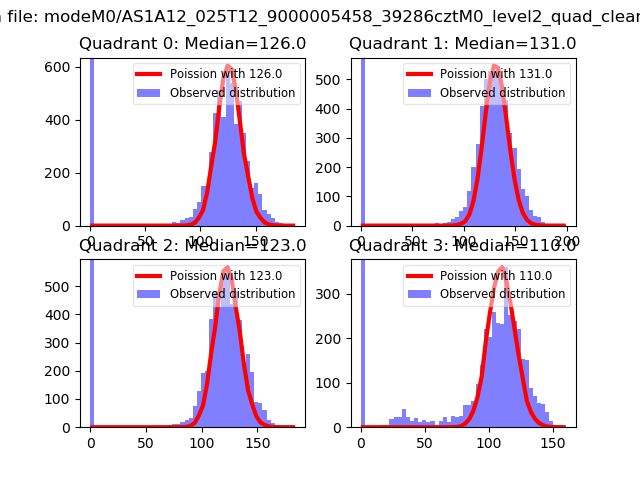 |
 |
| Quadrant-wise count rates Data is divided into 100 sec bins |
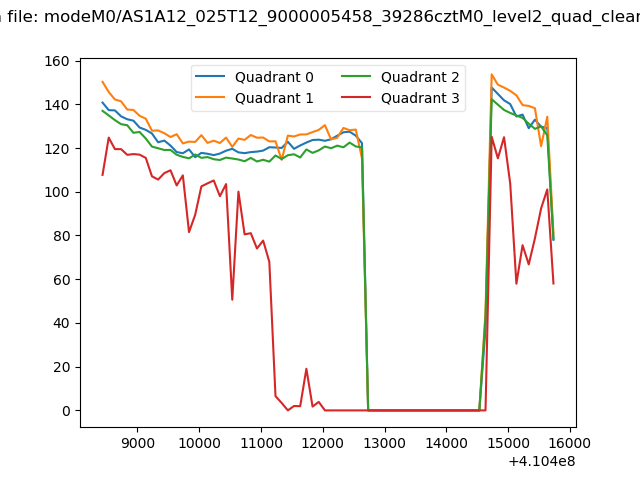 |
|
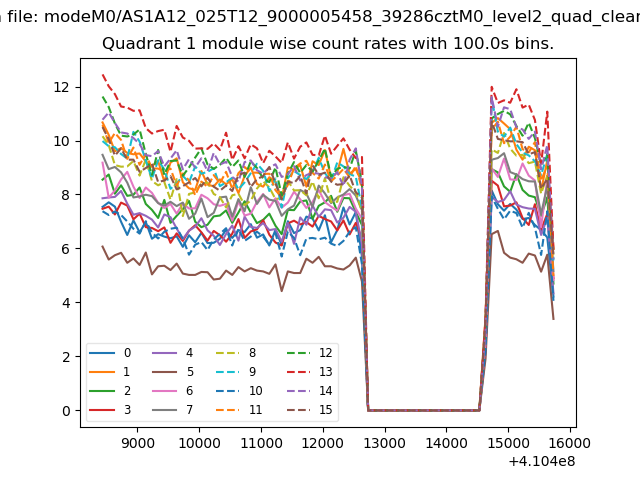
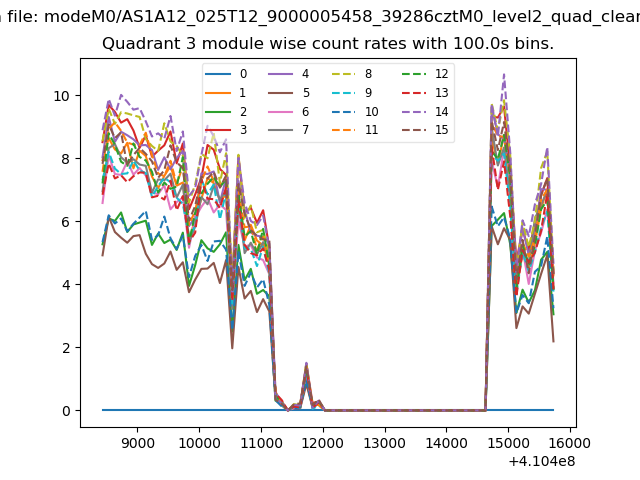
| Module-wise count rates for Quadrant A Data is divided into 100 sec bins |
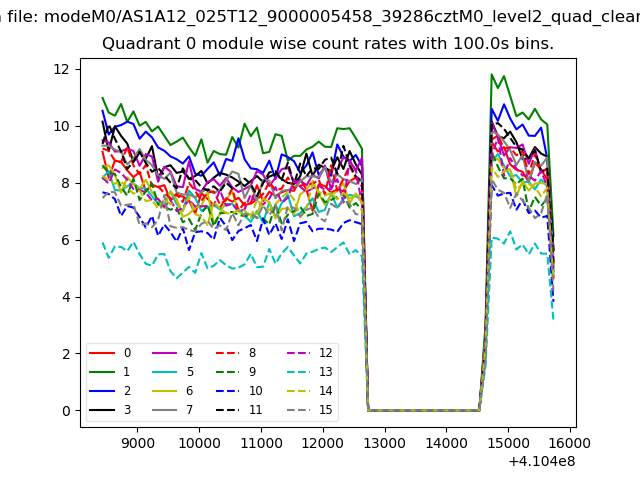 |
 |
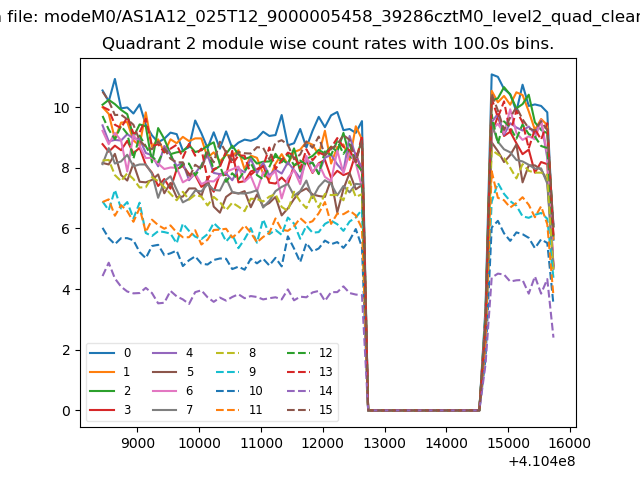
| Module-wise count rates for Quadrant B Data is divided into 100 sec bins |
 |
 |
| Module-wise count rates for Quadrant C Data is divided into 100 sec bins |
 |
 |
| Module-wise count rates for Quadrant D Data is divided into 100 sec bins |
 |
 |
| Parameter | Plot |
|---|---|
| CZT HV Monitor | 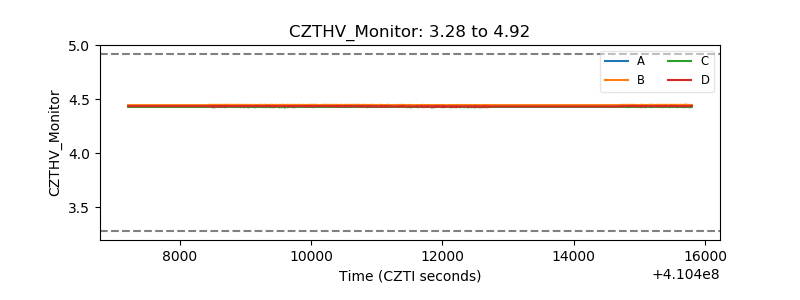 |
| D_VDD | 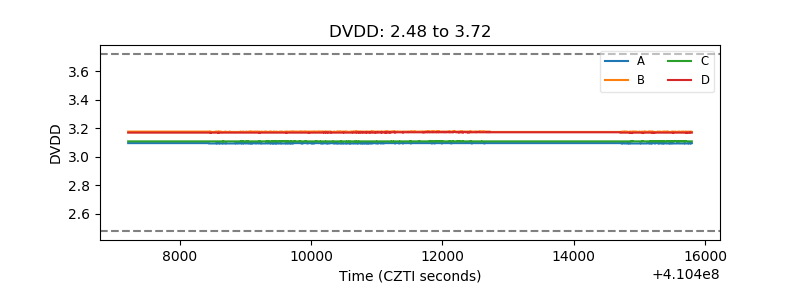 |
| Temperature 1 | 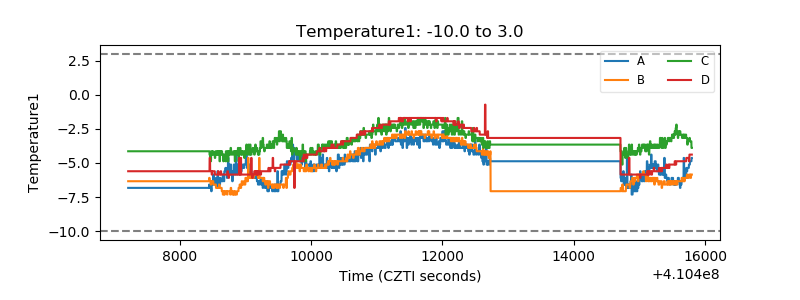 |
| Veto HV Monitor | 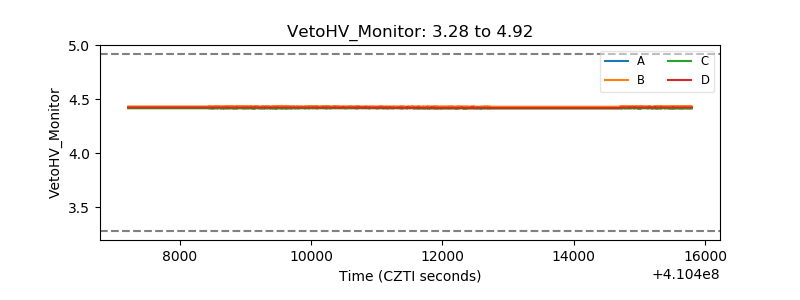 |
| Veto LLD | 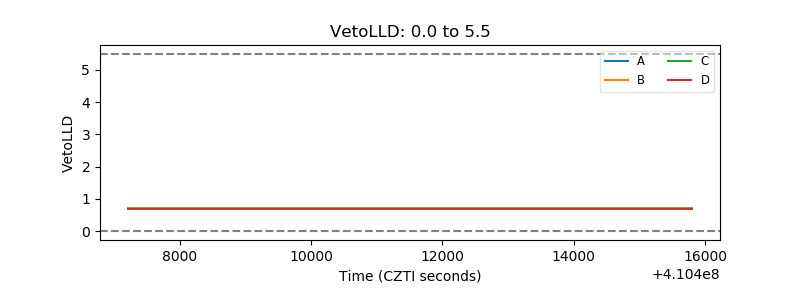 |
| Alpha Counter | 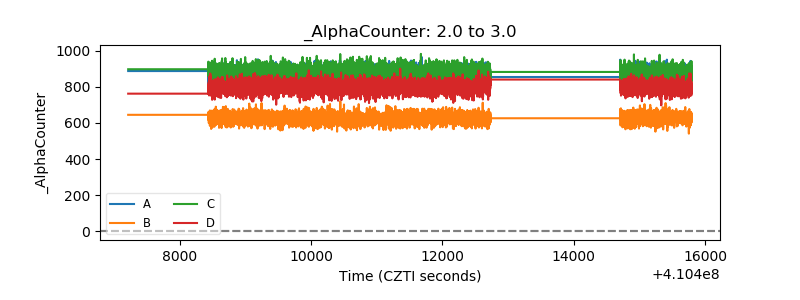 |
| _CPM_Rate | 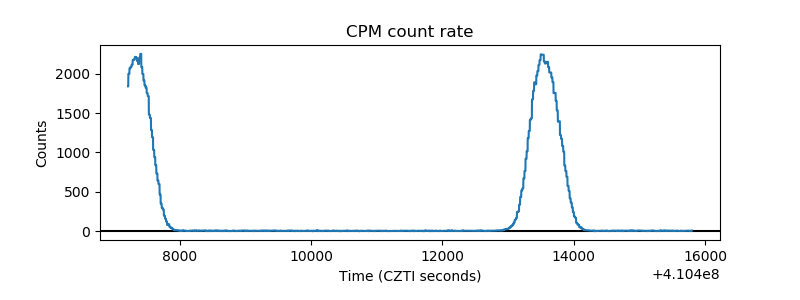 |
| CZT Counter | 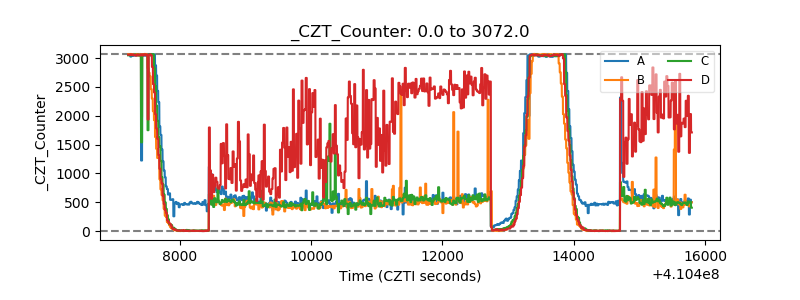 |
| +2.5 Volts monitor |  |
| +5 Volts monitor | 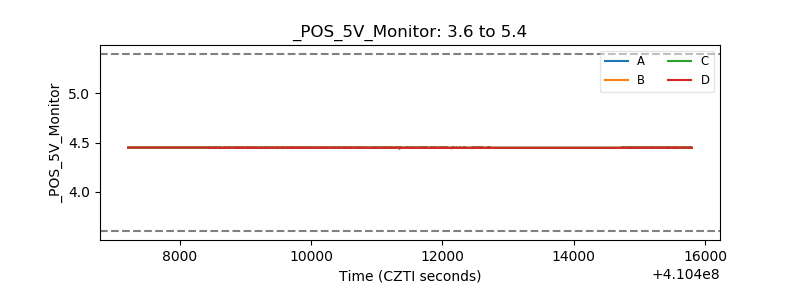 |
| _ROLL_ROT | 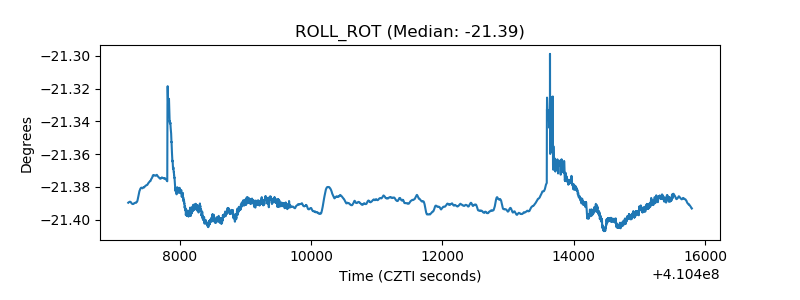 |
| _Roll_DEC | 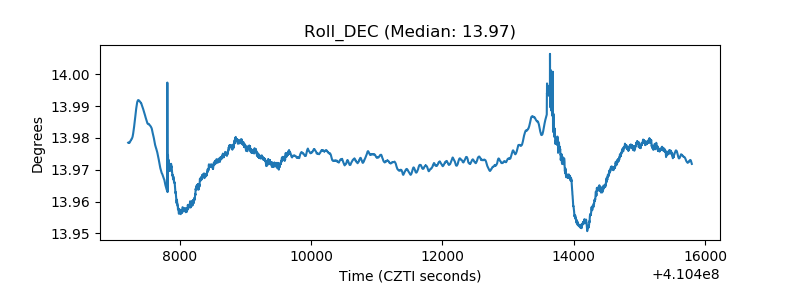 |
| _Roll_RA | 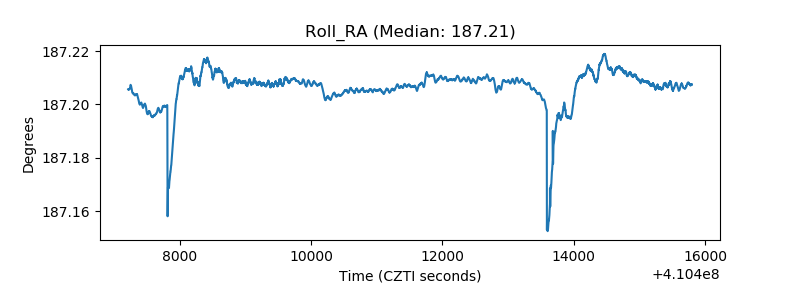 |
| Veto Counter | 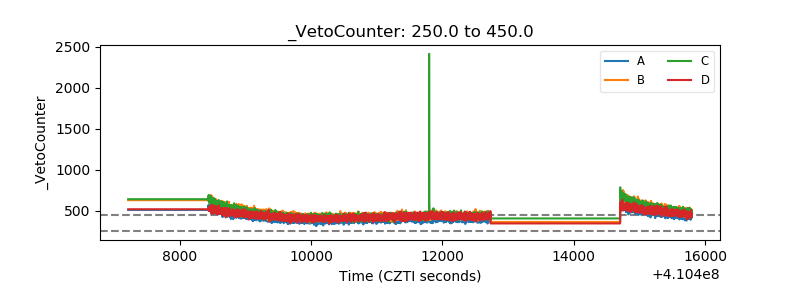 |