| Param | Original file | Final file |
|---|---|---|
| Filename | modeM0/AS1A12_025T12_9000005458_39287cztM0_level2.fits | modeM0/AS1A12_025T12_9000005458_39287cztM0_level2_quad_clean.evt |
| Size (bytes) | 525,349,440 | 88,600,320 |
| Size | 501.0 MB | 84.5 MB |
| Events in quadrant A | 2,982,457 | 669,744 |
| Events in quadrant B | 2,626,987 | 693,008 |
| Events in quadrant C | 2,645,912 | 654,165 |
| Events in quadrant D | 10,787,472 | 302,165 |
| Mode SS | |||
|---|---|---|---|
| Quadrant | BADHDUFLAG | Total packets | Discarded packets |
| A | 0 | 106 | 0 |
| B | 0 | 106 | 0 |
| C | 0 | 106 | 0 |
| D | 0 | 106 | 0 |
| Mode M0 | |||
|---|---|---|---|
| Quadrant | BADHDUFLAG | Total packets | Discarded packets |
| A | 0 | 11902 | 3 |
| B | 0 | 10926 | 2 |
| C | 0 | 10649 | 2 |
| D | 0 | 35597 | 2 |
| Mode M9 | |||
|---|---|---|---|
| Quadrant | BADHDUFLAG | Total packets | Discarded packets |
| A | 0 | 32 | 0 |
| B | 0 | 32 | 0 |
| C | 0 | 32 | 0 |
| D | 0 | 33 | 0 |
| Quadrant | Total seconds | Saturated seconds | Saturation percentage |
|---|---|---|---|
| A | 5194 | 13 | 0.250289% |
| B | 5194 | 32 | 0.616095% |
| C | 5194 | 2 | 0.038506% |
| D | 5194 | 2940 | 56.603774% |
Noise dominated data is calculated using 1-second bins in cleaned event files. If a bin has >2000 counts, and if more than 50% of those come from <1% of pixels, then it is considered to be noise-dominated and hence unusable.
| Quadrant | # 1 sec bins | Bins with >0 counts | Bins with >2000 counts | High rate bins dominated by noise | Noise dominated (total time) | Noise dominated (detector-on time) | Marked lightcurve |
|---|---|---|---|---|---|---|---|
| A | 7287 | 5195 | 5 | 5 | 0.07% | 0.10% | 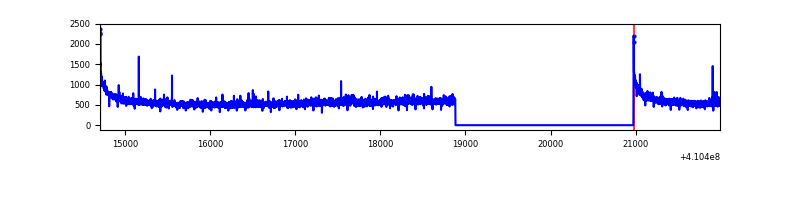 |
| B | 7287 | 5195 | 17 | 17 | 0.23% | 0.33% | 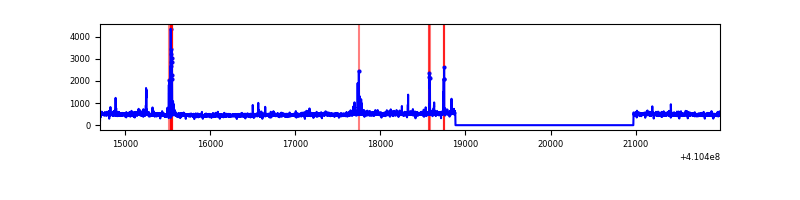 |
| C | 7287 | 5195 | 0 | 0 | 0.00% | 0.00% | 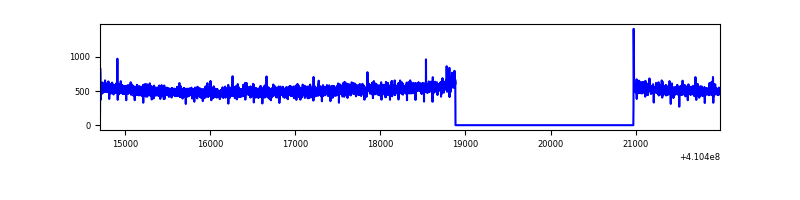 |
| D | 7287 | 5195 | 2913 | 2913 | 39.98% | 56.07% | 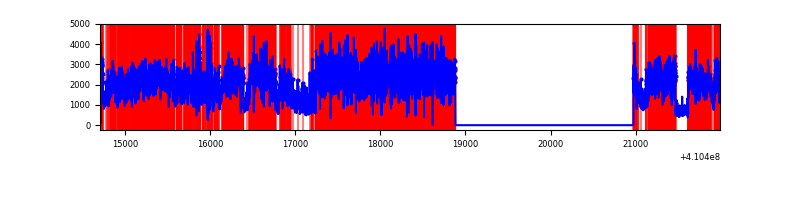 |
Top three noisy pixels from each quadrant. If the there are fewer than three noisy pixels in the level2.evt file, extra rows are filled as -1
| Pixel properties | Quadrant properties | ||||||
|---|---|---|---|---|---|---|---|
| Quadrant | DetID | PixID | Counts | Sigma | Mean | Median | Sigma |
| A | 10 | 83 | 425848 | 3345.92 | 631 | 620 | 127.1 |
| A | 15 | 222 | 107932 | 844.39 | 631 | 620 | 127.1 |
| A | 3 | 1 | 8265 | 60.15 | 631 | 620 | 127.1 |
| B | 5 | 172 | 80691 | 670.21 | 626 | 609 | 119.5 |
| B | 5 | 255 | 61292 | 507.86 | 626 | 609 | 119.5 |
| B | 12 | 111 | 14512 | 116.35 | 626 | 609 | 119.5 |
| C | 15 | 214 | 219851 | 1540.91 | 614 | 622 | 142.3 |
| C | 9 | 187 | 16687 | 112.92 | 614 | 622 | 142.3 |
| C | 3 | 233 | 9127 | 59.78 | 614 | 622 | 142.3 |
| D | 12 | 235 | 8591148 | 75426.28 | 469 | 458 | 113.9 |
| D | 5 | 222 | 212317 | 1860.12 | 469 | 458 | 113.9 |
| D | 13 | 249 | 86166 | 752.52 | 469 | 458 | 113.9 |
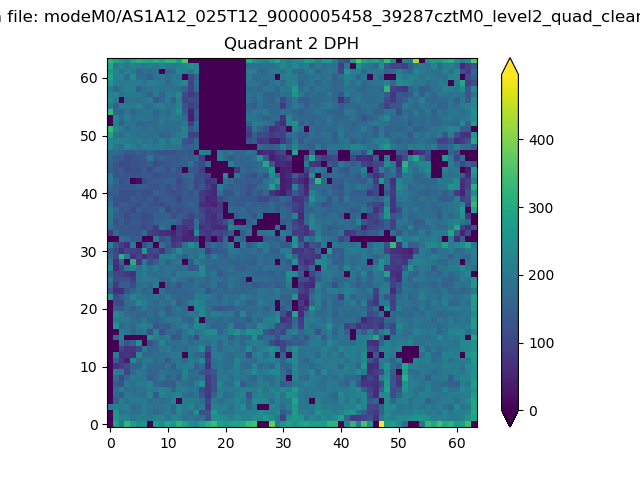
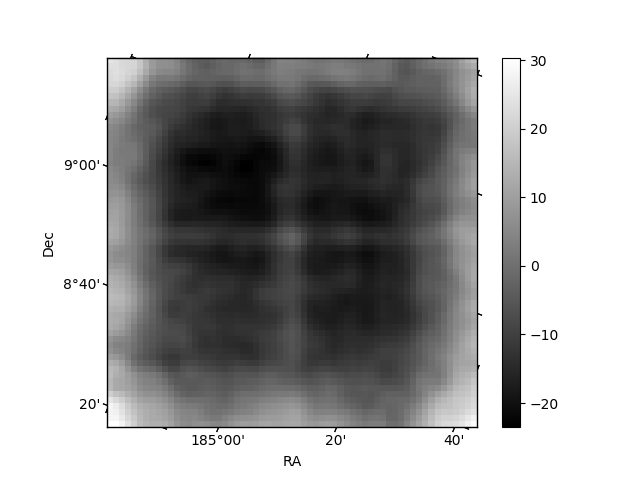
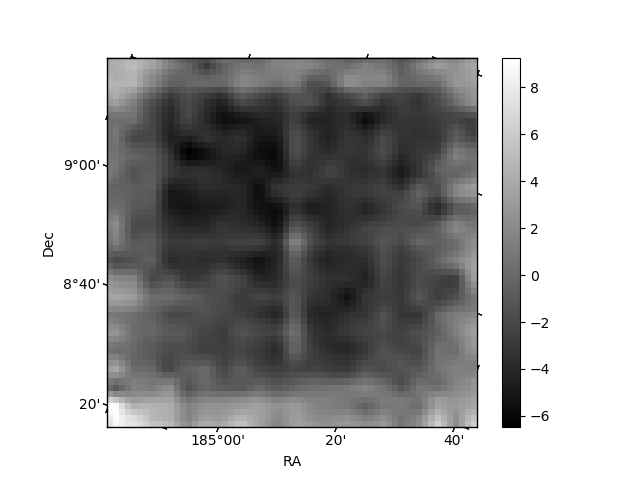
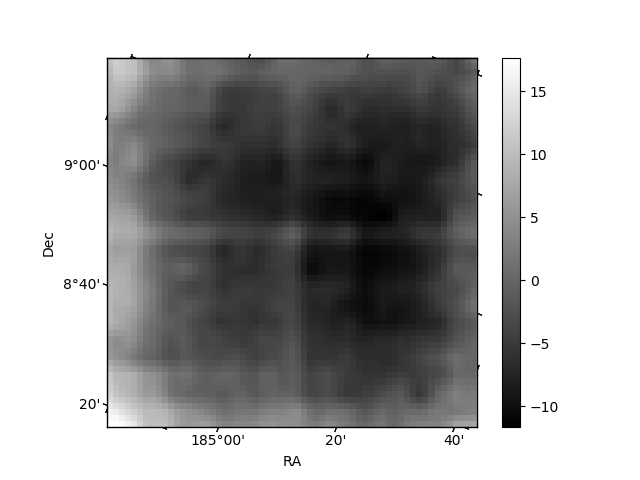
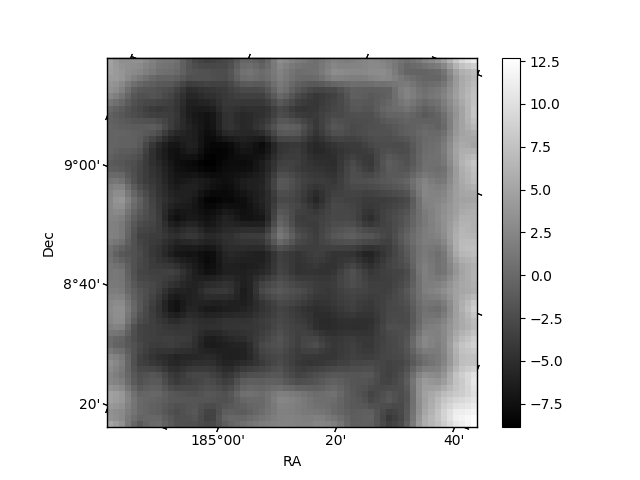
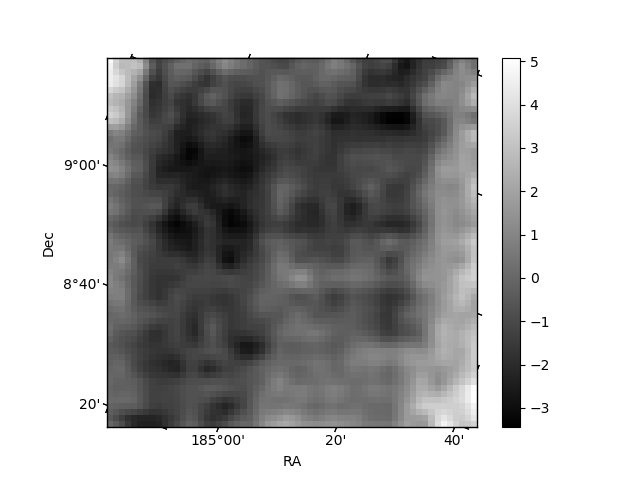
Histogram calculated using DETX and DETY for each event in the final _common_clean file
| Quadrant A | 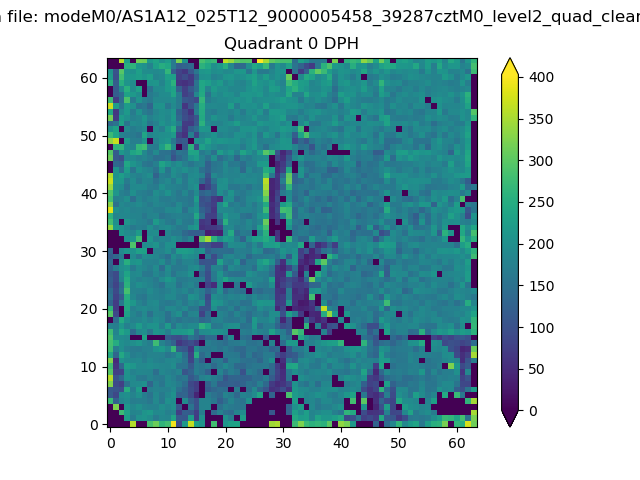 |
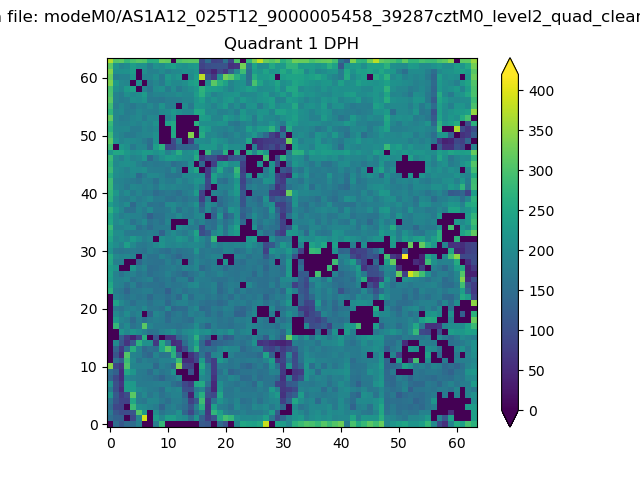 |
Quadrant B |
|---|---|---|---|
| Quadrant D | 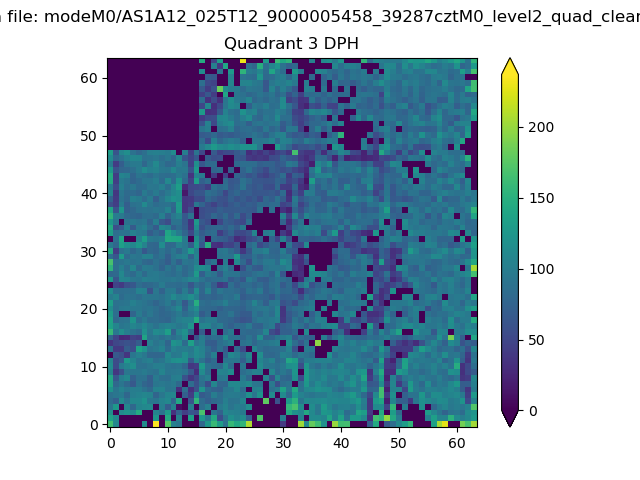 |
 |
Quadrant C |
| Plot type | Count rate plots | Images |
|---|---|---|
| Comparison with Poisson distribution Blue bars denote a histogram of data divided into 1 sec bins. Red curve is a Poisson curve with rate = median count rate of data. |
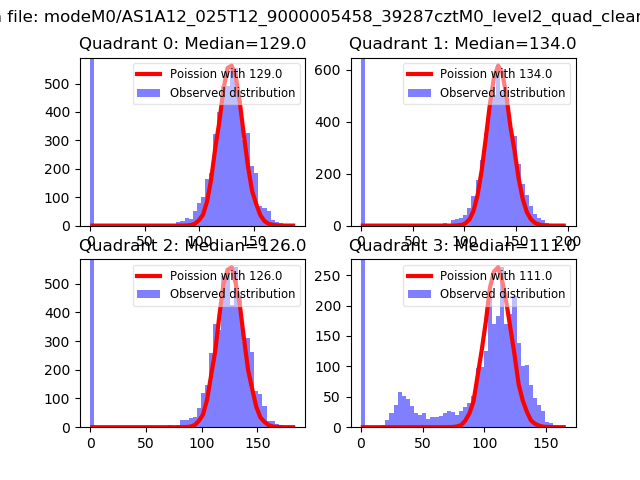 |
 |
| Quadrant-wise count rates Data is divided into 100 sec bins |
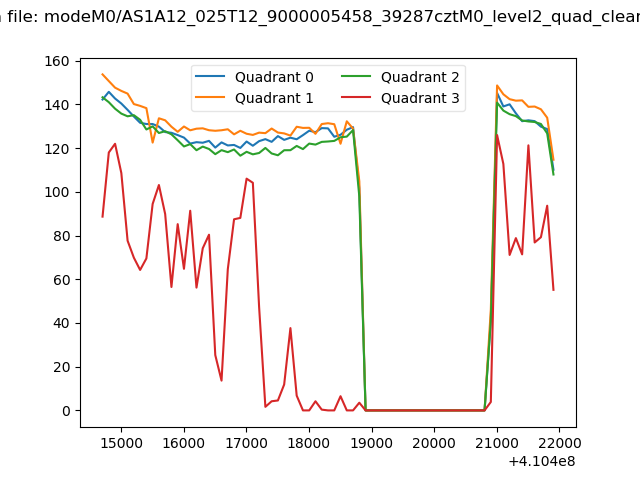 |
|
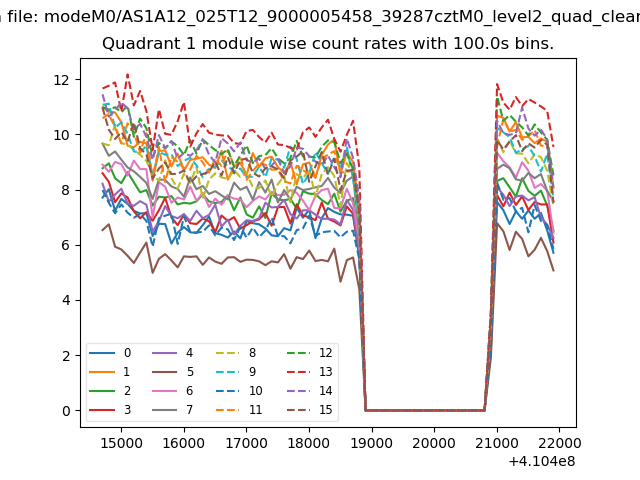
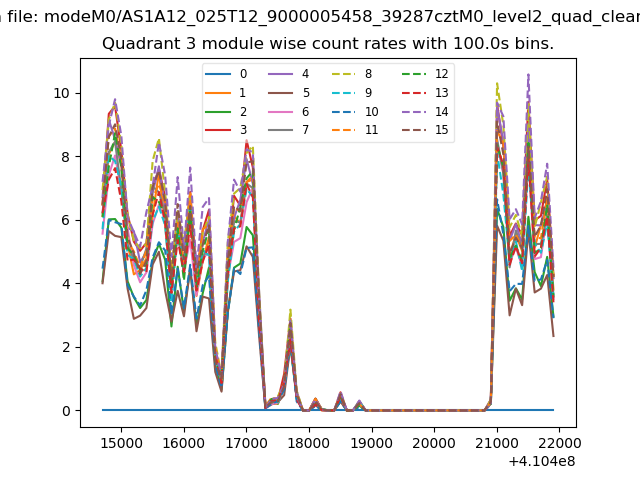
| Module-wise count rates for Quadrant A Data is divided into 100 sec bins |
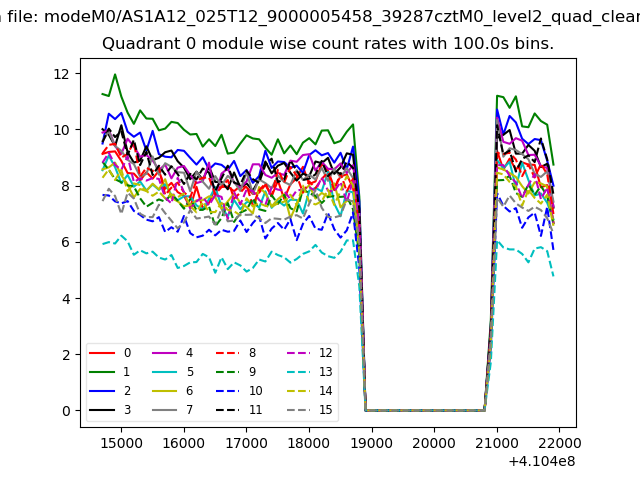 |
 |
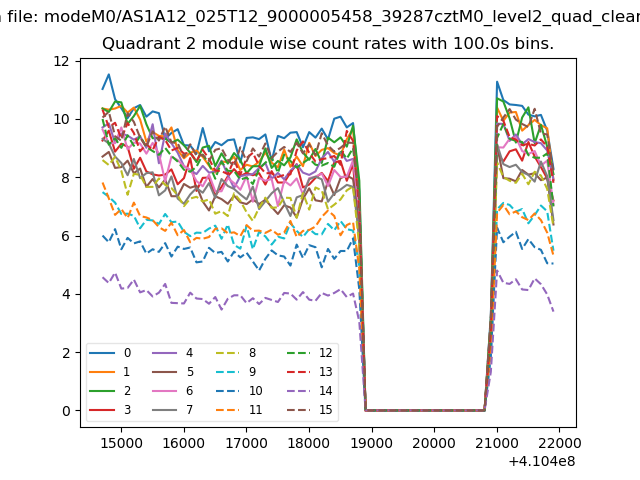
| Module-wise count rates for Quadrant B Data is divided into 100 sec bins |
 |
 |
| Module-wise count rates for Quadrant C Data is divided into 100 sec bins |
 |
 |
| Module-wise count rates for Quadrant D Data is divided into 100 sec bins |
 |
 |
| Parameter | Plot |
|---|---|
| CZT HV Monitor | 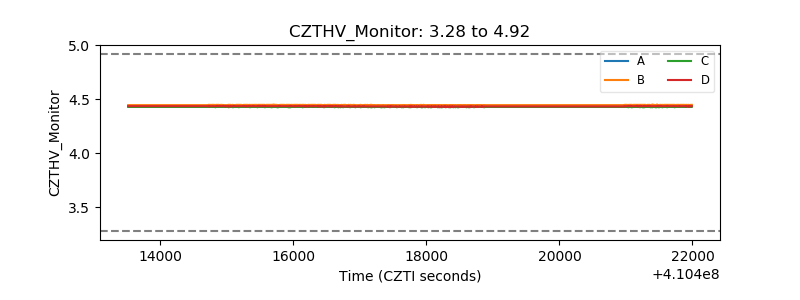 |
| D_VDD | 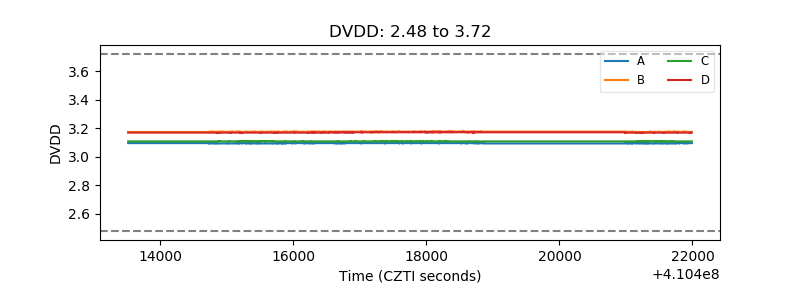 |
| Temperature 1 | 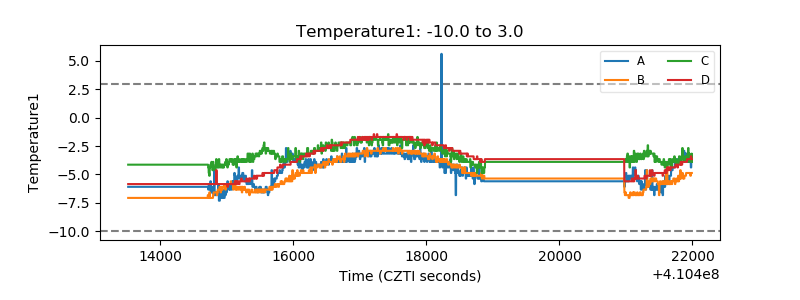 |
| Veto HV Monitor | 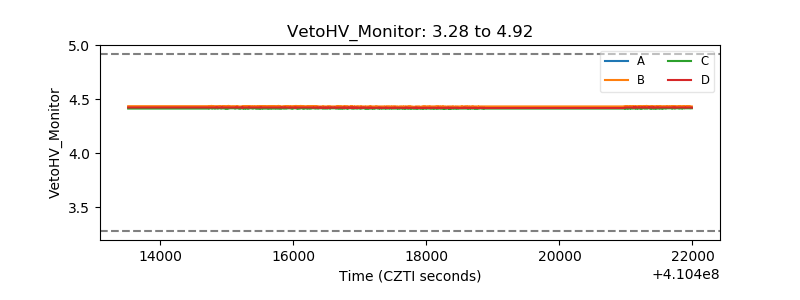 |
| Veto LLD | 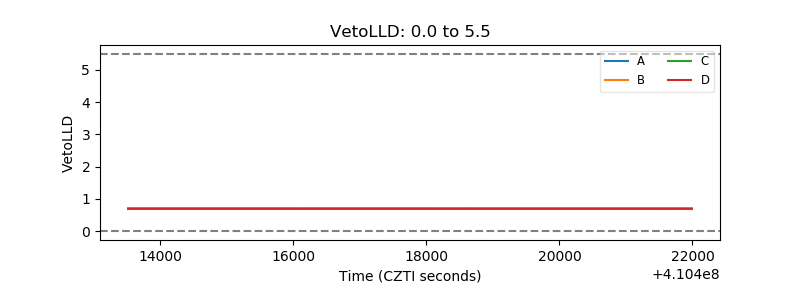 |
| Alpha Counter |  |
| _CPM_Rate | 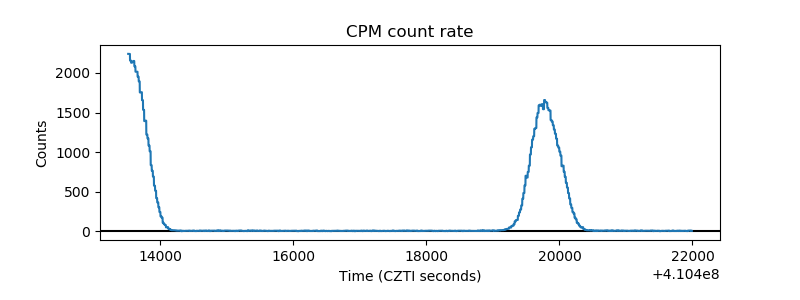 |
| CZT Counter | 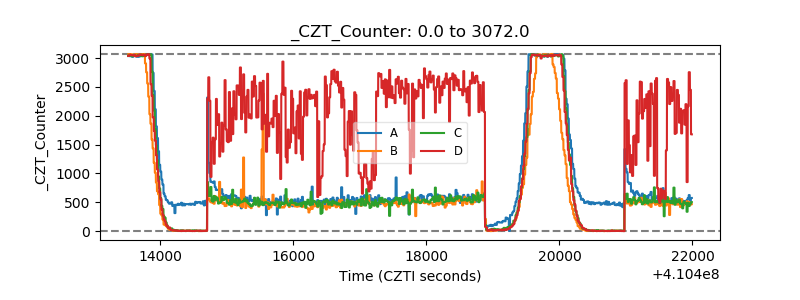 |
| +2.5 Volts monitor | 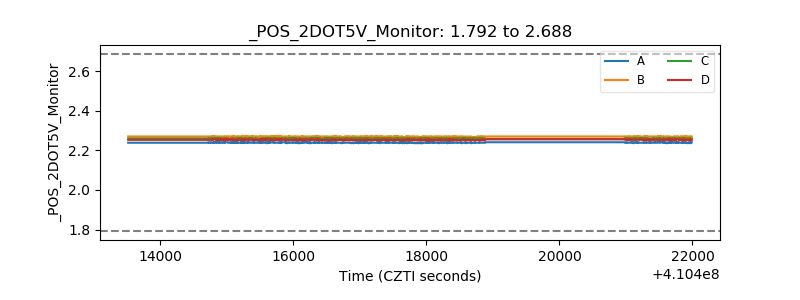 |
| +5 Volts monitor | 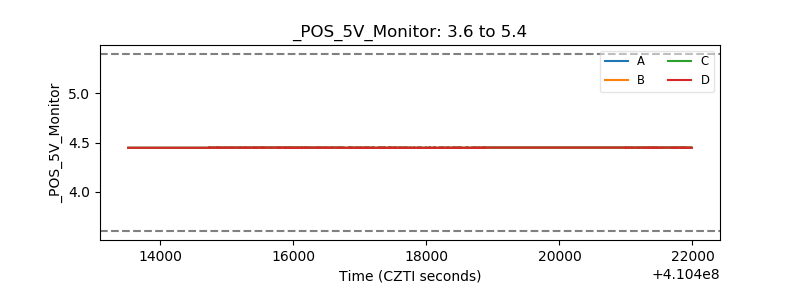 |
| _ROLL_ROT | 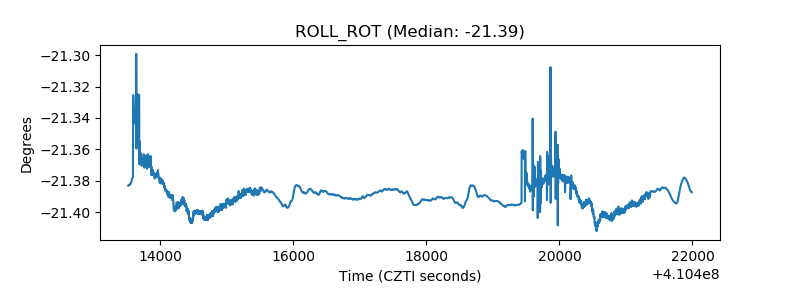 |
| _Roll_DEC | 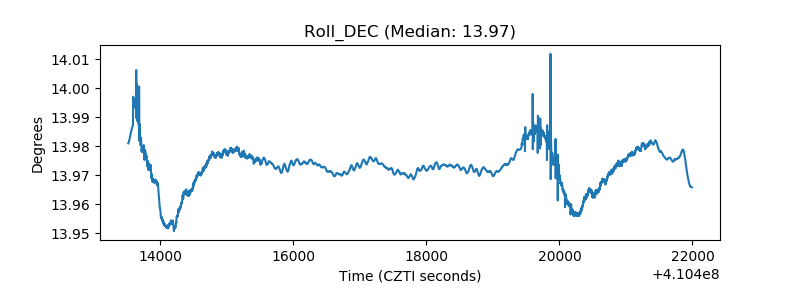 |
| _Roll_RA | 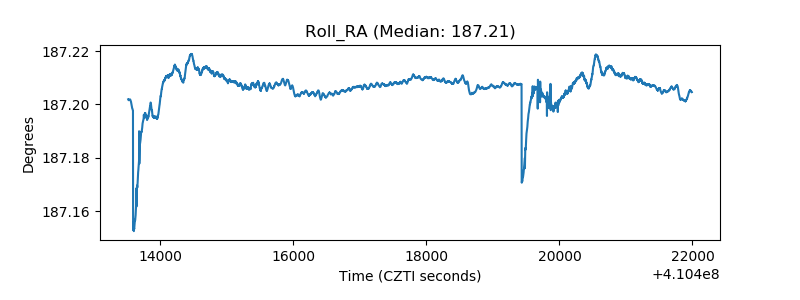 |
| Veto Counter | 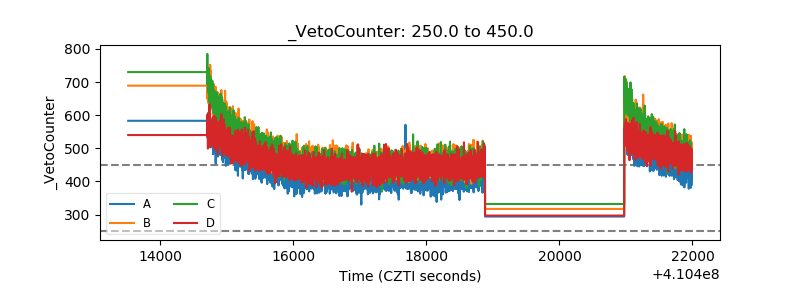 |