| Param | Original file | Final file |
|---|---|---|
| Filename | modeM0/AS1A12_025T12_9000005458_39288cztM0_level2.fits | modeM0/AS1A12_025T12_9000005458_39288cztM0_level2_quad_clean.evt |
| Size (bytes) | 556,473,600 | 78,629,760 |
| Size | 530.7 MB | 75.0 MB |
| Events in quadrant A | 2,857,101 | 635,188 |
| Events in quadrant B | 2,633,452 | 649,165 |
| Events in quadrant C | 2,811,494 | 619,341 |
| Events in quadrant D | 11,907,813 | 126,958 |
| Mode SS | |||
|---|---|---|---|
| Quadrant | BADHDUFLAG | Total packets | Discarded packets |
| A | 0 | 102 | 0 |
| B | 0 | 102 | 0 |
| C | 0 | 102 | 0 |
| D | 0 | 102 | 0 |
| Mode M0 | |||
|---|---|---|---|
| Quadrant | BADHDUFLAG | Total packets | Discarded packets |
| A | 0 | 11323 | 3 |
| B | 0 | 10831 | 2 |
| C | 0 | 11235 | 2 |
| D | 0 | 38878 | 2 |
| Mode M9 | |||
|---|---|---|---|
| Quadrant | BADHDUFLAG | Total packets | Discarded packets |
| A | 0 | 32 | 0 |
| B | 0 | 32 | 0 |
| C | 0 | 32 | 0 |
| D | 0 | 33 | 0 |
| Quadrant | Total seconds | Saturated seconds | Saturation percentage |
|---|---|---|---|
| A | 4997 | 12 | 0.240144% |
| B | 4997 | 90 | 1.801081% |
| C | 4997 | 8 | 0.160096% |
| D | 4997 | 4118 | 82.409446% |
Noise dominated data is calculated using 1-second bins in cleaned event files. If a bin has >2000 counts, and if more than 50% of those come from <1% of pixels, then it is considered to be noise-dominated and hence unusable.
| Quadrant | # 1 sec bins | Bins with >0 counts | Bins with >2000 counts | High rate bins dominated by noise | Noise dominated (total time) | Noise dominated (detector-on time) | Marked lightcurve |
|---|---|---|---|---|---|---|---|
| A | 7149 | 4998 | 5 | 5 | 0.07% | 0.10% | 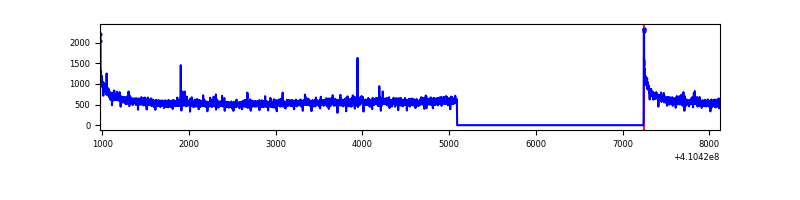 |
| B | 7149 | 4998 | 62 | 62 | 0.87% | 1.24% | 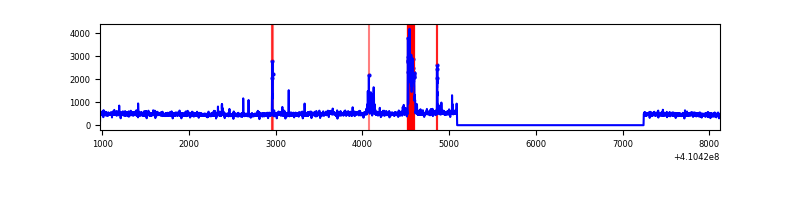 |
| C | 7149 | 4998 | 4 | 4 | 0.06% | 0.08% | 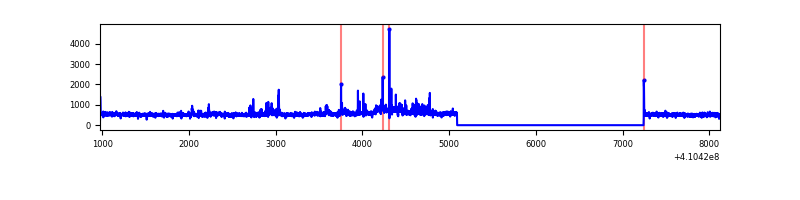 |
| D | 7149 | 4997 | 3776 | 3776 | 52.82% | 75.57% | 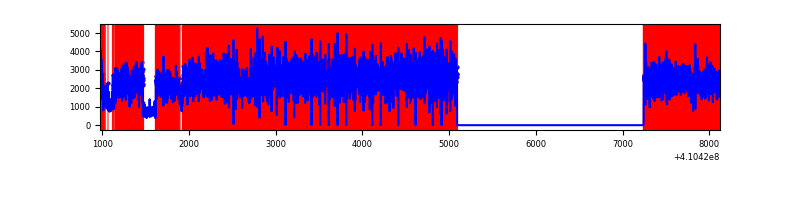 |
Top three noisy pixels from each quadrant. If the there are fewer than three noisy pixels in the level2.evt file, extra rows are filled as -1
| Pixel properties | Quadrant properties | ||||||
|---|---|---|---|---|---|---|---|
| Quadrant | DetID | PixID | Counts | Sigma | Mean | Median | Sigma |
| A | 10 | 83 | 420764 | 3406.34 | 609 | 597 | 123.3 |
| A | 15 | 222 | 72246 | 580.87 | 609 | 597 | 123.3 |
| A | 13 | 248 | 11931 | 91.89 | 609 | 597 | 123.3 |
| B | 5 | 172 | 250576 | 2169.61 | 599 | 584 | 115.2 |
| B | 0 | 190 | 21117 | 178.2 | 599 | 584 | 115.2 |
| B | 12 | 111 | 13779 | 114.52 | 599 | 584 | 115.2 |
| C | 9 | 187 | 270486 | 1960.24 | 591 | 596 | 137.7 |
| C | 15 | 214 | 211844 | 1534.32 | 591 | 596 | 137.7 |
| C | 0 | 10 | 11451 | 78.84 | 591 | 596 | 137.7 |
| D | 12 | 235 | 10361787 | 124351.6 | 334 | 324 | 83.3 |
| D | 5 | 222 | 175550 | 2102.95 | 334 | 324 | 83.3 |
| D | 2 | 120 | 28052 | 332.77 | 334 | 324 | 83.3 |
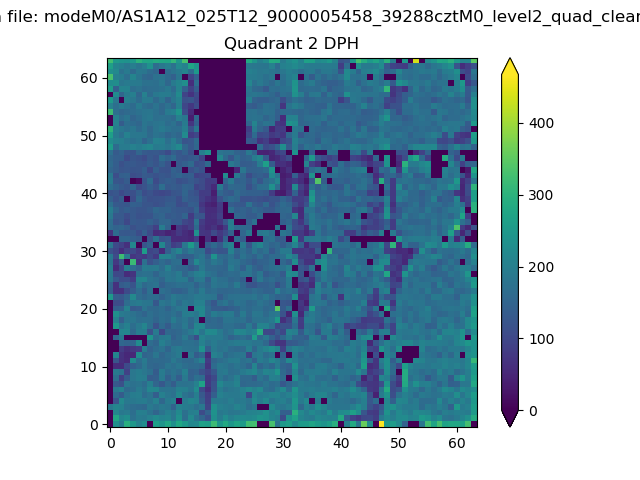
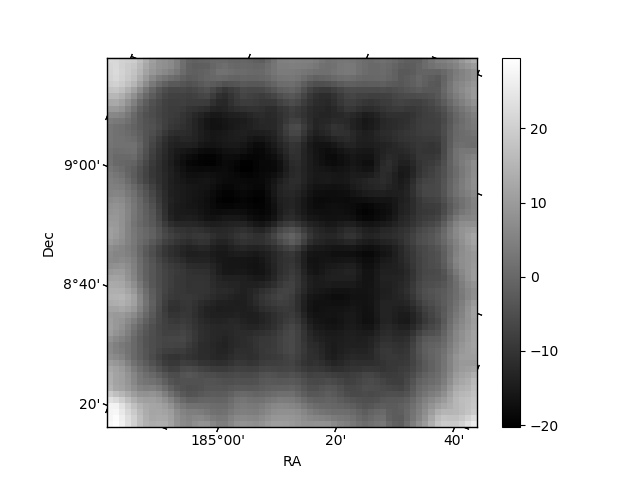
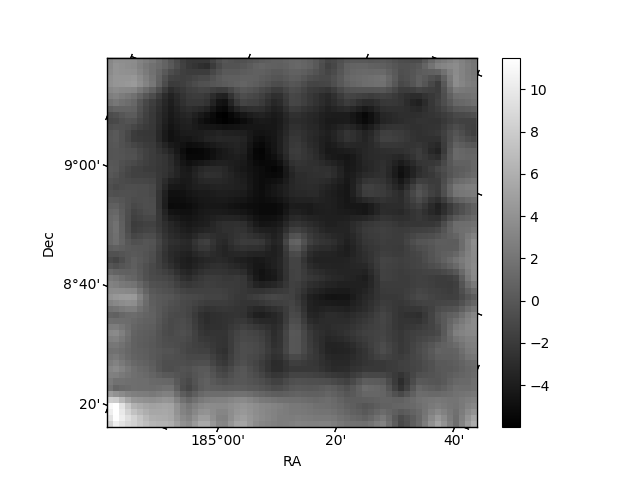
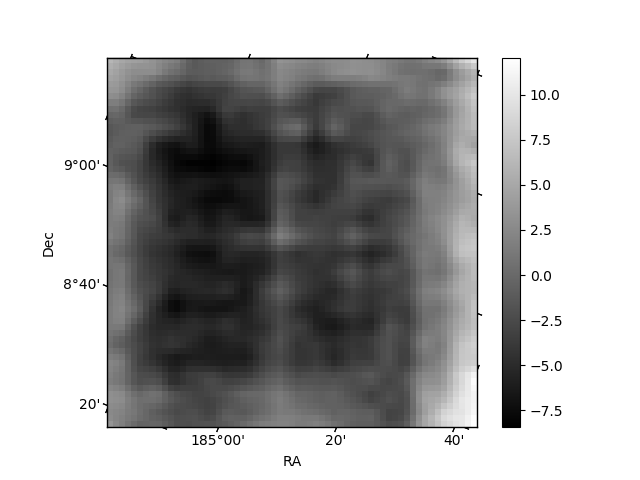
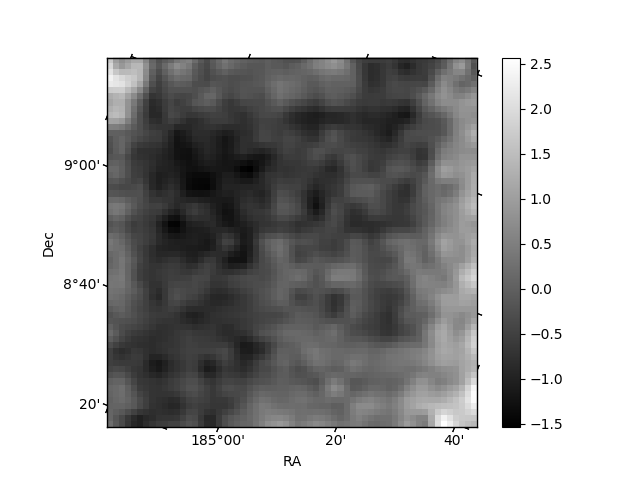
Histogram calculated using DETX and DETY for each event in the final _common_clean file
| Quadrant A | 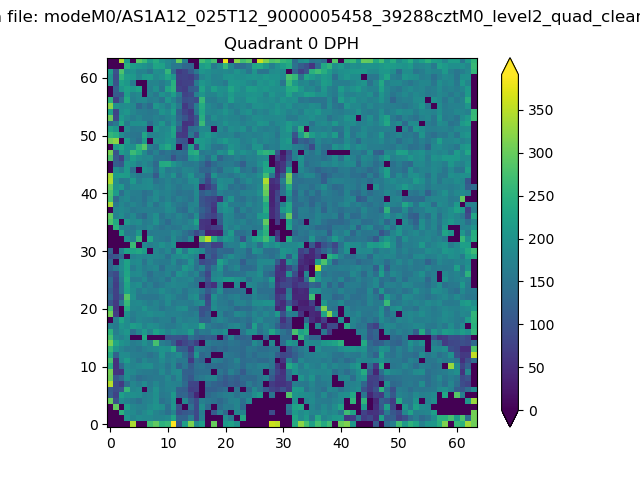 |
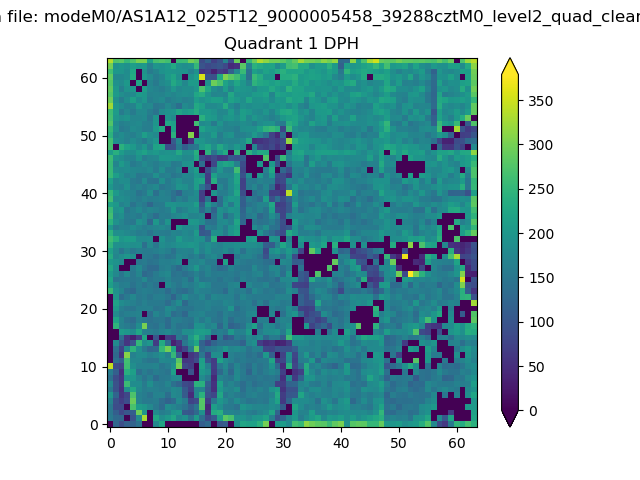 |
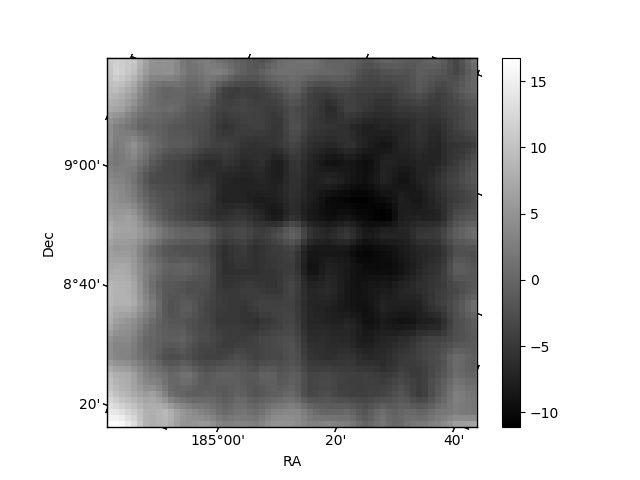
Quadrant B |
|---|---|---|---|
| Quadrant D | 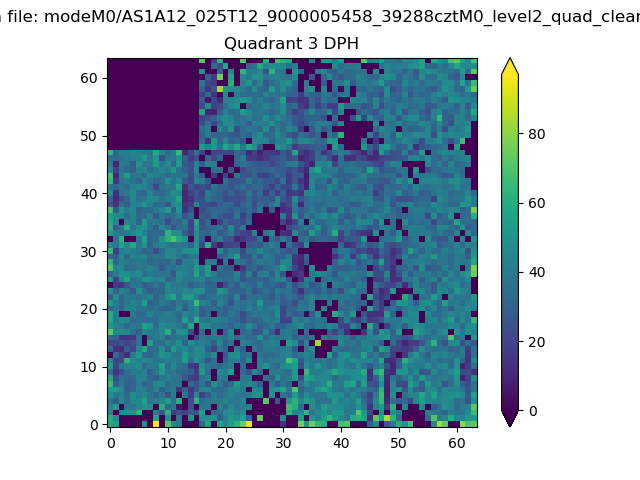 |
 |
Quadrant C |
| Plot type | Count rate plots | Images |
|---|---|---|
| Comparison with Poisson distribution Blue bars denote a histogram of data divided into 1 sec bins. Red curve is a Poisson curve with rate = median count rate of data. |
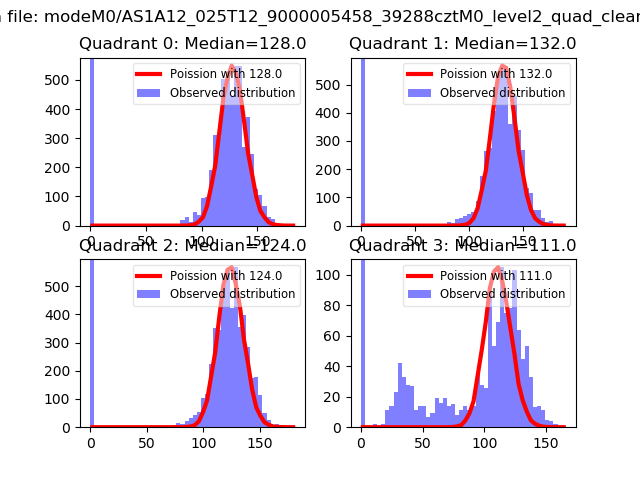 |
 |
| Quadrant-wise count rates Data is divided into 100 sec bins |
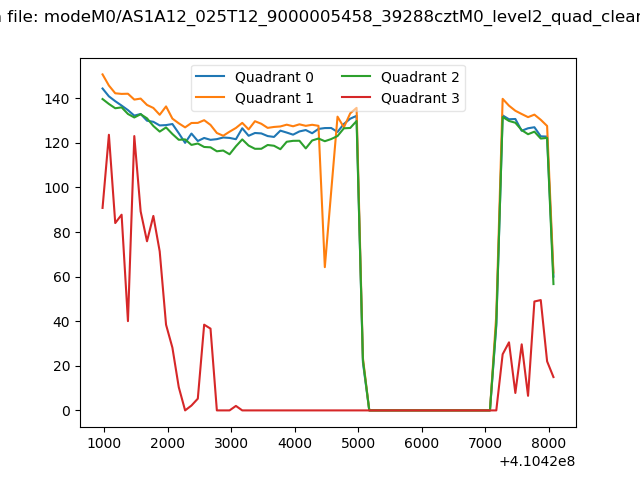 |
|
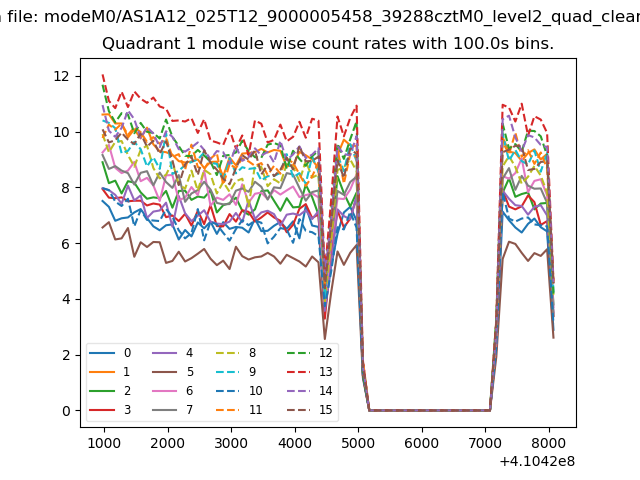
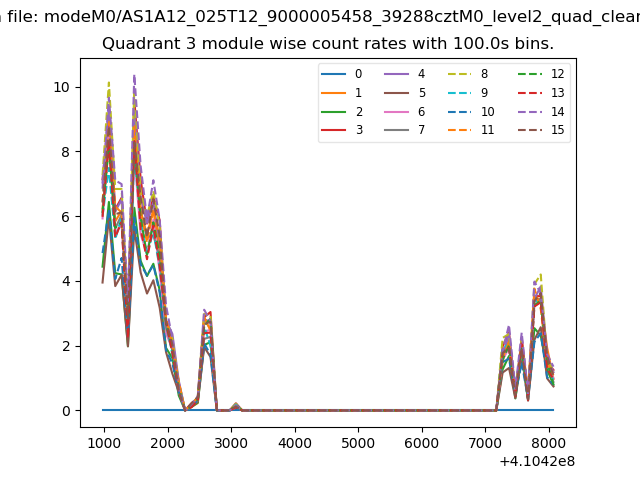
| Module-wise count rates for Quadrant A Data is divided into 100 sec bins |
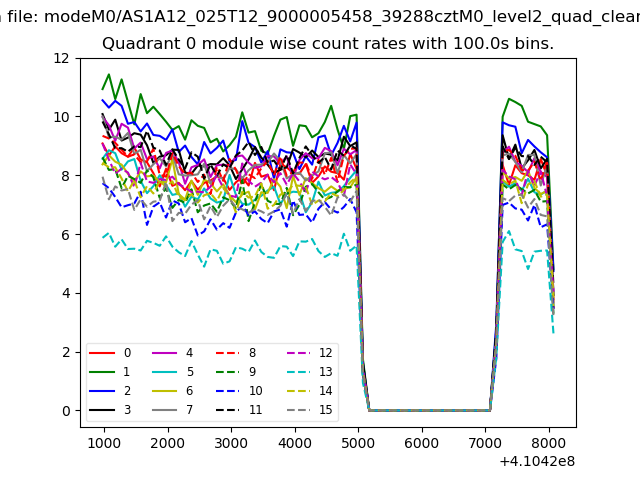 |
 |
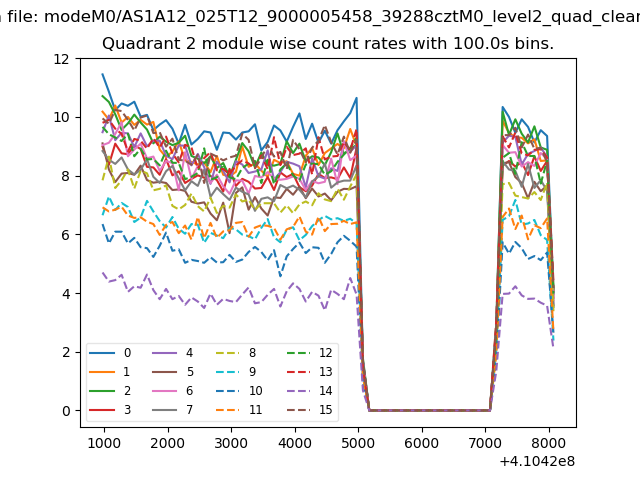
| Module-wise count rates for Quadrant B Data is divided into 100 sec bins |
 |
 |
| Module-wise count rates for Quadrant C Data is divided into 100 sec bins |
 |
 |
| Module-wise count rates for Quadrant D Data is divided into 100 sec bins |
 |
 |
| Parameter | Plot |
|---|---|
| CZT HV Monitor | 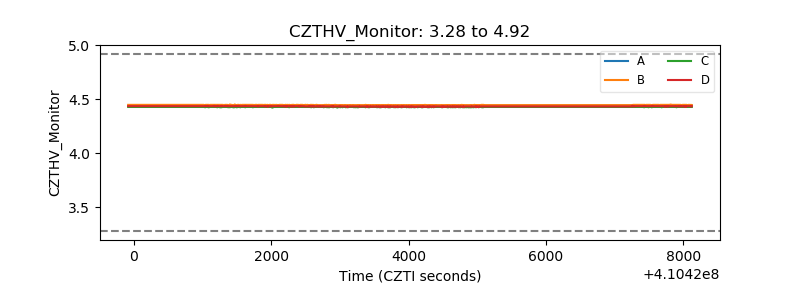 |
| D_VDD | 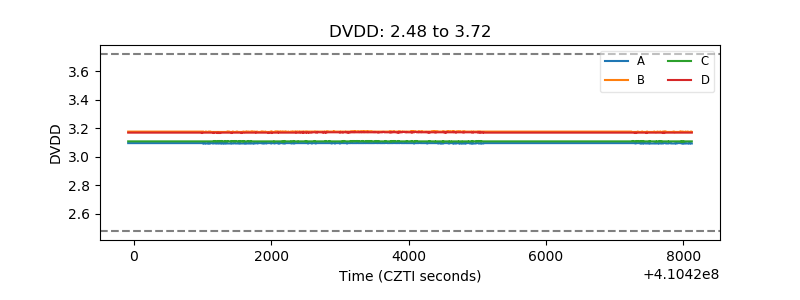 |
| Temperature 1 | 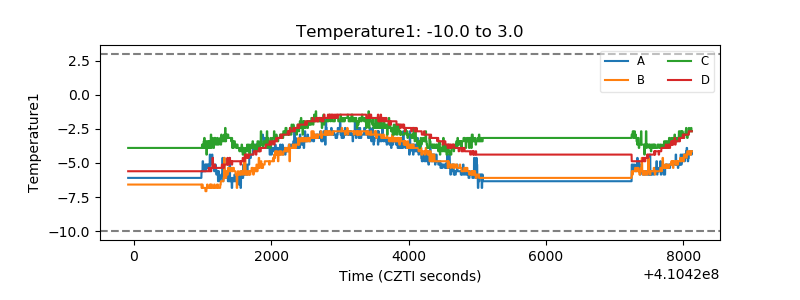 |
| Veto HV Monitor | 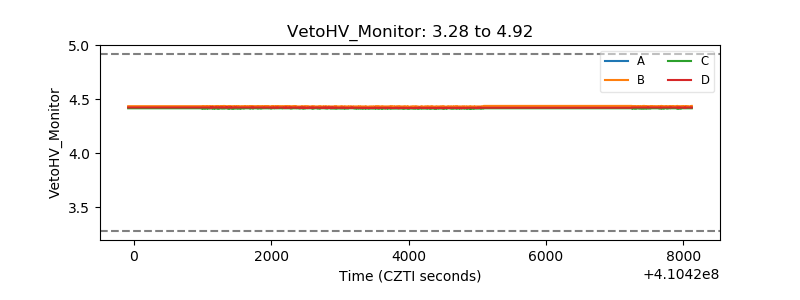 |
| Veto LLD | 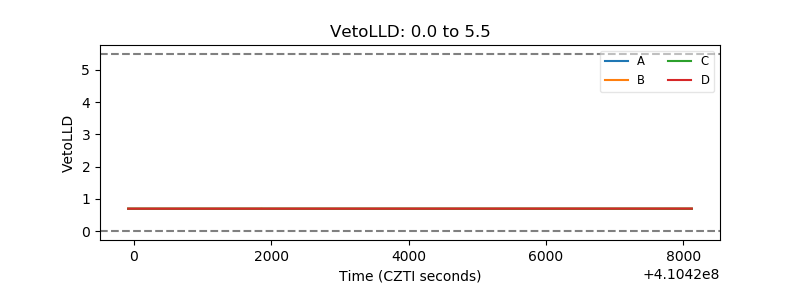 |
| Alpha Counter | 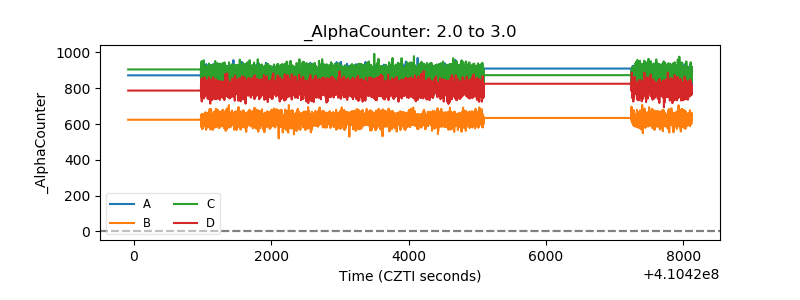 |
| _CPM_Rate | 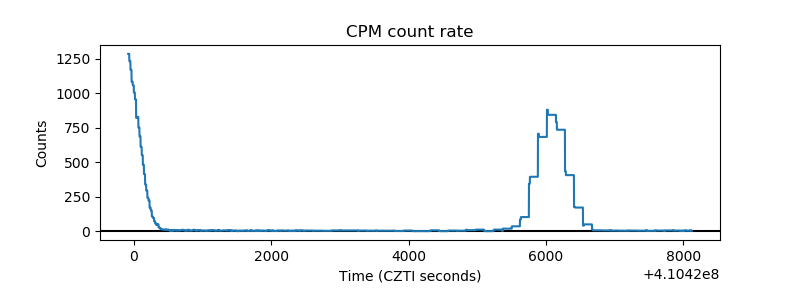 |
| CZT Counter | 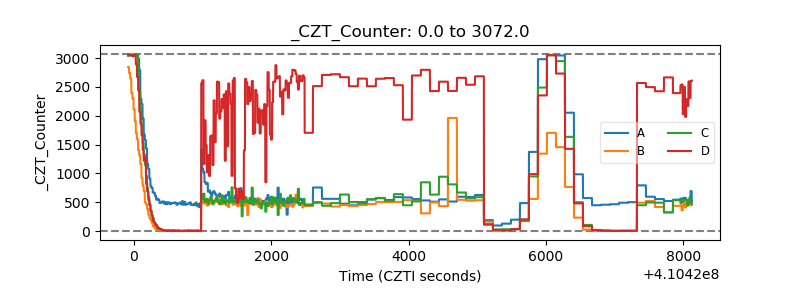 |
| +2.5 Volts monitor | 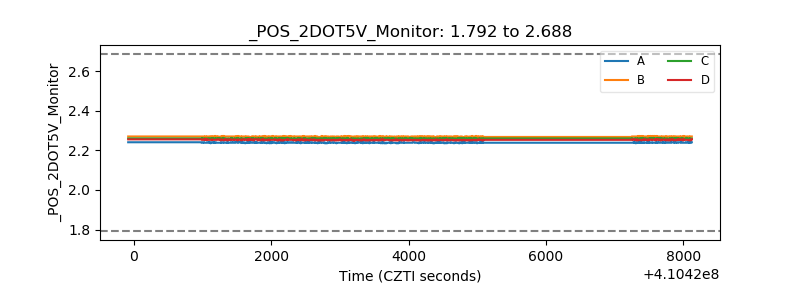 |
| +5 Volts monitor | 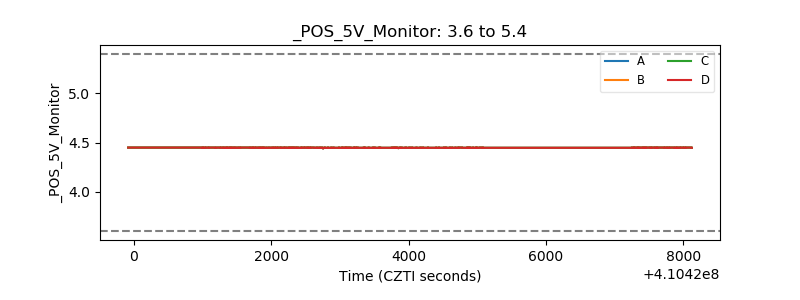 |
| _ROLL_ROT | 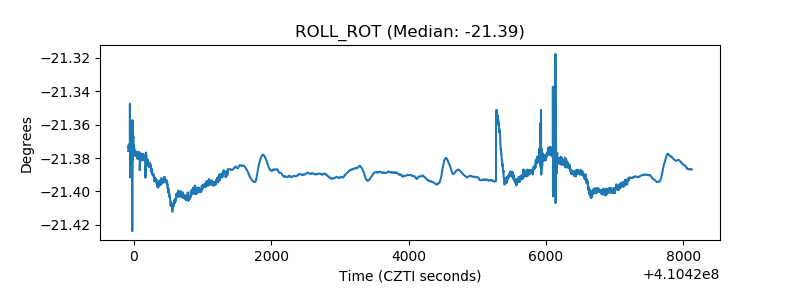 |
| _Roll_DEC | 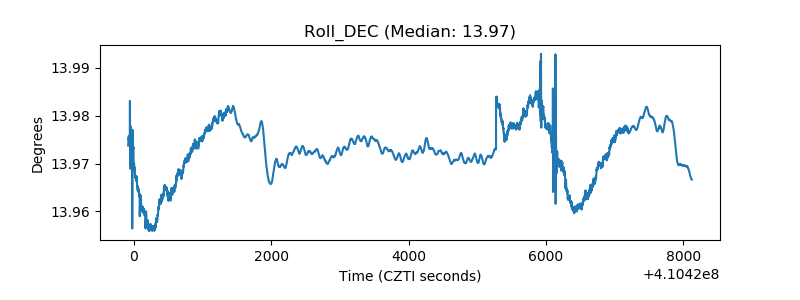 |
| _Roll_RA | 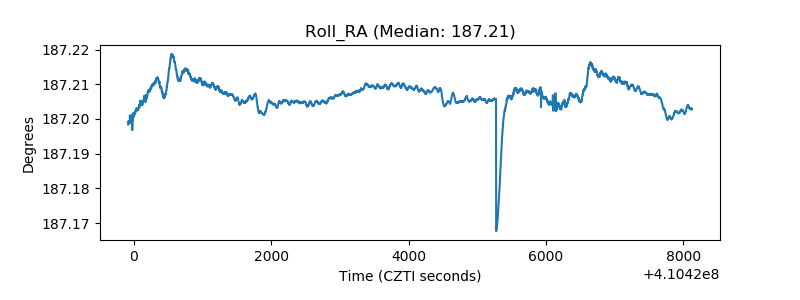 |
| Veto Counter | 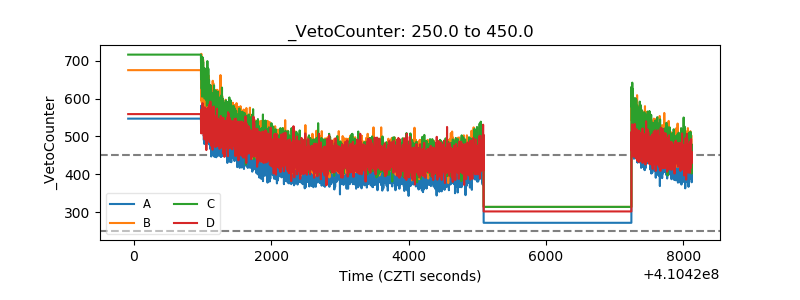 |