| Param | Original file | Final file |
|---|---|---|
| Filename | modeM0/AS1A12_025T12_9000005458_39289cztM0_level2.fits | modeM0/AS1A12_025T12_9000005458_39289cztM0_level2_quad_clean.evt |
| Size (bytes) | 559,172,160 | 71,876,160 |
| Size | 533.3 MB | 68.5 MB |
| Events in quadrant A | 2,748,243 | 598,370 |
| Events in quadrant B | 2,430,271 | 611,504 |
| Events in quadrant C | 2,707,696 | 580,219 |
| Events in quadrant D | 12,430,235 | 42,807 |
| Mode SS | |||
|---|---|---|---|
| Quadrant | BADHDUFLAG | Total packets | Discarded packets |
| A | 0 | 98 | 0 |
| B | 0 | 98 | 0 |
| C | 0 | 98 | 0 |
| D | 0 | 98 | 0 |
| Mode M0 | |||
|---|---|---|---|
| Quadrant | BADHDUFLAG | Total packets | Discarded packets |
| A | 0 | 10844 | 2 |
| B | 0 | 10309 | 1 |
| C | 0 | 10723 | 1 |
| D | 0 | 40340 | 1 |
| Mode M9 | |||
|---|---|---|---|
| Quadrant | BADHDUFLAG | Total packets | Discarded packets |
| A | 0 | 30 | 0 |
| B | 0 | 30 | 0 |
| C | 0 | 30 | 0 |
| D | 0 | 31 | 0 |
| Quadrant | Total seconds | Saturated seconds | Saturation percentage |
|---|---|---|---|
| A | 4904 | 13 | 0.265090% |
| B | 4904 | 45 | 0.917618% |
| C | 4904 | 43 | 0.876835% |
| D | 4904 | 4613 | 94.066069% |
Noise dominated data is calculated using 1-second bins in cleaned event files. If a bin has >2000 counts, and if more than 50% of those come from <1% of pixels, then it is considered to be noise-dominated and hence unusable.
| Quadrant | # 1 sec bins | Bins with >0 counts | Bins with >2000 counts | High rate bins dominated by noise | Noise dominated (total time) | Noise dominated (detector-on time) | Marked lightcurve |
|---|---|---|---|---|---|---|---|
| A | 7027 | 4905 | 5 | 5 | 0.07% | 0.10% | 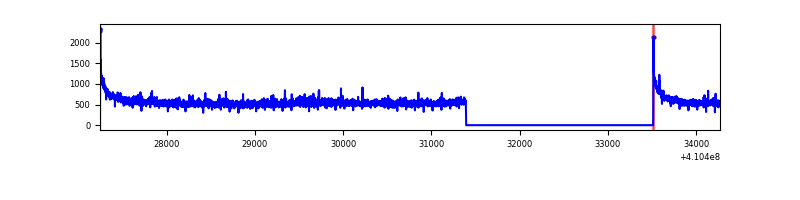 |
| B | 7027 | 4905 | 33 | 33 | 0.47% | 0.67% | 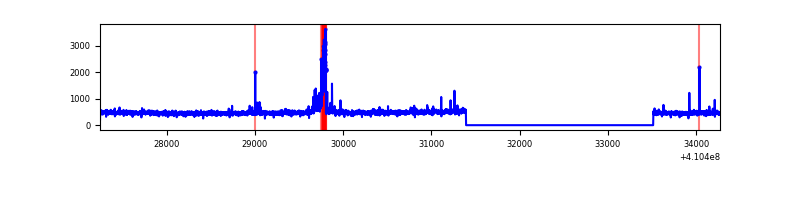 |
| C | 7027 | 4905 | 39 | 39 | 0.56% | 0.80% | 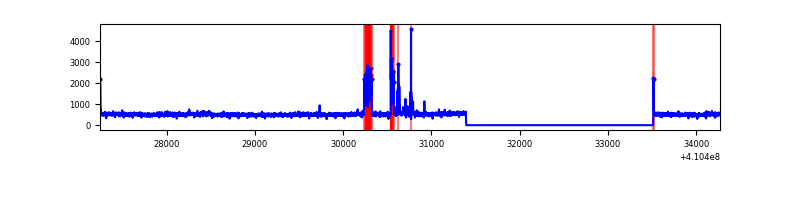 |
| D | 7027 | 4905 | 3954 | 3954 | 56.27% | 80.61% | 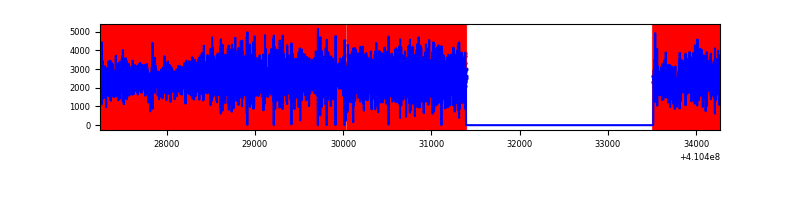 |
Top three noisy pixels from each quadrant. If the there are fewer than three noisy pixels in the level2.evt file, extra rows are filled as -1
| Pixel properties | Quadrant properties | ||||||
|---|---|---|---|---|---|---|---|
| Quadrant | DetID | PixID | Counts | Sigma | Mean | Median | Sigma |
| A | 10 | 83 | 402495 | 3411.32 | 585 | 574 | 117.8 |
| A | 15 | 222 | 77280 | 651.05 | 585 | 574 | 117.8 |
| A | 13 | 248 | 6373 | 49.22 | 585 | 574 | 117.8 |
| B | 5 | 172 | 150444 | 1354.57 | 573 | 558 | 110.7 |
| B | 5 | 255 | 17854 | 156.31 | 573 | 558 | 110.7 |
| B | 12 | 111 | 13402 | 116.08 | 573 | 558 | 110.7 |
| C | 9 | 187 | 259101 | 1955.77 | 569 | 573 | 132.2 |
| C | 15 | 214 | 208197 | 1570.68 | 569 | 573 | 132.2 |
| C | 0 | 10 | 16161 | 117.92 | 569 | 573 | 132.2 |
| D | 12 | 235 | 11091451 | 152813.82 | 288 | 280 | 72.6 |
| D | 5 | 222 | 69413 | 952.51 | 288 | 280 | 72.6 |
| D | 14 | 52 | 46808 | 641.06 | 288 | 280 | 72.6 |
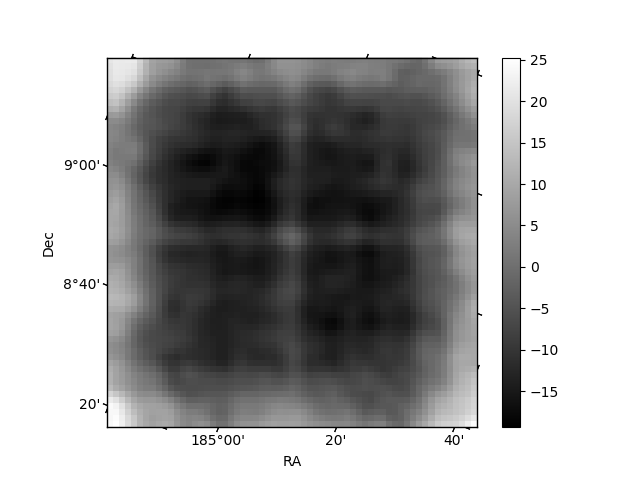
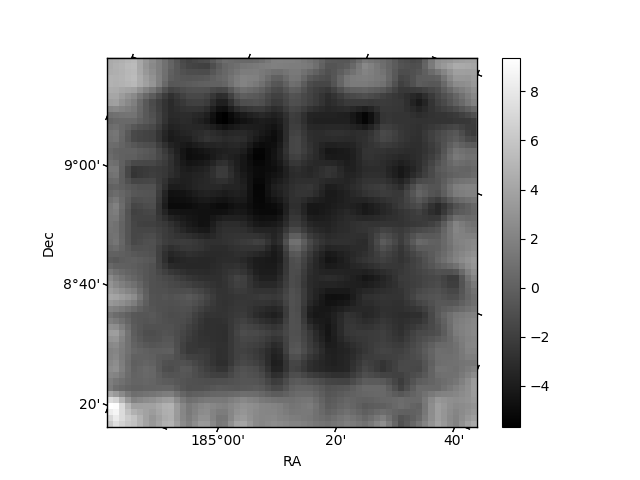
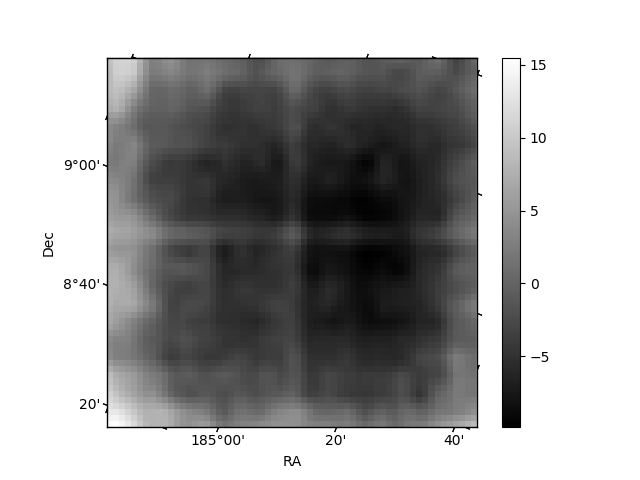
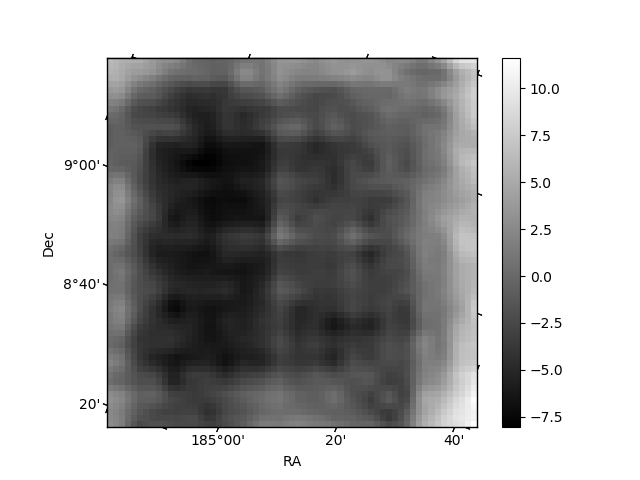
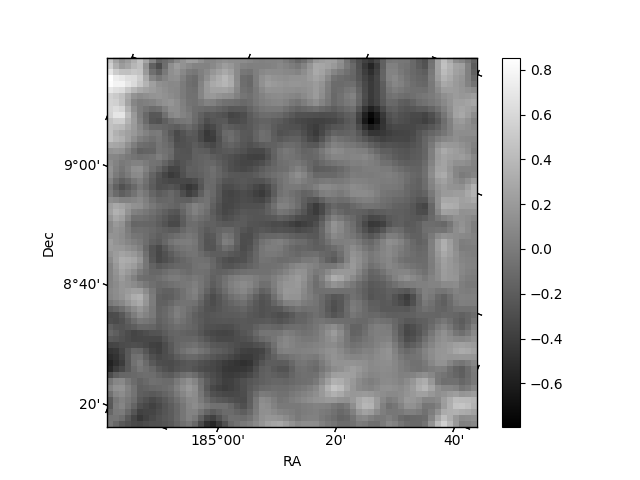
Histogram calculated using DETX and DETY for each event in the final _common_clean file
| Quadrant A | 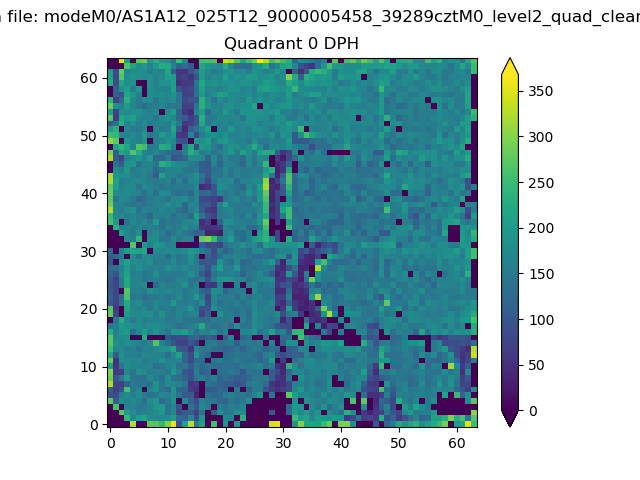 |
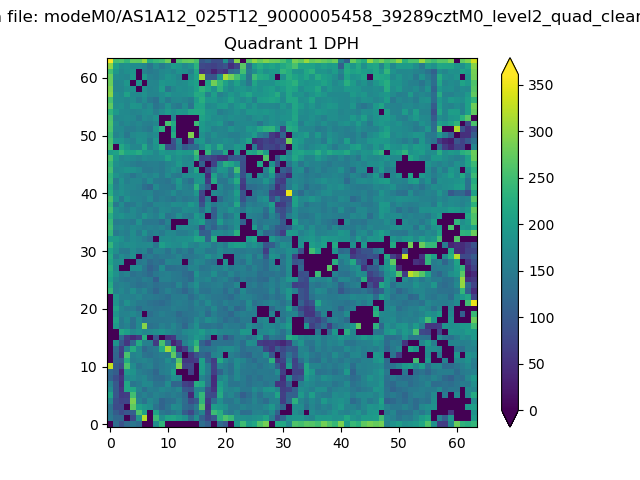 |
Quadrant B |
|---|---|---|---|
| Quadrant D | 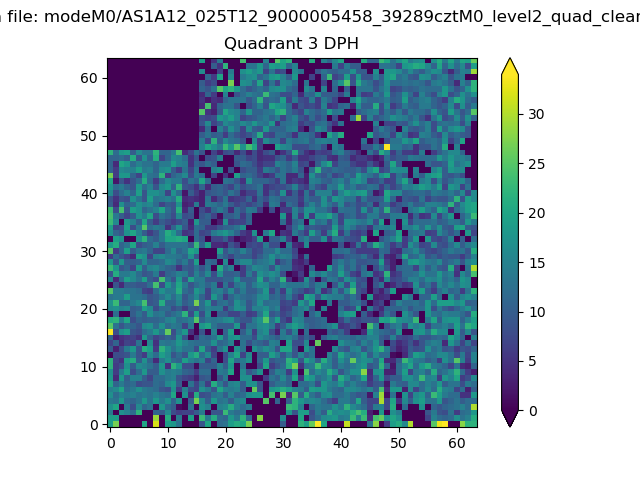 |
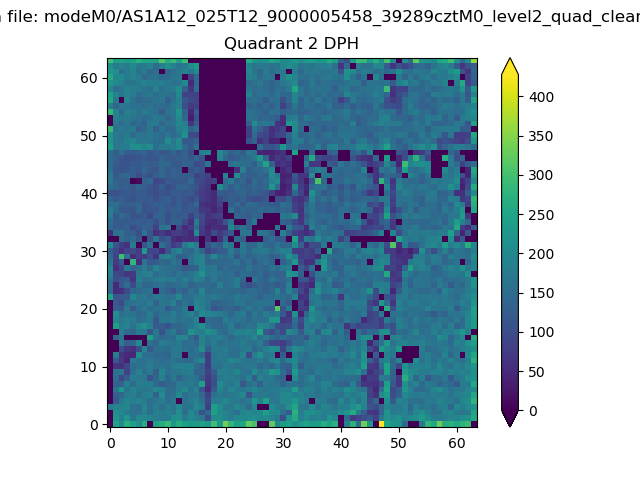 |
Quadrant C |
| Plot type | Count rate plots | Images |
|---|---|---|
| Comparison with Poisson distribution Blue bars denote a histogram of data divided into 1 sec bins. Red curve is a Poisson curve with rate = median count rate of data. |
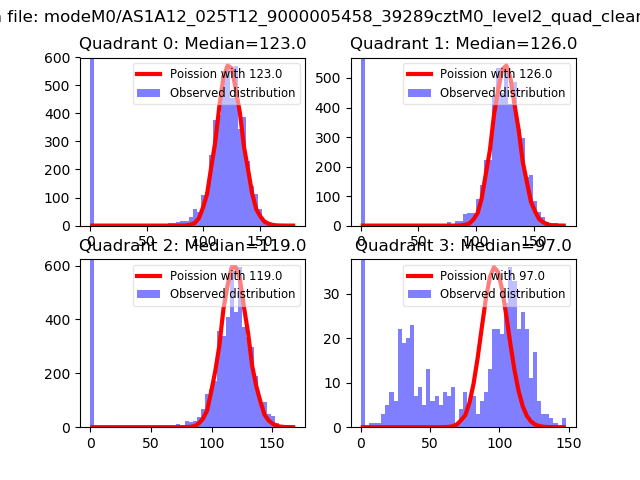 |
 |
| Quadrant-wise count rates Data is divided into 100 sec bins |
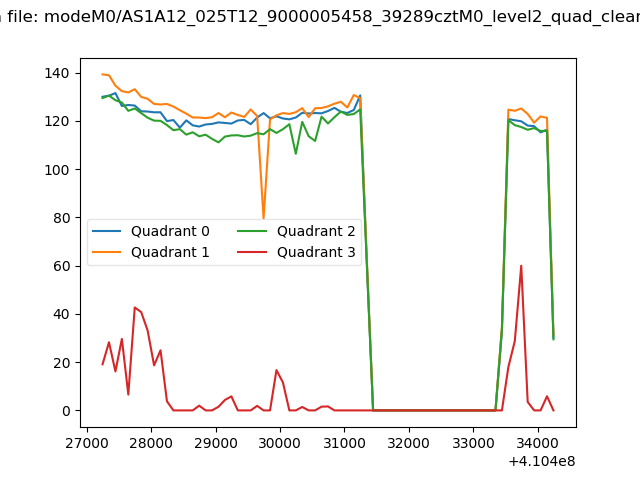 |
|
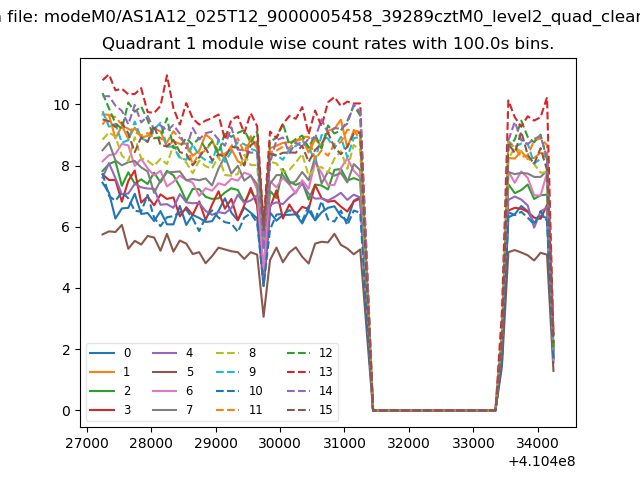
| Module-wise count rates for Quadrant A Data is divided into 100 sec bins |
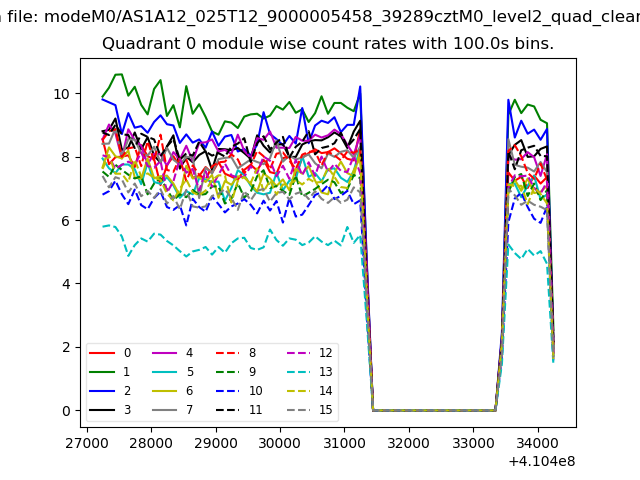 |
 |
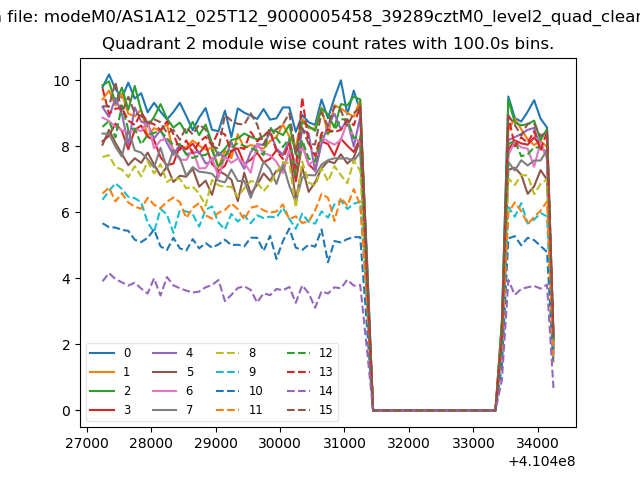
| Module-wise count rates for Quadrant B Data is divided into 100 sec bins |
 |
 |
| Module-wise count rates for Quadrant C Data is divided into 100 sec bins |
 |
 |
| Module-wise count rates for Quadrant D Data is divided into 100 sec bins |
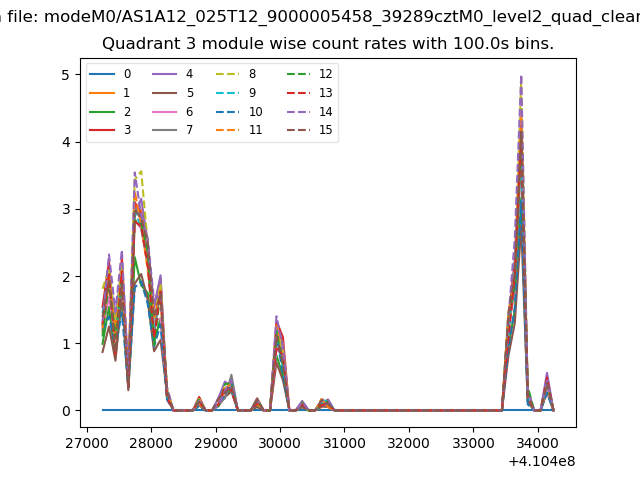 |
 |
| Parameter | Plot |
|---|---|
| CZT HV Monitor | 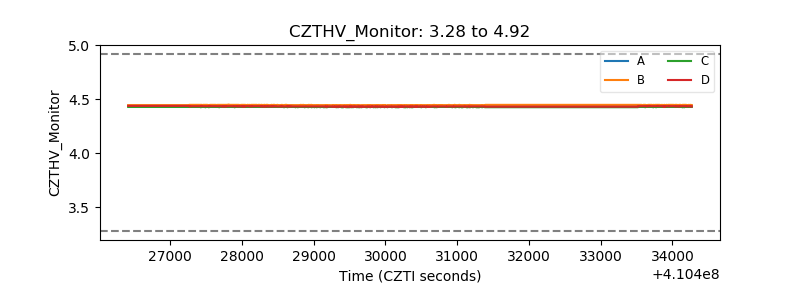 |
| D_VDD | 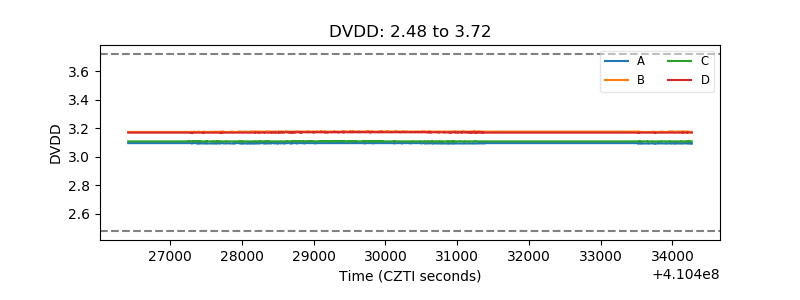 |
| Temperature 1 | 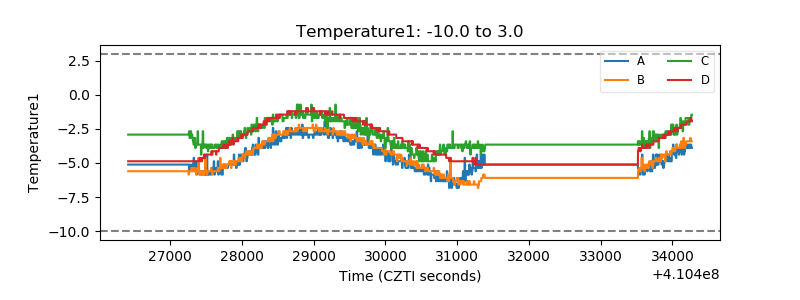 |
| Veto HV Monitor | 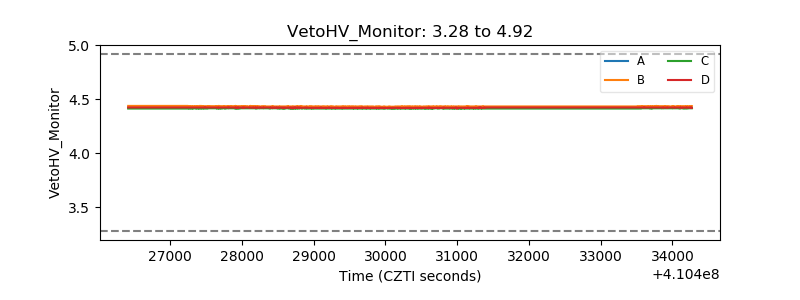 |
| Veto LLD | 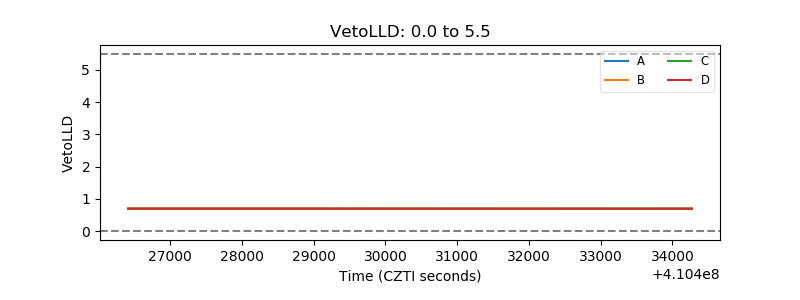 |
| Alpha Counter | 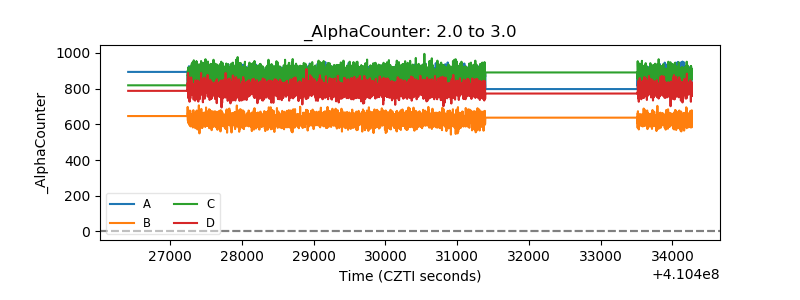 |
| _CPM_Rate | 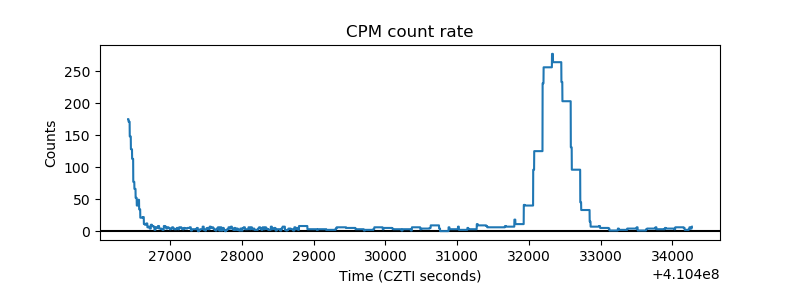 |
| CZT Counter | 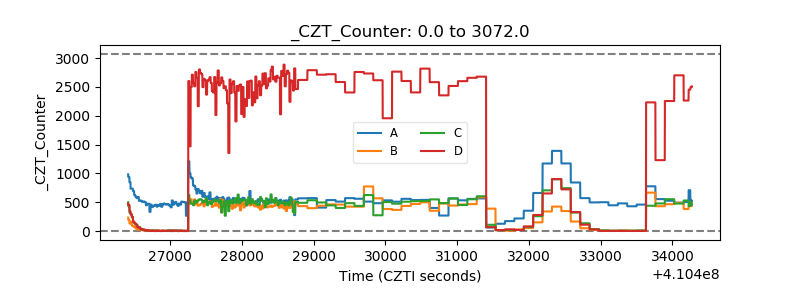 |
| +2.5 Volts monitor |  |
| +5 Volts monitor | 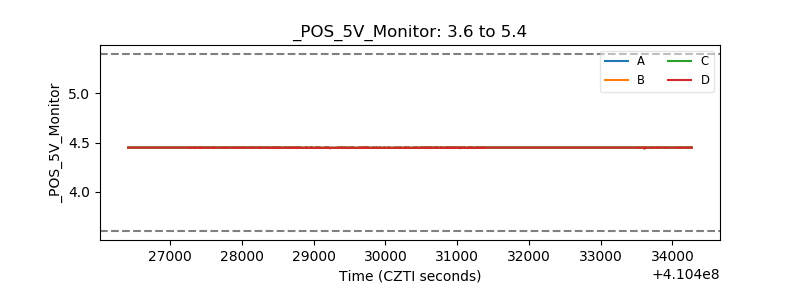 |
| _ROLL_ROT | 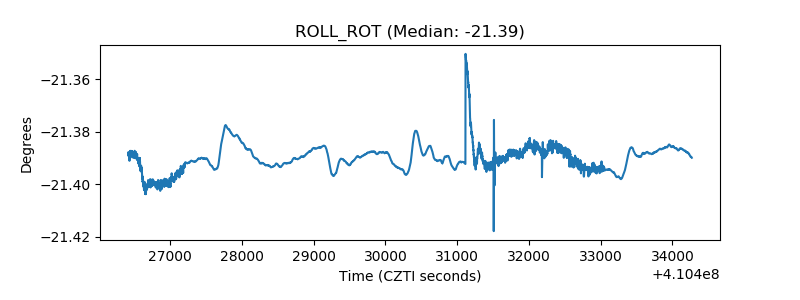 |
| _Roll_DEC | 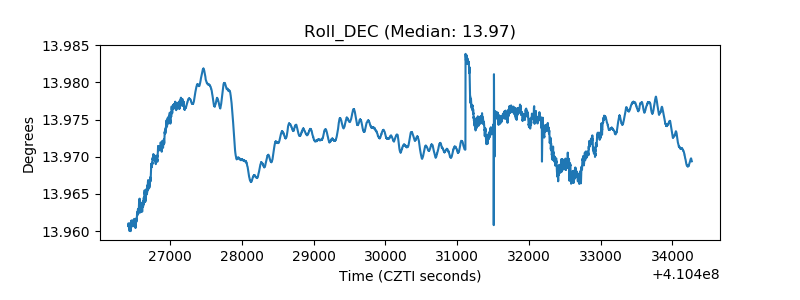 |
| _Roll_RA | 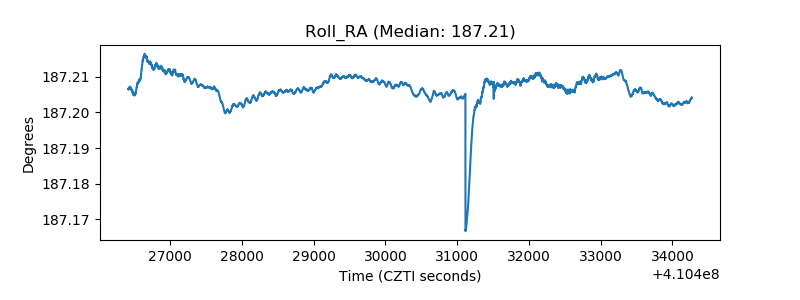 |
| Veto Counter | 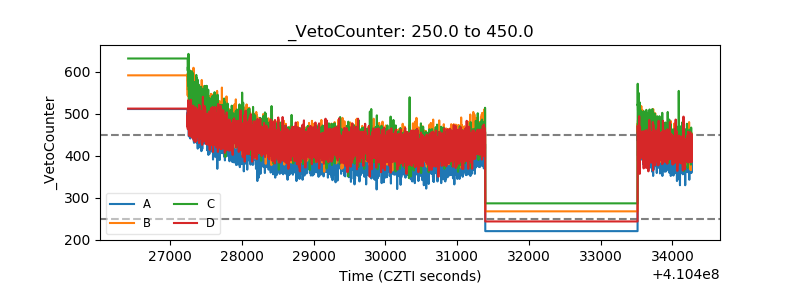 |