| Param | Original file | Final file |
|---|---|---|
| Filename | modeM0/AS1A12_025T12_9000005458_39290cztM0_level2.fits | modeM0/AS1A12_025T12_9000005458_39290cztM0_level2_quad_clean.evt |
| Size (bytes) | 463,919,040 | 56,787,840 |
| Size | 442.4 MB | 54.2 MB |
| Events in quadrant A | 2,136,416 | 472,918 |
| Events in quadrant B | 2,355,726 | 470,616 |
| Events in quadrant C | 2,015,930 | 458,919 |
| Events in quadrant D | 10,348,049 | 31,459 |
| Mode SS | |||
|---|---|---|---|
| Quadrant | BADHDUFLAG | Total packets | Discarded packets |
| A | 0 | 80 | 0 |
| B | 0 | 80 | 0 |
| C | 0 | 80 | 0 |
| D | 0 | 80 | 0 |
| Mode M0 | |||
|---|---|---|---|
| Quadrant | BADHDUFLAG | Total packets | Discarded packets |
| A | 0 | 8521 | 0 |
| B | 0 | 9632 | 0 |
| C | 0 | 8331 | 0 |
| D | 0 | 33577 | 0 |
| Mode M9 | |||
|---|---|---|---|
| Quadrant | BADHDUFLAG | Total packets | Discarded packets |
| A | 0 | 2 | 0 |
| B | 0 | 2 | 0 |
| C | 0 | 2 | 0 |
| D | 0 | 3 | 0 |
| Quadrant | Total seconds | Saturated seconds | Saturation percentage |
|---|---|---|---|
| A | 4054 | 7 | 0.172669% |
| B | 4054 | 140 | 3.453379% |
| C | 4054 | 7 | 0.172669% |
| D | 4054 | 3832 | 94.523927% |
Noise dominated data is calculated using 1-second bins in cleaned event files. If a bin has >2000 counts, and if more than 50% of those come from <1% of pixels, then it is considered to be noise-dominated and hence unusable.
| Quadrant | # 1 sec bins | Bins with >0 counts | Bins with >2000 counts | High rate bins dominated by noise | Noise dominated (total time) | Noise dominated (detector-on time) | Marked lightcurve |
|---|---|---|---|---|---|---|---|
| A | 4054 | 4054 | 2 | 2 | 0.05% | 0.05% | 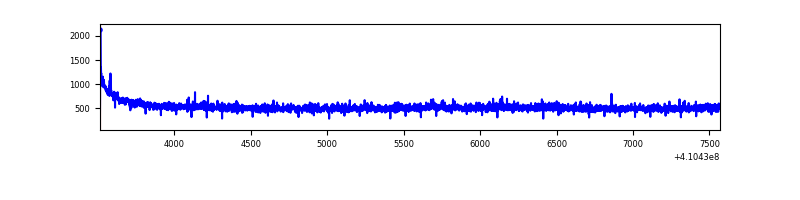 |
| B | 4054 | 4054 | 88 | 88 | 2.17% | 2.17% | 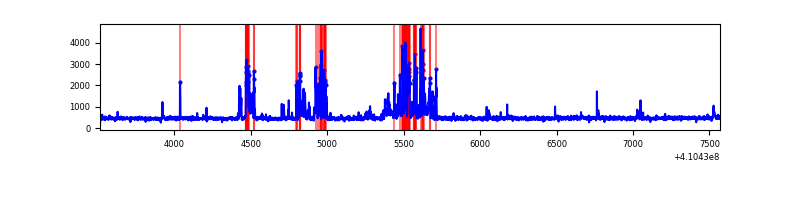 |
| C | 4054 | 4054 | 2 | 2 | 0.05% | 0.05% | 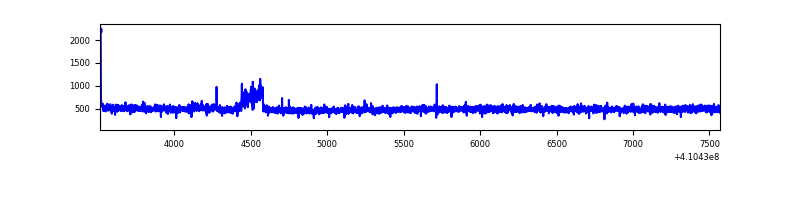 |
| D | 4054 | 4053 | 3342 | 3342 | 82.44% | 82.46% | 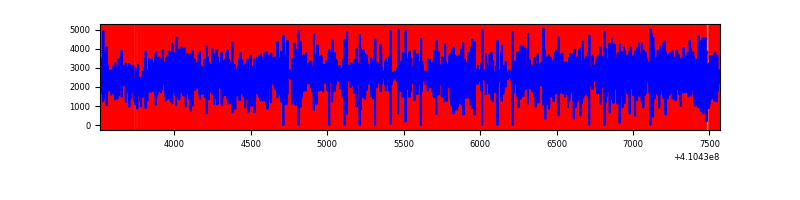 |
Top three noisy pixels from each quadrant. If the there are fewer than three noisy pixels in the level2.evt file, extra rows are filled as -1
| Pixel properties | Quadrant properties | ||||||
|---|---|---|---|---|---|---|---|
| Quadrant | DetID | PixID | Counts | Sigma | Mean | Median | Sigma |
| A | 10 | 83 | 278735 | 2895.19 | 469 | 460 | 96.1 |
| A | 15 | 222 | 43228 | 444.96 | 469 | 460 | 96.1 |
| A | 3 | 137 | 5023 | 47.47 | 469 | 460 | 96.1 |
| B | 5 | 172 | 517449 | 5705.69 | 458 | 445 | 90.6 |
| B | 5 | 255 | 35297 | 384.63 | 458 | 445 | 90.6 |
| B | 12 | 111 | 11132 | 117.94 | 458 | 445 | 90.6 |
| C | 15 | 214 | 167241 | 1553.56 | 458 | 463 | 107.4 |
| C | 9 | 187 | 44560 | 410.77 | 458 | 463 | 107.4 |
| C | 0 | 10 | 8497 | 74.84 | 458 | 463 | 107.4 |
| D | 12 | 235 | 9434674 | 196584.64 | 190 | 184 | 48.0 |
| D | 12 | 227 | 84418 | 1755.17 | 190 | 184 | 48.0 |
| D | 13 | 249 | 46260 | 960.08 | 190 | 184 | 48.0 |
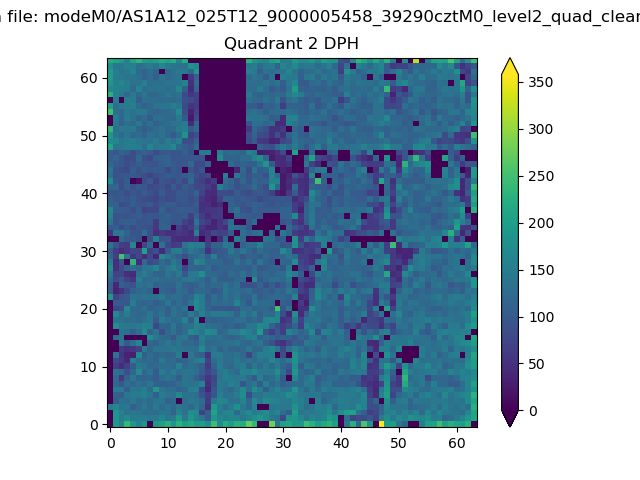
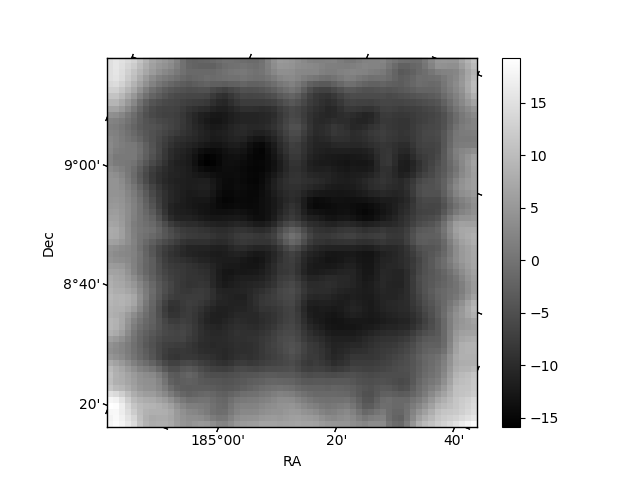
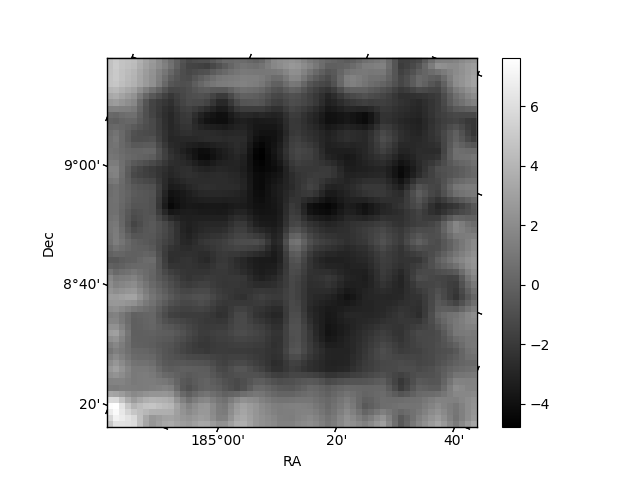
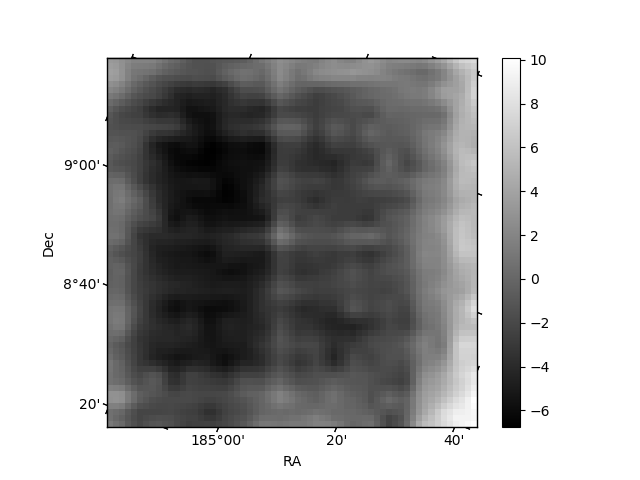
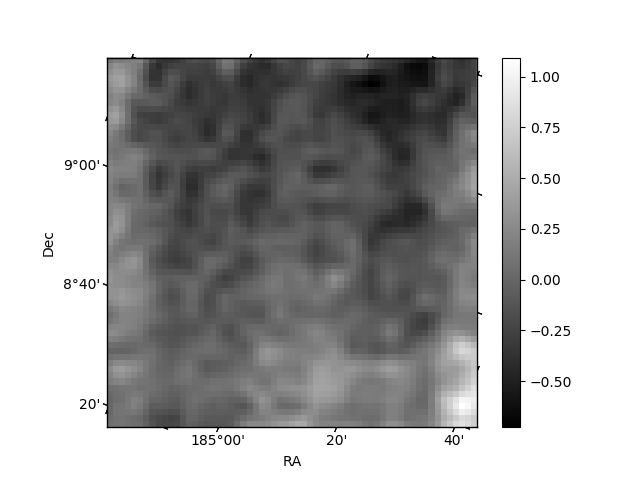
Histogram calculated using DETX and DETY for each event in the final _common_clean file
| Quadrant A | 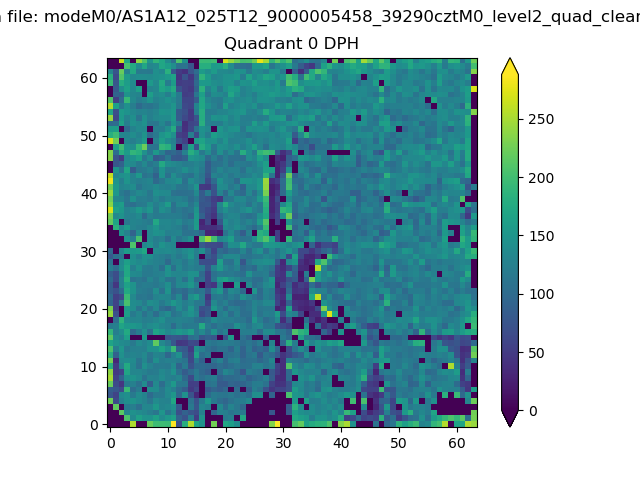 |
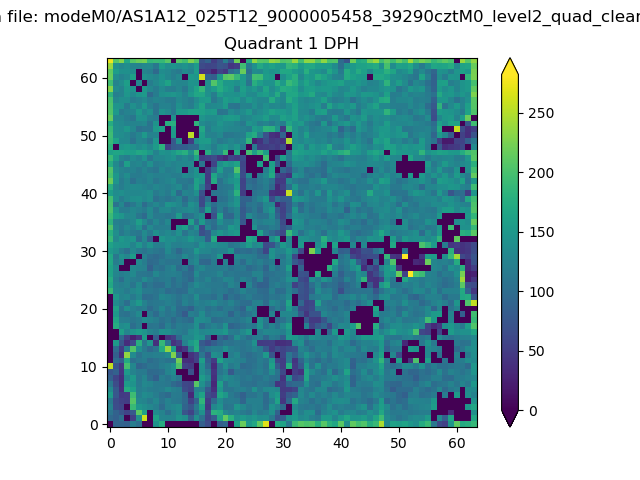 |
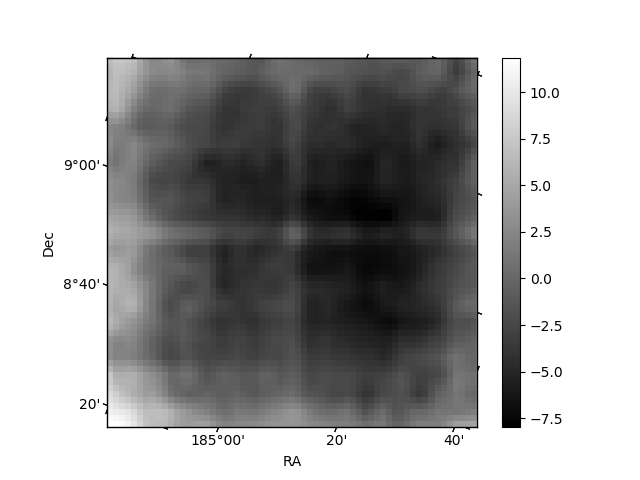
Quadrant B |
|---|---|---|---|
| Quadrant D | 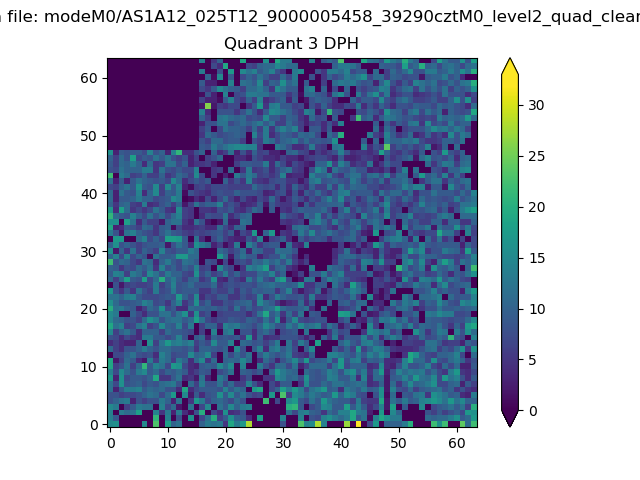 |
 |
Quadrant C |
| Plot type | Count rate plots | Images |
|---|---|---|
| Comparison with Poisson distribution Blue bars denote a histogram of data divided into 1 sec bins. Red curve is a Poisson curve with rate = median count rate of data. |
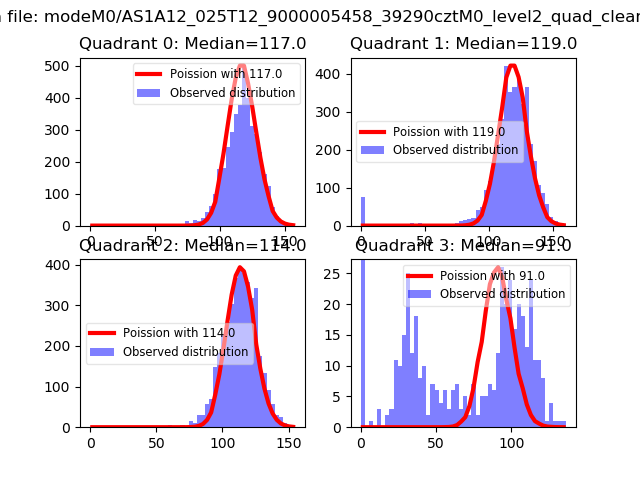 |
 |
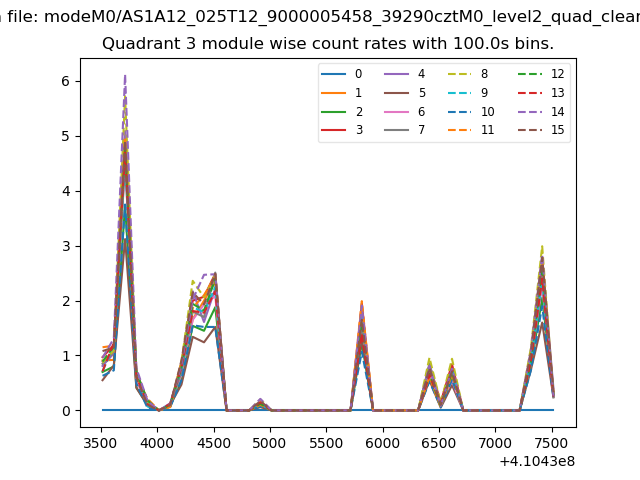
| Quadrant-wise count rates Data is divided into 100 sec bins |
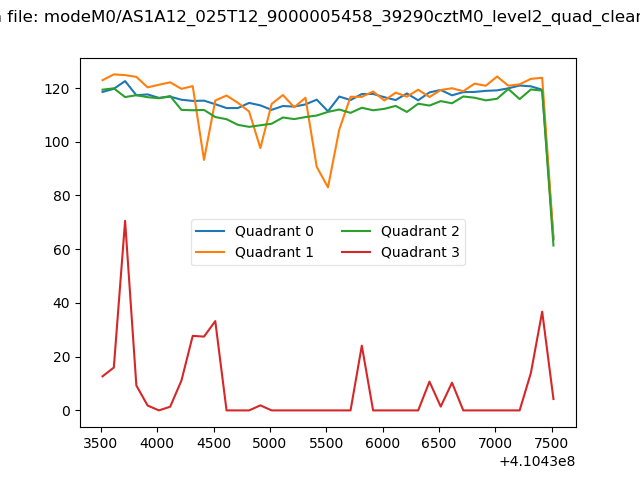 |
|
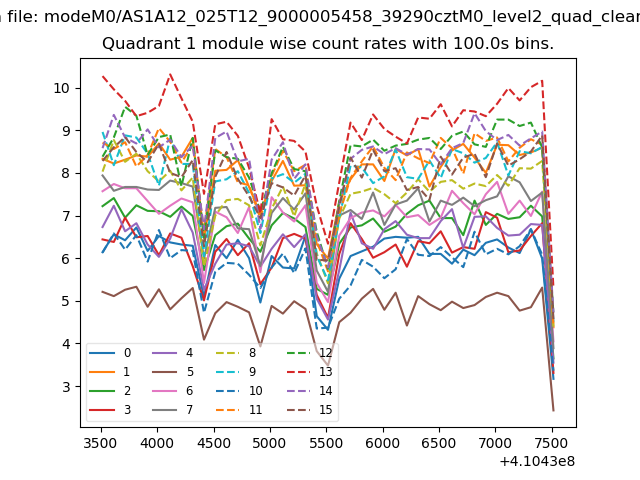
| Module-wise count rates for Quadrant A Data is divided into 100 sec bins |
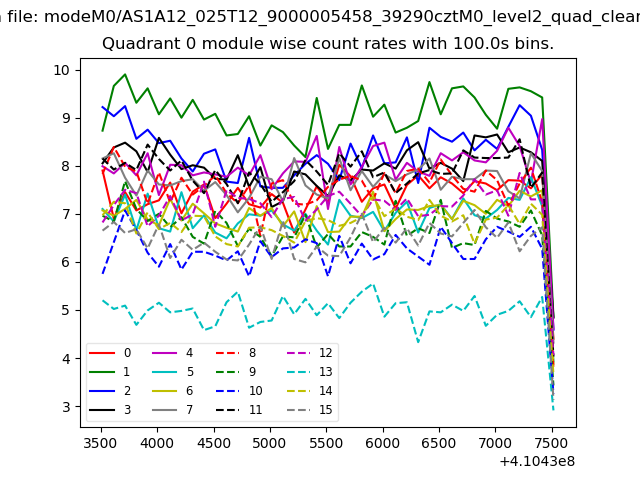 |
 |
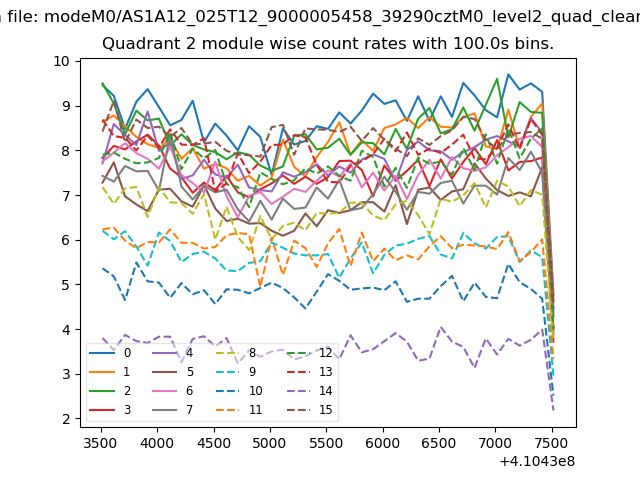
| Module-wise count rates for Quadrant B Data is divided into 100 sec bins |
 |
 |
| Module-wise count rates for Quadrant C Data is divided into 100 sec bins |
 |
 |
| Module-wise count rates for Quadrant D Data is divided into 100 sec bins |
 |
 |
| Parameter | Plot |
|---|---|
| CZT HV Monitor | 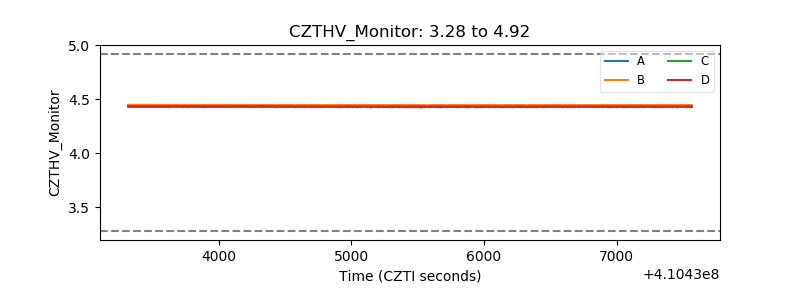 |
| D_VDD | 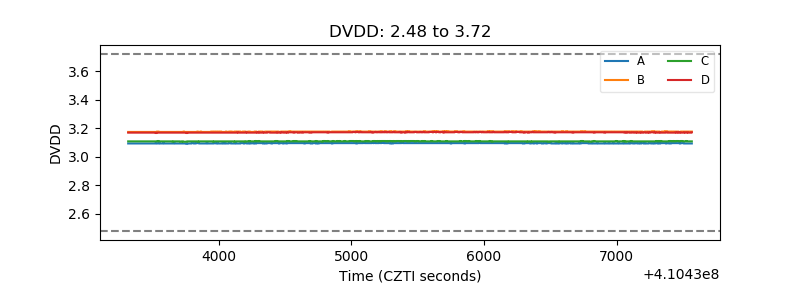 |
| Temperature 1 | 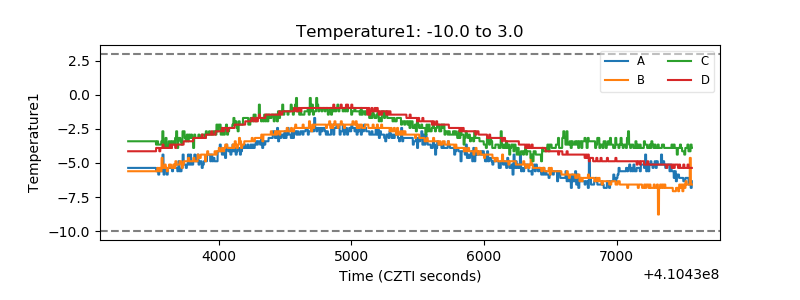 |
| Veto HV Monitor | 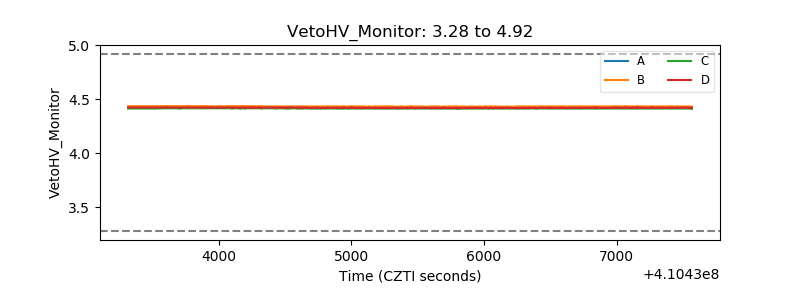 |
| Veto LLD | 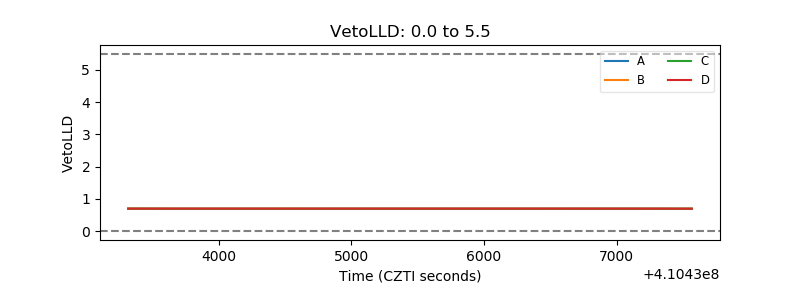 |
| Alpha Counter | 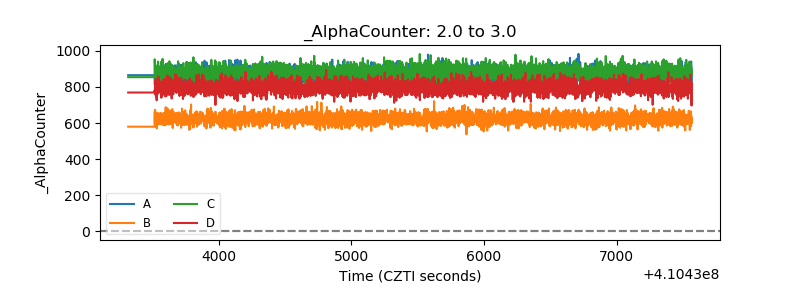 |
| _CPM_Rate | 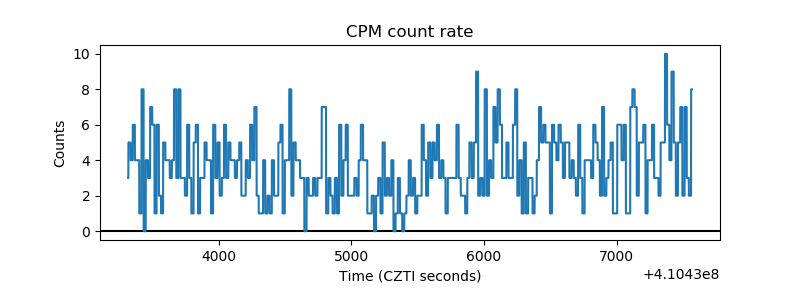 |
| CZT Counter | 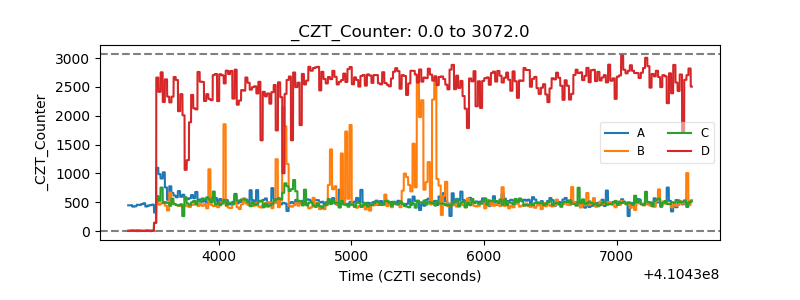 |
| +2.5 Volts monitor |  |
| +5 Volts monitor | 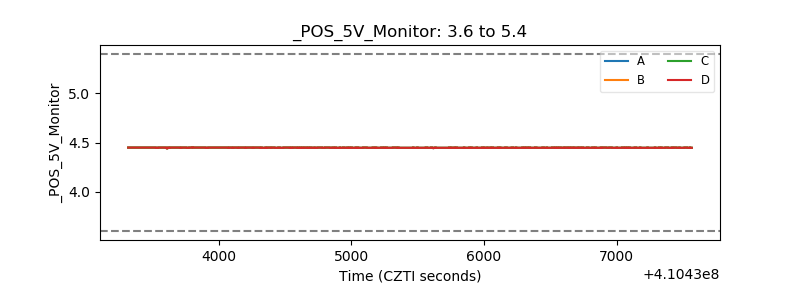 |
| _ROLL_ROT | 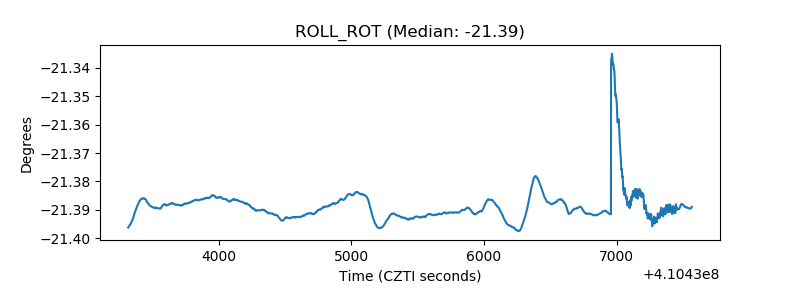 |
| _Roll_DEC | 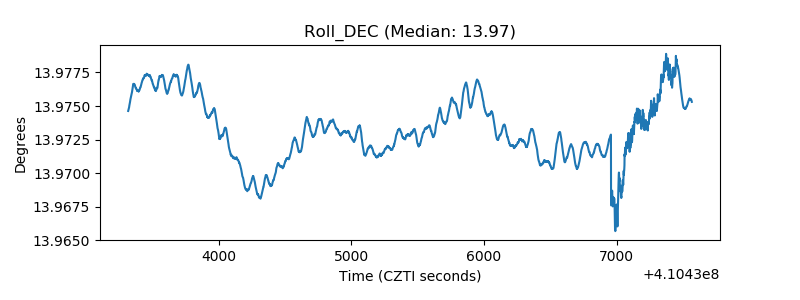 |
| _Roll_RA | 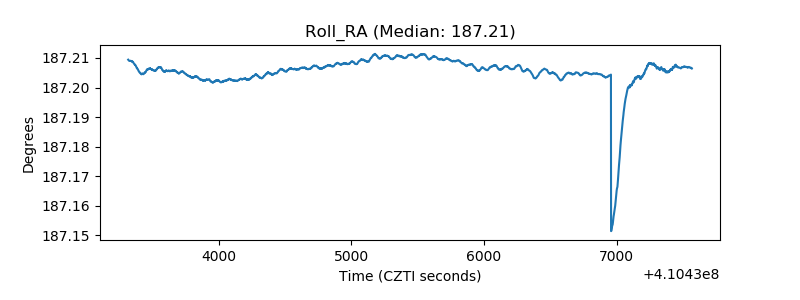 |
| Veto Counter | 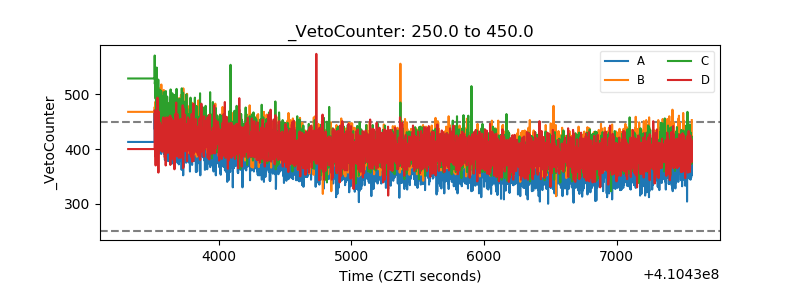 |