| Param | Original file | Final file |
|---|---|---|
| Filename | modeM0/AS1A12_037T03_9000005460_39290cztM0_level2.fits | modeM0/AS1A12_037T03_9000005460_39290cztM0_level2_quad_clean.evt |
| Size (bytes) | 79,387,200 | 10,673,280 |
| Size | 75.7 MB | 10.2 MB |
| Events in quadrant A | 464,399 | 82,131 |
| Events in quadrant B | 333,370 | 86,365 |
| Events in quadrant C | 363,219 | 80,328 |
| Events in quadrant D | 1,717,470 | 16,367 |
| Mode M0 | |||
|---|---|---|---|
| Quadrant | BADHDUFLAG | Total packets | Discarded packets |
| A | 0 | 1853 | 2 |
| B | 0 | 1473 | 1 |
| C | 0 | 1470 | 1 |
| D | 0 | 5599 | 1 |
| Mode SS | |||
|---|---|---|---|
| Quadrant | BADHDUFLAG | Total packets | Discarded packets |
| A | 0 | 16 | 0 |
| B | 0 | 16 | 0 |
| C | 0 | 16 | 0 |
| D | 0 | 16 | 0 |
| Mode M9 | |||
|---|---|---|---|
| Quadrant | BADHDUFLAG | Total packets | Discarded packets |
| A | 0 | 19 | 0 |
| B | 0 | 19 | 0 |
| C | 0 | 19 | 0 |
| D | 0 | 19 | 0 |
| Quadrant | Total seconds | Saturated seconds | Saturation percentage |
|---|---|---|---|
| A | 729 | 4 | 0.548697% |
| B | 729 | 3 | 0.411523% |
| C | 729 | 1 | 0.137174% |
| D | 729 | 598 | 82.030178% |
Noise dominated data is calculated using 1-second bins in cleaned event files. If a bin has >2000 counts, and if more than 50% of those come from <1% of pixels, then it is considered to be noise-dominated and hence unusable.
| Quadrant | # 1 sec bins | Bins with >0 counts | Bins with >2000 counts | High rate bins dominated by noise | Noise dominated (total time) | Noise dominated (detector-on time) | Marked lightcurve |
|---|---|---|---|---|---|---|---|
| A | 729 | 729 | 3 | 3 | 0.41% | 0.41% | 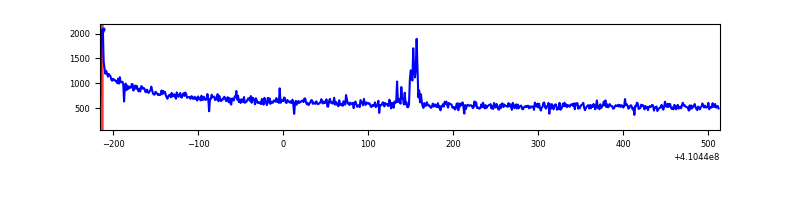 |
| B | 729 | 729 | 0 | 0 | 0.00% | 0.00% | 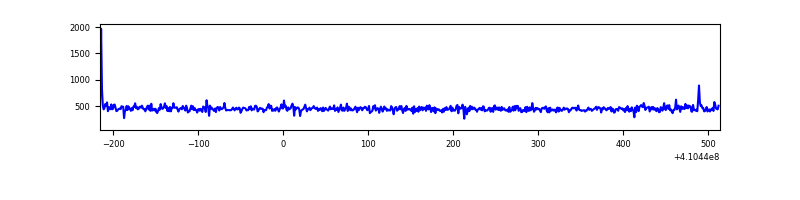 |
| C | 729 | 729 | 0 | 0 | 0.00% | 0.00% | 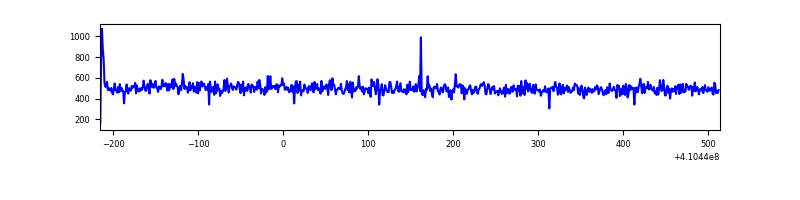 |
| D | 728 | 728 | 491 | 491 | 67.45% | 67.45% | 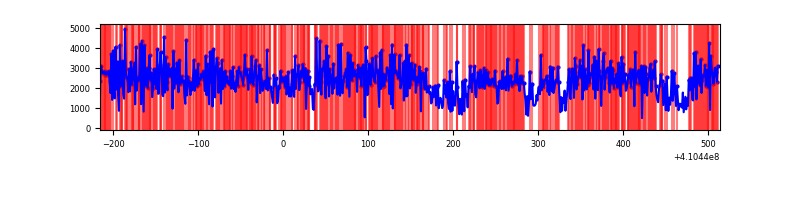 |
Top three noisy pixels from each quadrant. If the there are fewer than three noisy pixels in the level2.evt file, extra rows are filled as -1
| Pixel properties | Quadrant properties | ||||||
|---|---|---|---|---|---|---|---|
| Quadrant | DetID | PixID | Counts | Sigma | Mean | Median | Sigma |
| A | 10 | 83 | 117077 | 6020.49 | 85 | 83 | 19.4 |
| A | 13 | 248 | 10378 | 529.78 | 85 | 83 | 19.4 |
| A | 15 | 222 | 3245 | 162.72 | 85 | 83 | 19.4 |
| B | 5 | 172 | 4293 | 228.99 | 83 | 81 | 18.4 |
| B | 12 | 111 | 2144 | 112.16 | 83 | 81 | 18.4 |
| B | 11 | 111 | 2019 | 105.36 | 83 | 81 | 18.4 |
| C | 15 | 214 | 35713 | 1687.83 | 82 | 82 | 21.1 |
| C | 15 | 159 | 3017 | 139.03 | 82 | 82 | 21.1 |
| C | 0 | 10 | 1595 | 71.67 | 82 | 82 | 21.1 |
| D | 12 | 235 | 1488662 | 102864.4 | 50 | 48 | 14.5 |
| D | 12 | 227 | 18443 | 1271.11 | 50 | 48 | 14.5 |
| D | 13 | 249 | 5035 | 344.61 | 50 | 48 | 14.5 |
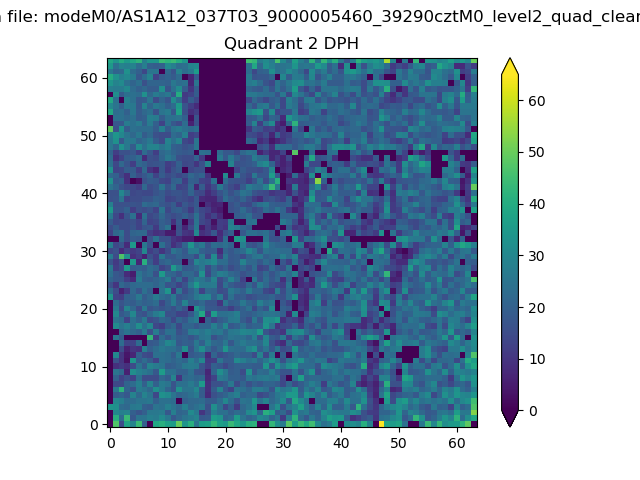
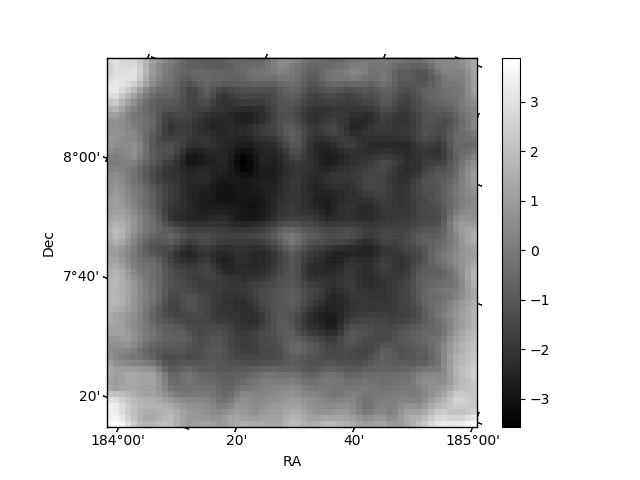
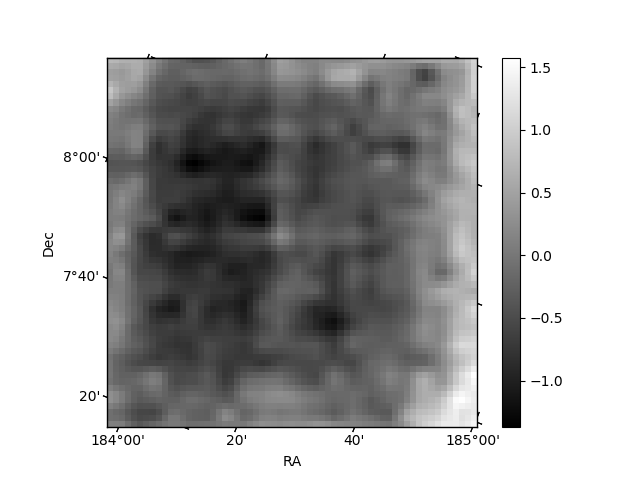
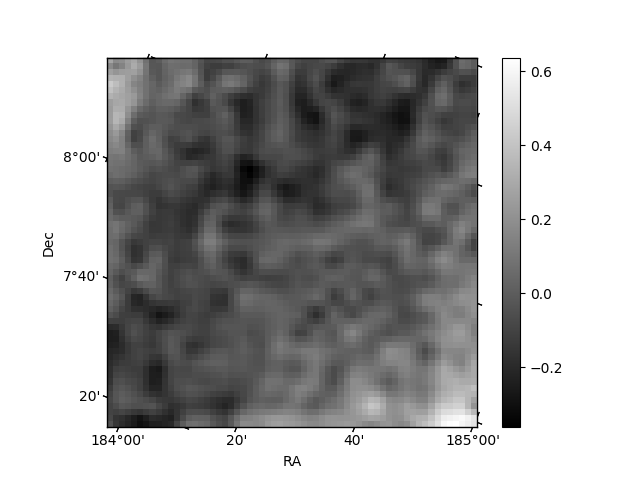
Histogram calculated using DETX and DETY for each event in the final _common_clean file
| Quadrant A | 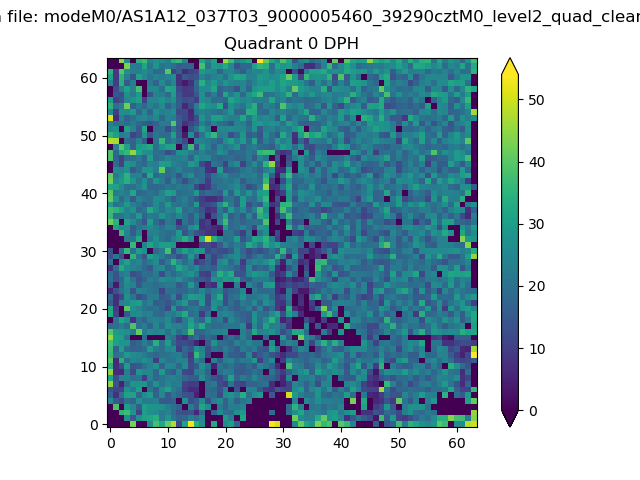 |
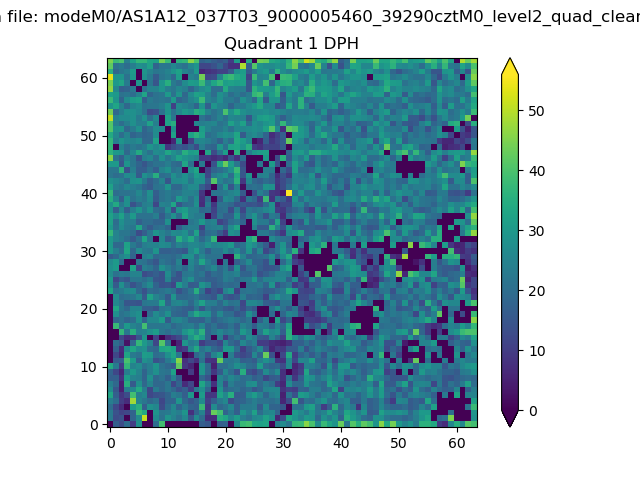 |
Quadrant B |
|---|---|---|---|
| Quadrant D | 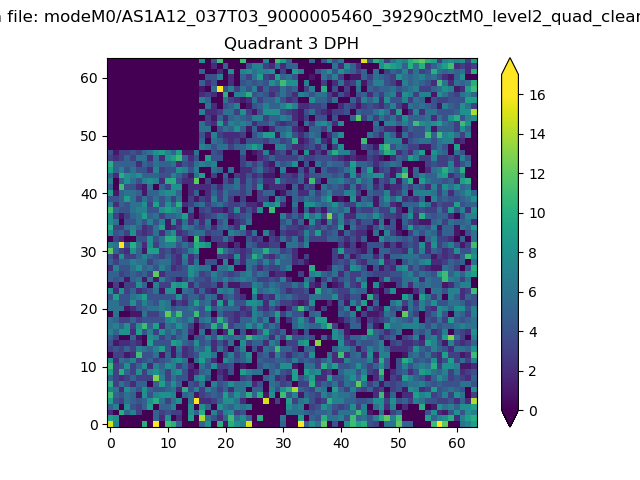 |
 |
Quadrant C |
| Plot type | Count rate plots | Images |
|---|---|---|
| Comparison with Poisson distribution Blue bars denote a histogram of data divided into 1 sec bins. Red curve is a Poisson curve with rate = median count rate of data. |
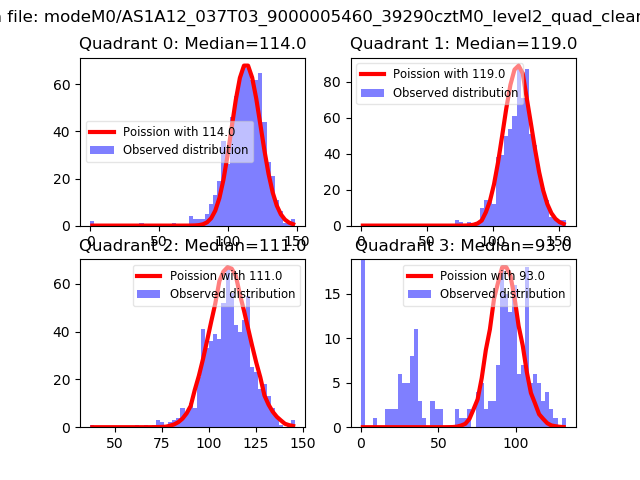 |
 |
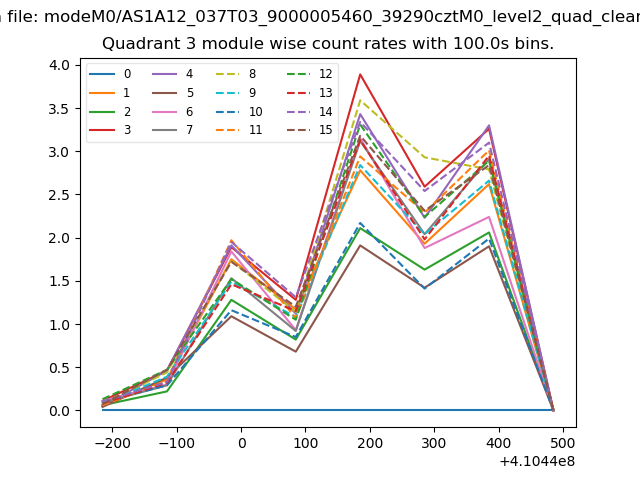
| Quadrant-wise count rates Data is divided into 100 sec bins |
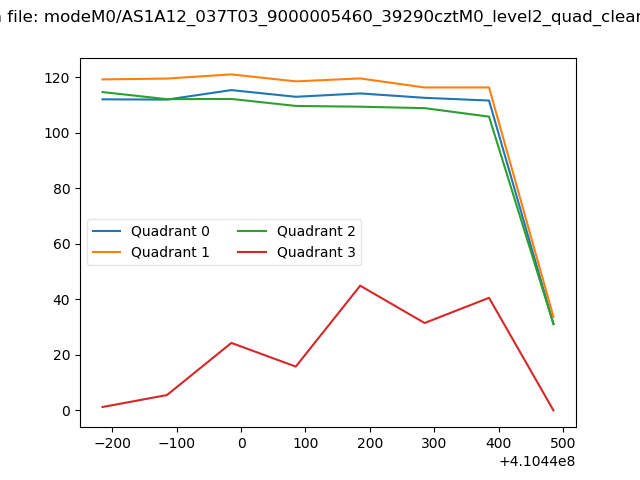 |
|
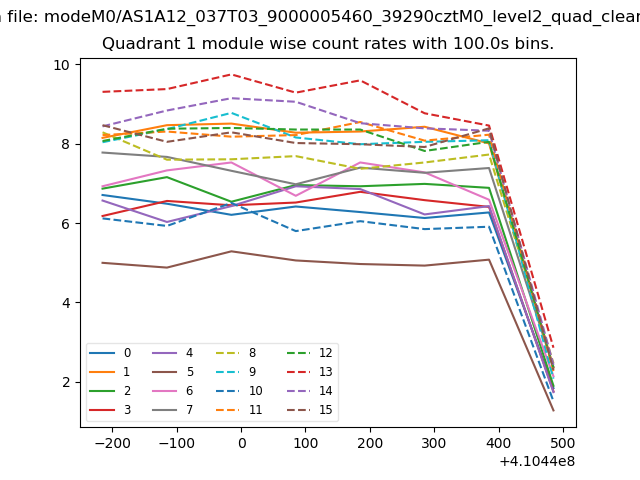
| Module-wise count rates for Quadrant A Data is divided into 100 sec bins |
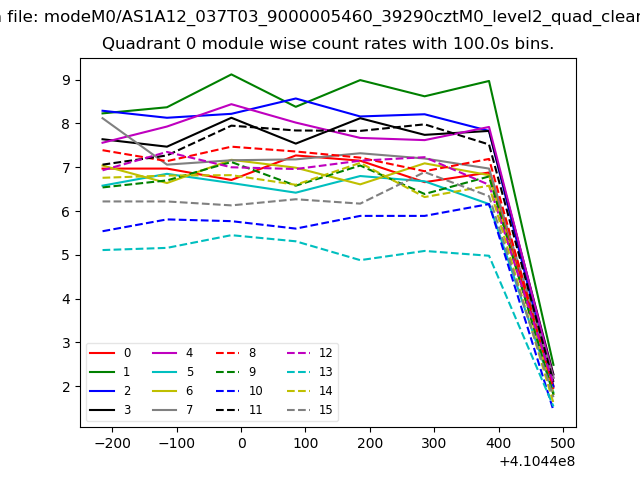 |
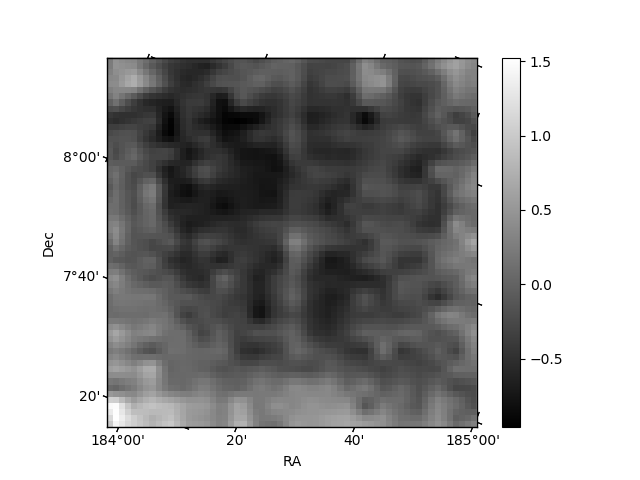 |
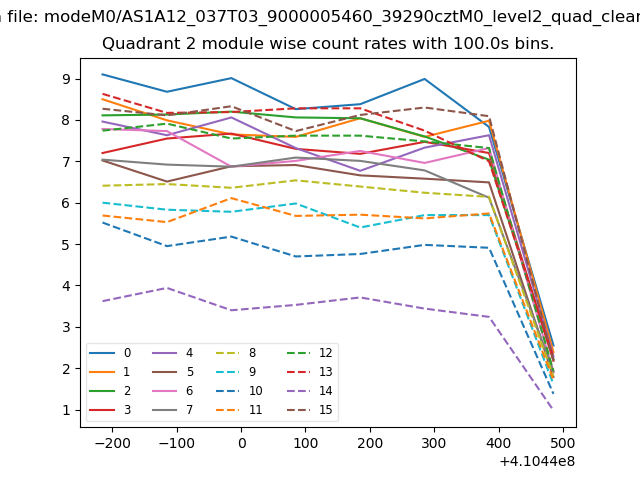
| Module-wise count rates for Quadrant B Data is divided into 100 sec bins |
 |
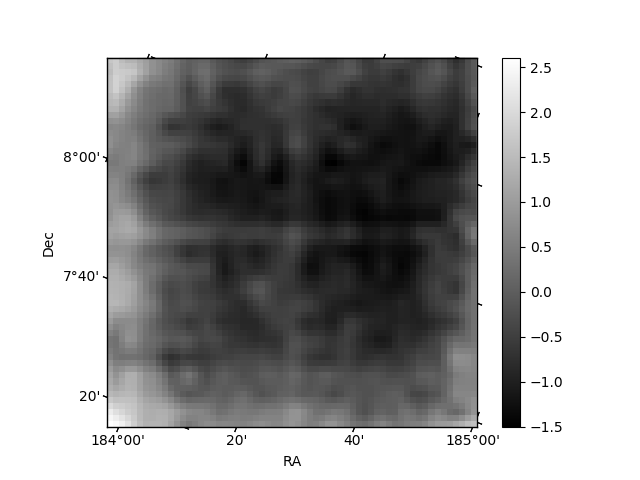 |
| Module-wise count rates for Quadrant C Data is divided into 100 sec bins |
 |
 |
| Module-wise count rates for Quadrant D Data is divided into 100 sec bins |
 |
 |
| Parameter | Plot |
|---|---|
| CZT HV Monitor | 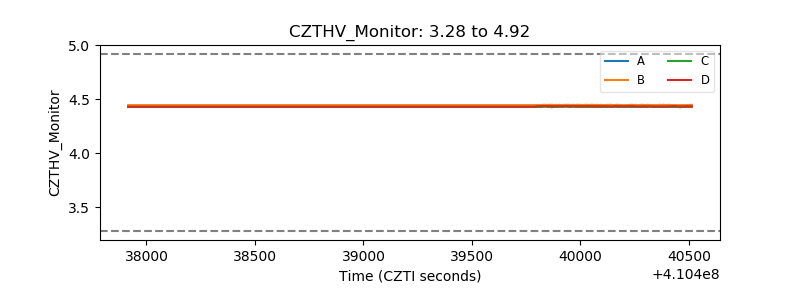 |
| D_VDD | 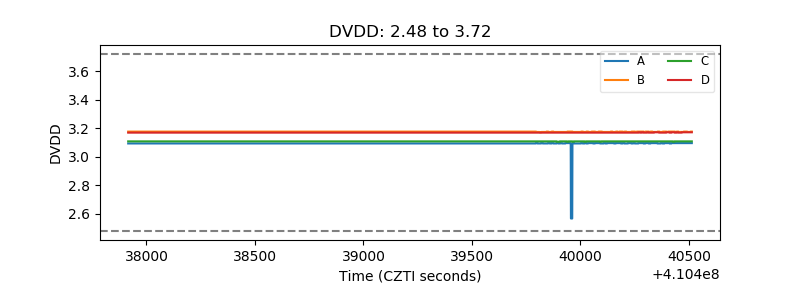 |
| Temperature 1 | 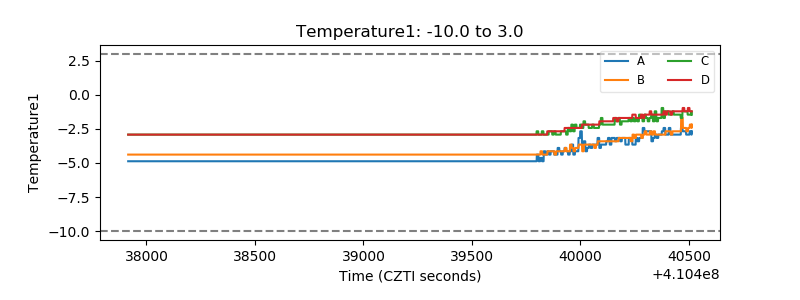 |
| Veto HV Monitor | 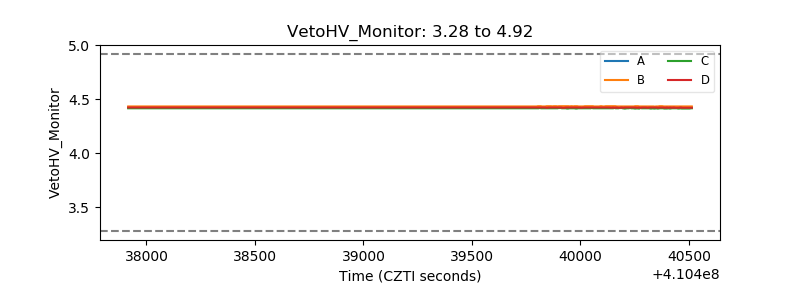 |
| Veto LLD | 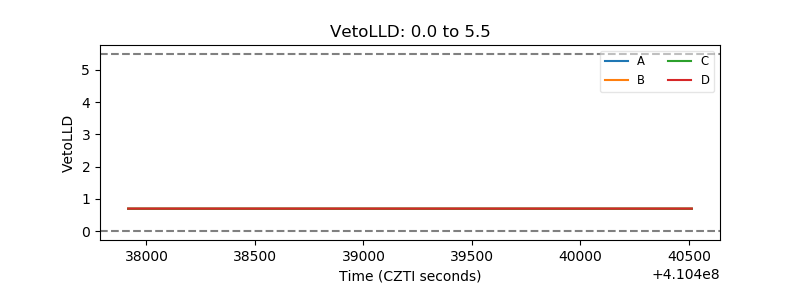 |
| Alpha Counter | 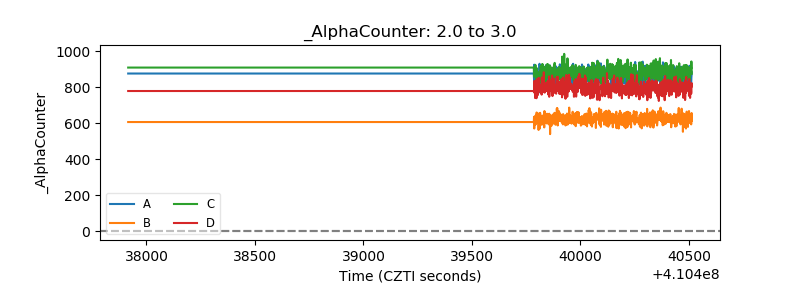 |
| _CPM_Rate | 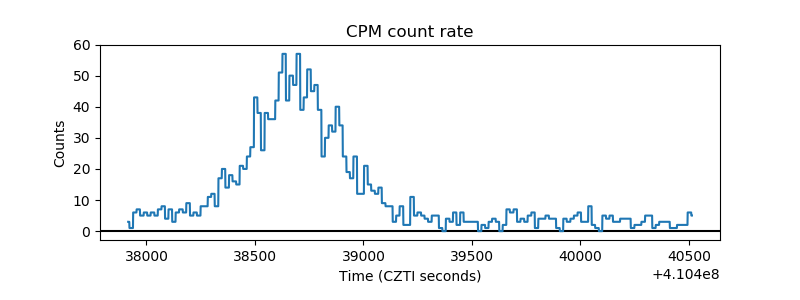 |
| CZT Counter | 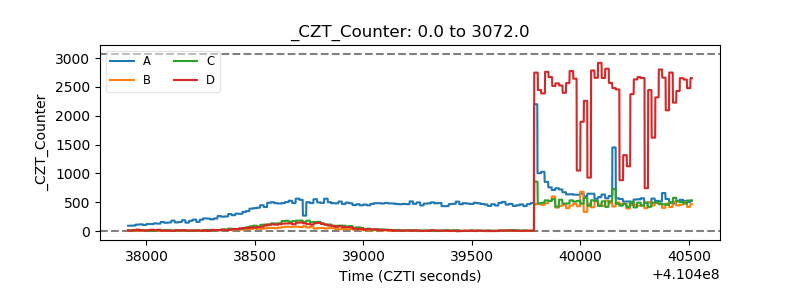 |
| +2.5 Volts monitor | 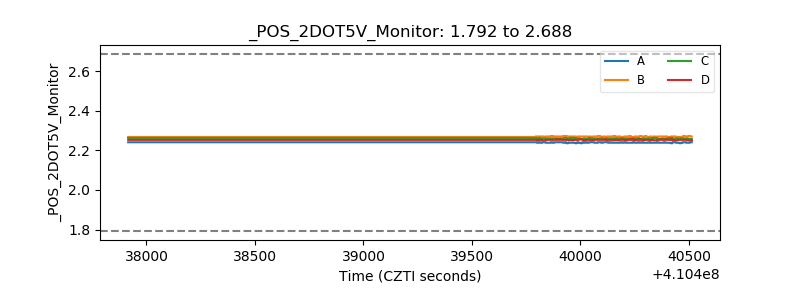 |
| +5 Volts monitor | 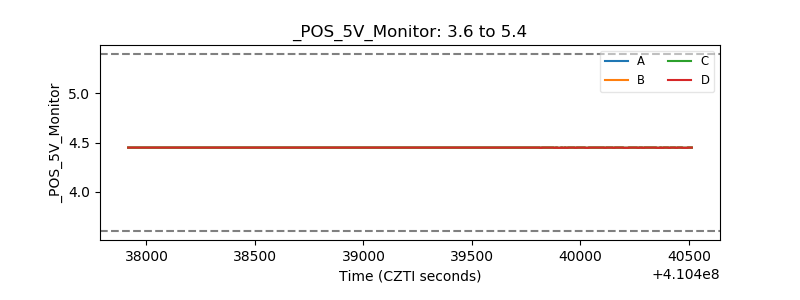 |
| _ROLL_ROT | 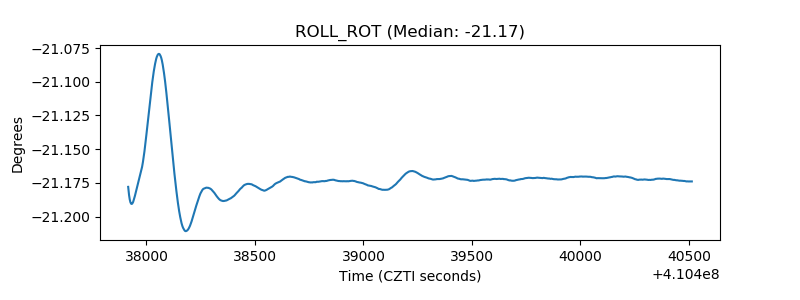 |
| _Roll_DEC | 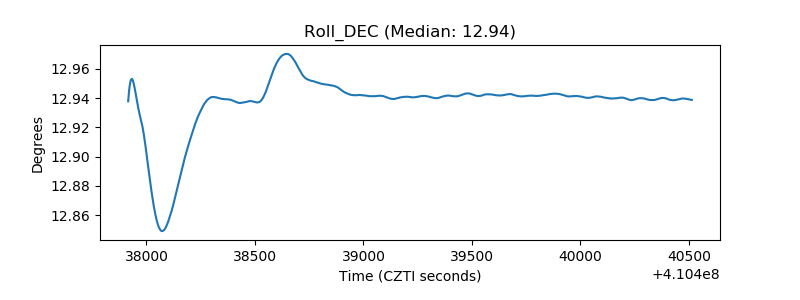 |
| _Roll_RA | 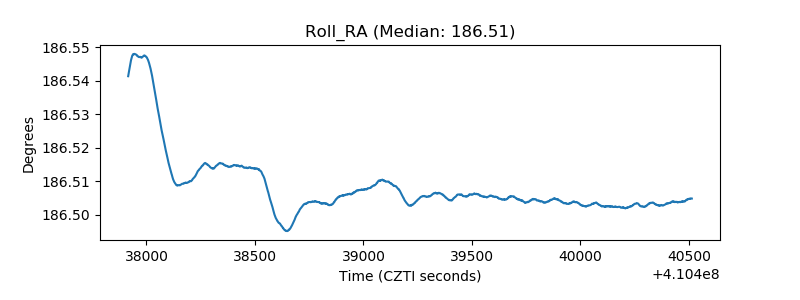 |
| Veto Counter | 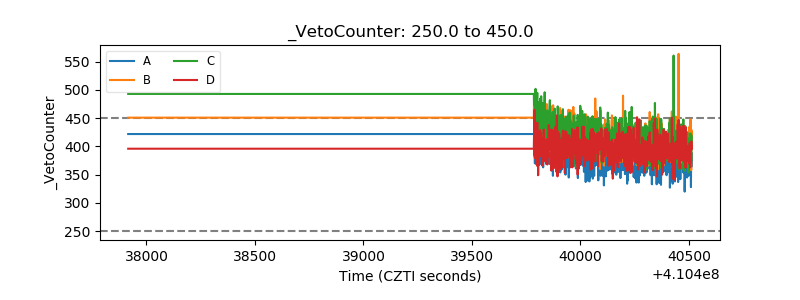 |