| Param | Original file | Final file |
|---|---|---|
| Filename | modeM0/AS1A12_037T03_9000005460_39291cztM0_level2.fits | modeM0/AS1A12_037T03_9000005460_39291cztM0_level2_quad_clean.evt |
| Size (bytes) | 600,096,960 | 75,571,200 |
| Size | 572.3 MB | 72.1 MB |
| Events in quadrant A | 2,986,801 | 614,531 |
| Events in quadrant B | 2,600,349 | 628,322 |
| Events in quadrant C | 2,669,706 | 596,568 |
| Events in quadrant D | 13,534,373 | 68,934 |
| Mode M0 | |||
|---|---|---|---|
| Quadrant | BADHDUFLAG | Total packets | Discarded packets |
| A | 0 | 12055 | 3 |
| B | 0 | 11326 | 2 |
| C | 0 | 11112 | 2 |
| D | 0 | 43970 | 2 |
| Mode SS | |||
|---|---|---|---|
| Quadrant | BADHDUFLAG | Total packets | Discarded packets |
| A | 0 | 112 | 0 |
| B | 0 | 112 | 0 |
| C | 0 | 112 | 0 |
| D | 0 | 112 | 0 |
| Mode M9 | |||
|---|---|---|---|
| Quadrant | BADHDUFLAG | Total packets | Discarded packets |
| A | 0 | 27 | 0 |
| B | 0 | 27 | 0 |
| C | 0 | 27 | 0 |
| D | 0 | 28 | 0 |
| Quadrant | Total seconds | Saturated seconds | Saturation percentage |
|---|---|---|---|
| A | 5420 | 19 | 0.350554% |
| B | 5420 | 32 | 0.590406% |
| C | 5420 | 4 | 0.073801% |
| D | 5420 | 4895 | 90.313653% |
Noise dominated data is calculated using 1-second bins in cleaned event files. If a bin has >2000 counts, and if more than 50% of those come from <1% of pixels, then it is considered to be noise-dominated and hence unusable.
| Quadrant | # 1 sec bins | Bins with >0 counts | Bins with >2000 counts | High rate bins dominated by noise | Noise dominated (total time) | Noise dominated (detector-on time) | Marked lightcurve |
|---|---|---|---|---|---|---|---|
| A | 7033 | 5421 | 14 | 14 | 0.20% | 0.26% | 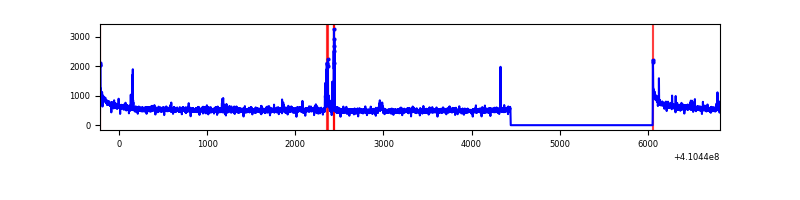 |
| B | 7033 | 5421 | 12 | 12 | 0.17% | 0.22% | 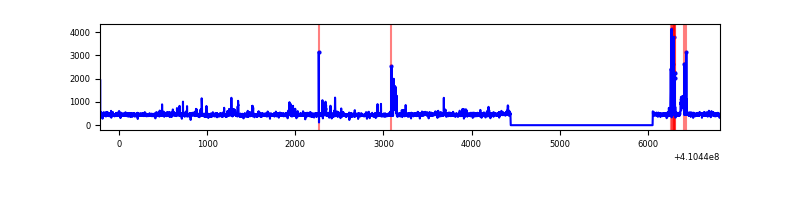 |
| C | 7033 | 5421 | 0 | 0 | 0.00% | 0.00% | 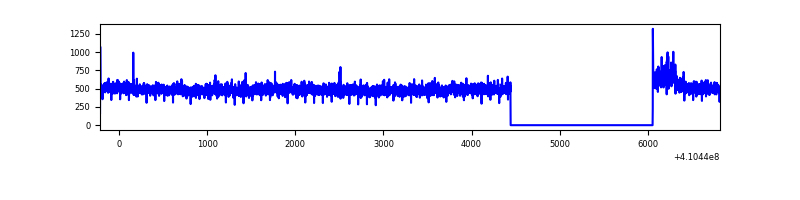 |
| D | 7033 | 5420 | 4171 | 4171 | 59.31% | 76.96% | 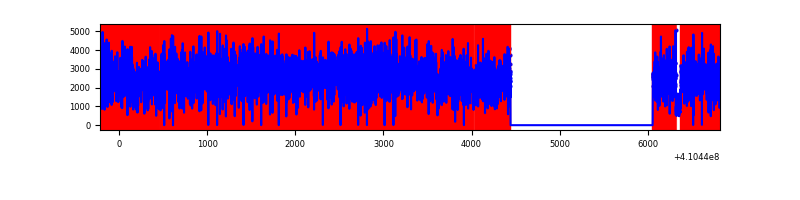 |
Top three noisy pixels from each quadrant. If the there are fewer than three noisy pixels in the level2.evt file, extra rows are filled as -1
| Pixel properties | Quadrant properties | ||||||
|---|---|---|---|---|---|---|---|
| Quadrant | DetID | PixID | Counts | Sigma | Mean | Median | Sigma |
| A | 10 | 83 | 429895 | 3396.17 | 618 | 606 | 126.4 |
| A | 13 | 248 | 98410 | 773.74 | 618 | 606 | 126.4 |
| A | 15 | 222 | 65167 | 510.75 | 618 | 606 | 126.4 |
| B | 5 | 255 | 97543 | 811.88 | 612 | 596 | 119.4 |
| B | 5 | 172 | 79828 | 663.53 | 612 | 596 | 119.4 |
| B | 12 | 111 | 15168 | 122.03 | 612 | 596 | 119.4 |
| C | 15 | 214 | 228356 | 1607.21 | 603 | 607 | 141.7 |
| C | 9 | 187 | 69757 | 487.99 | 603 | 607 | 141.7 |
| C | 3 | 233 | 12985 | 87.35 | 603 | 607 | 141.7 |
| D | 12 | 235 | 11970918 | 162540.8 | 296 | 287 | 73.6 |
| D | 12 | 227 | 240361 | 3259.8 | 296 | 287 | 73.6 |
| D | 13 | 249 | 98013 | 1326.95 | 296 | 287 | 73.6 |
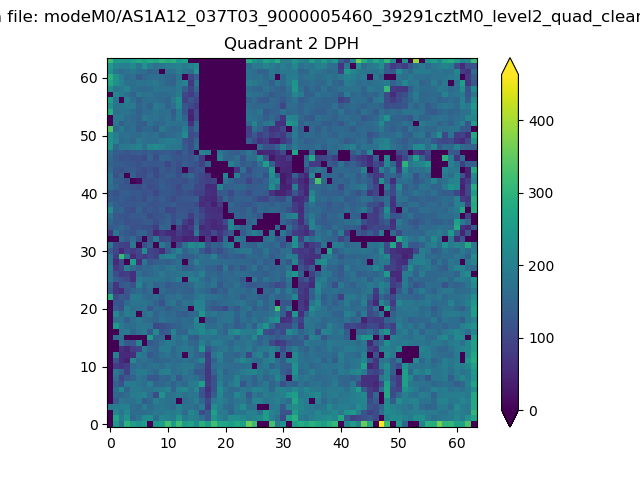
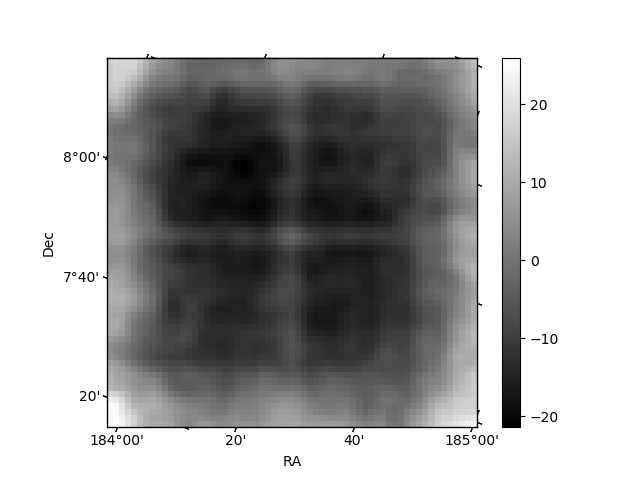
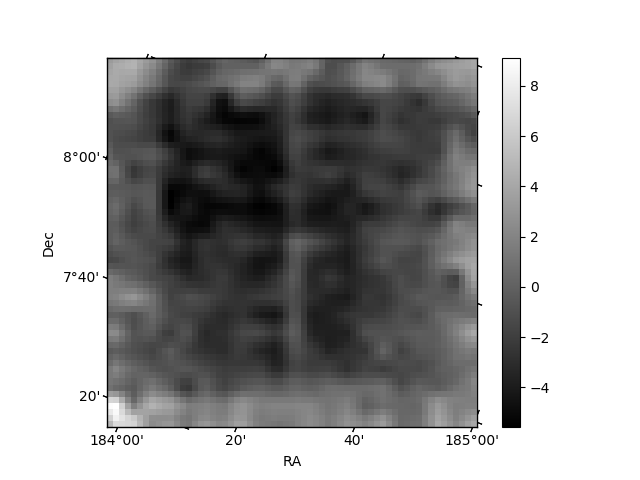
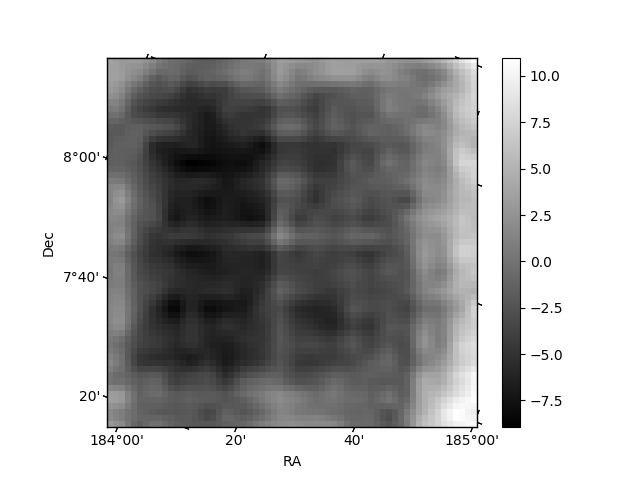
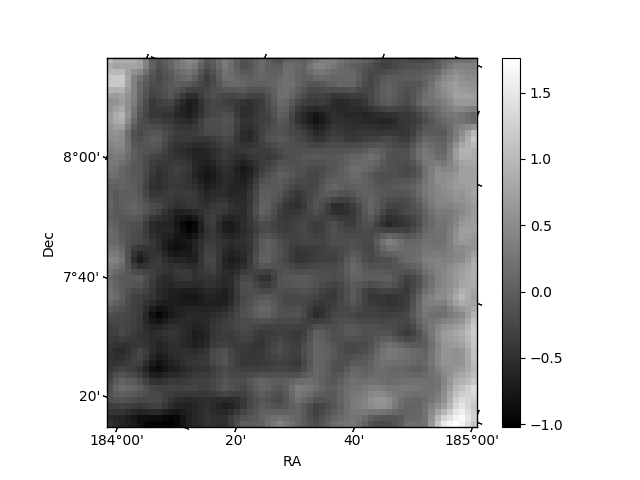
Histogram calculated using DETX and DETY for each event in the final _common_clean file
| Quadrant A | 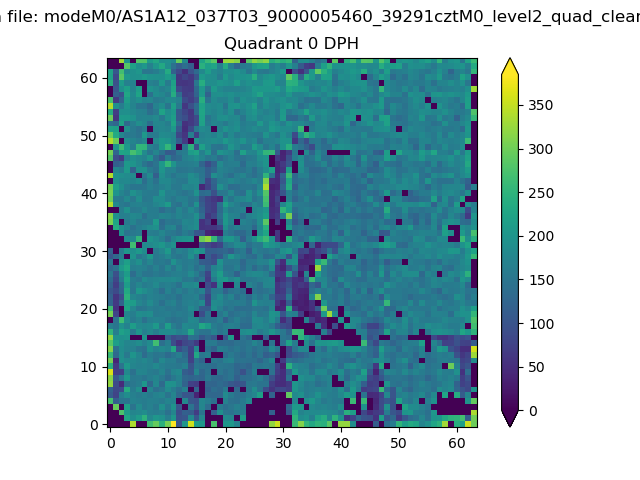 |
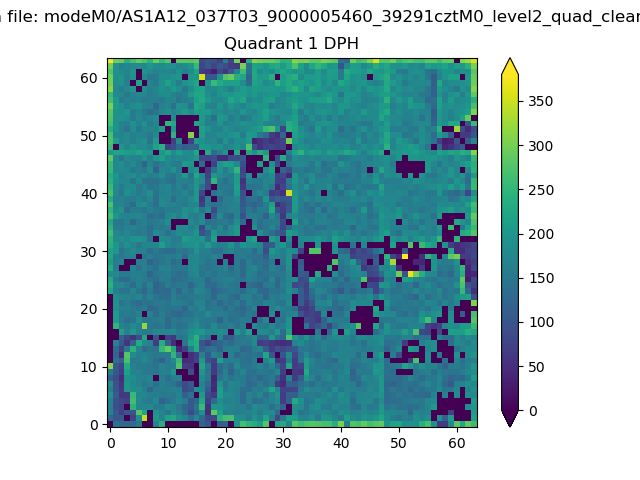 |
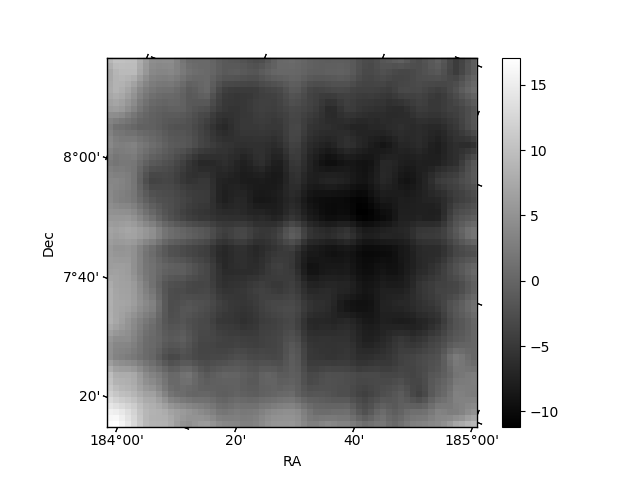
Quadrant B |
|---|---|---|---|
| Quadrant D | 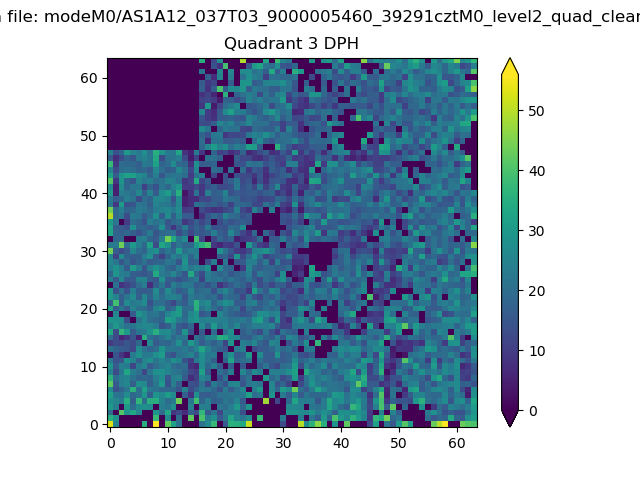 |
 |
Quadrant C |
| Plot type | Count rate plots | Images |
|---|---|---|
| Comparison with Poisson distribution Blue bars denote a histogram of data divided into 1 sec bins. Red curve is a Poisson curve with rate = median count rate of data. |
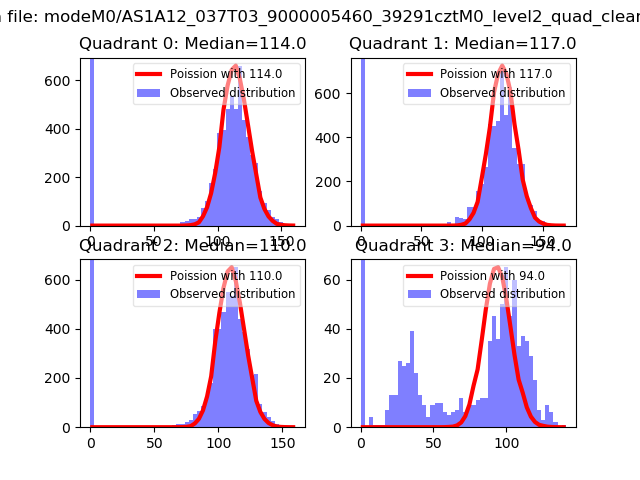 |
 |
| Quadrant-wise count rates Data is divided into 100 sec bins |
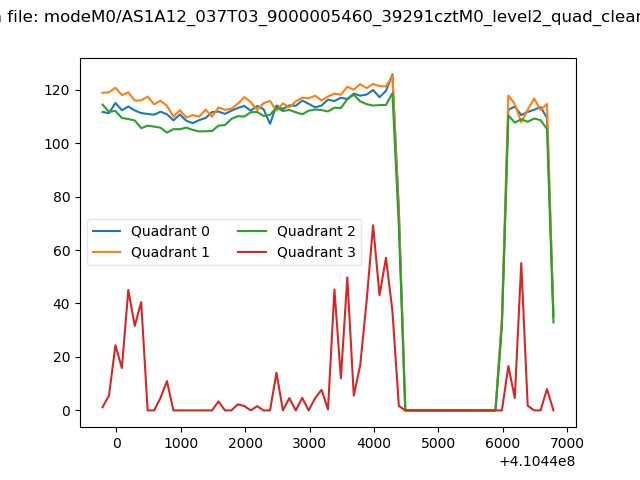 |
|
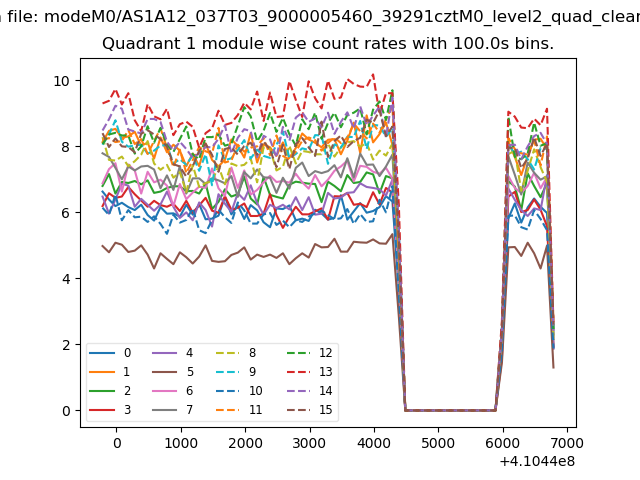
| Module-wise count rates for Quadrant A Data is divided into 100 sec bins |
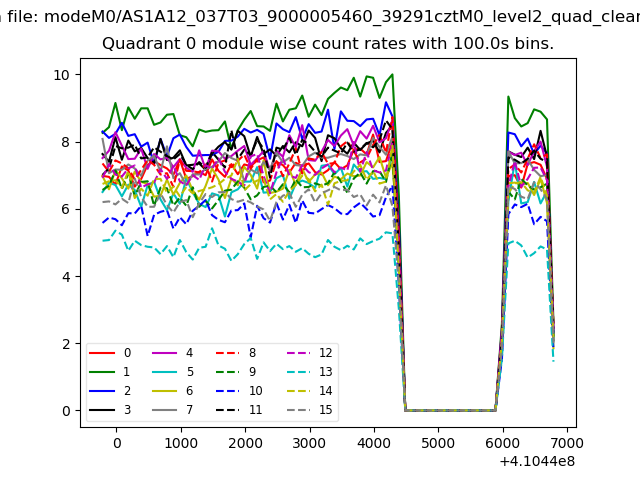 |
 |
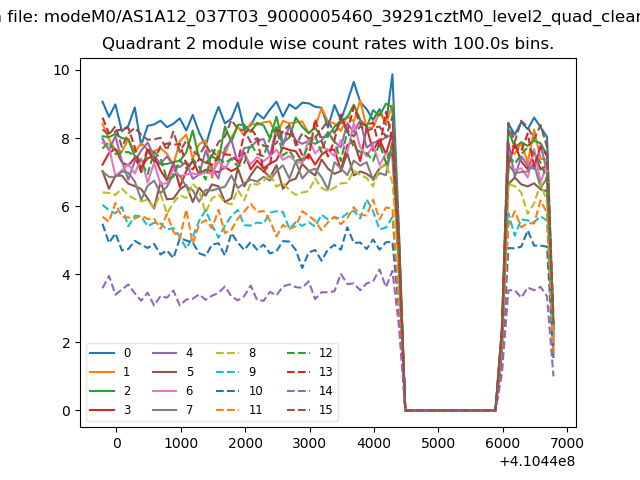
| Module-wise count rates for Quadrant B Data is divided into 100 sec bins |
 |
 |
| Module-wise count rates for Quadrant C Data is divided into 100 sec bins |
 |
 |
| Module-wise count rates for Quadrant D Data is divided into 100 sec bins |
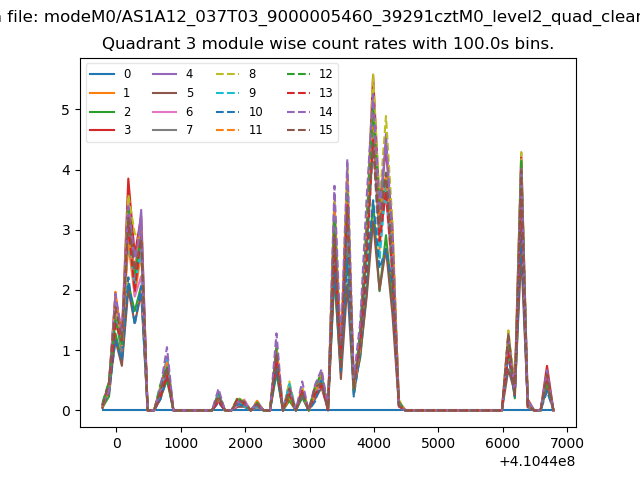 |
 |
| Parameter | Plot |
|---|---|
| CZT HV Monitor |  |
| D_VDD | 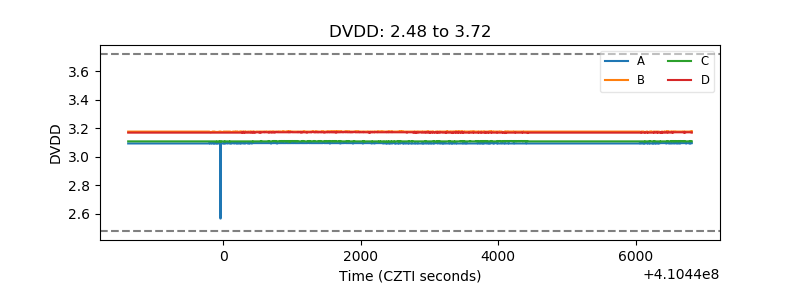 |
| Temperature 1 | 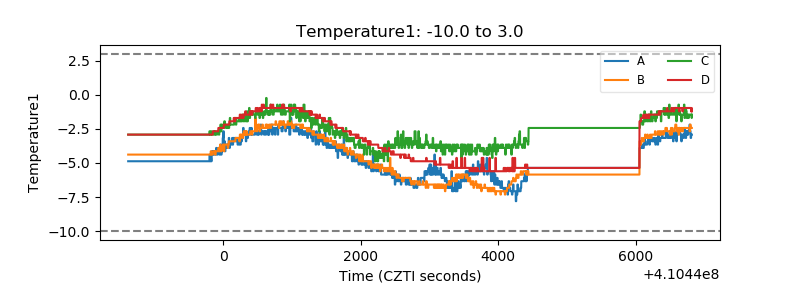 |
| Veto HV Monitor | 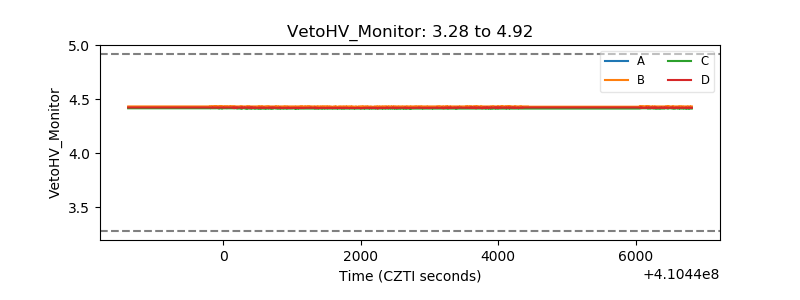 |
| Veto LLD | 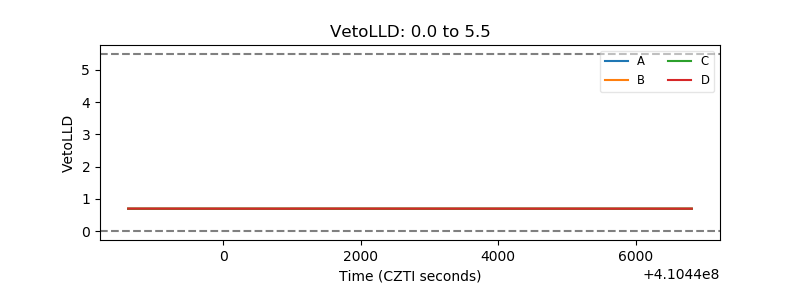 |
| Alpha Counter | 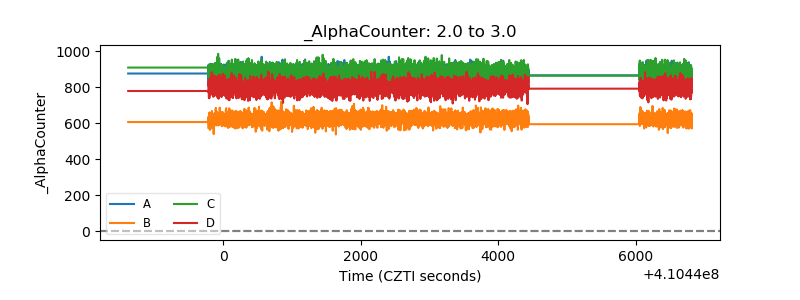 |
| _CPM_Rate | 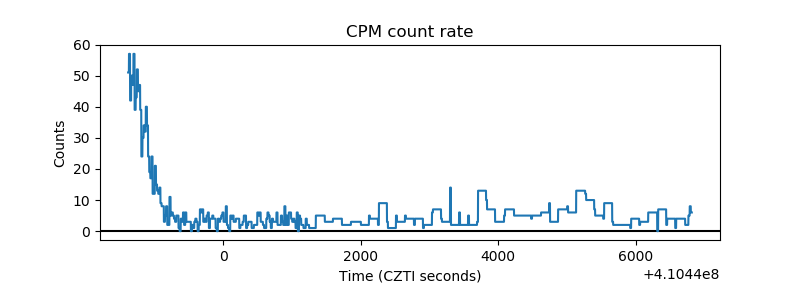 |
| CZT Counter | 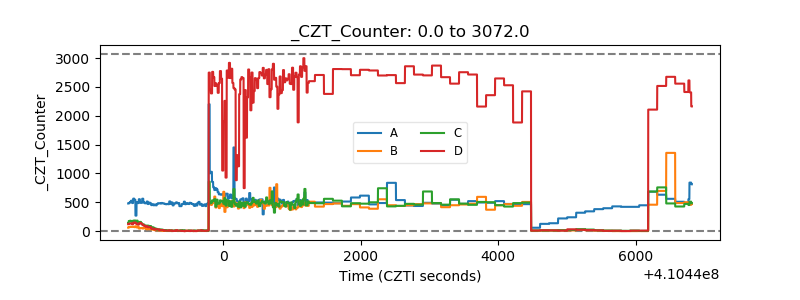 |
| +2.5 Volts monitor | 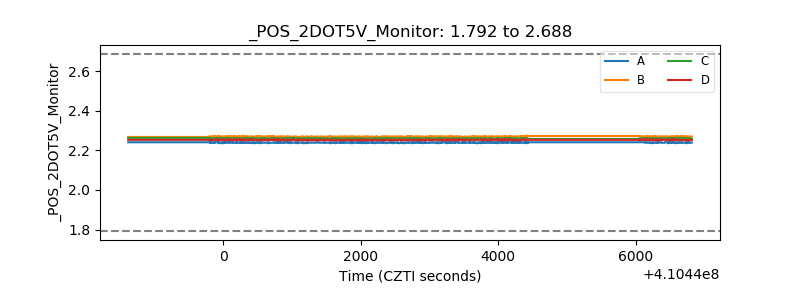 |
| +5 Volts monitor | 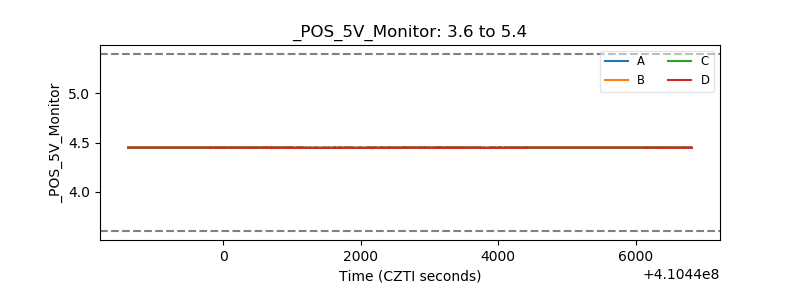 |
| _ROLL_ROT | 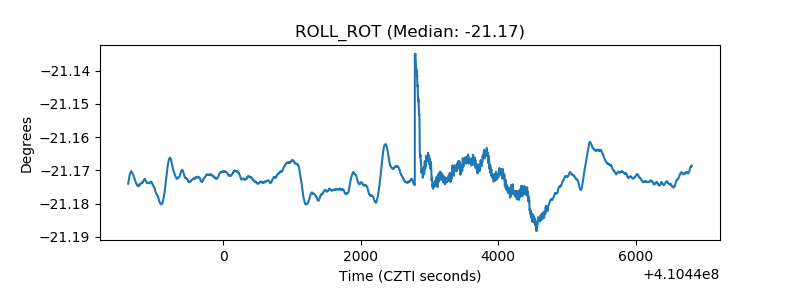 |
| _Roll_DEC | 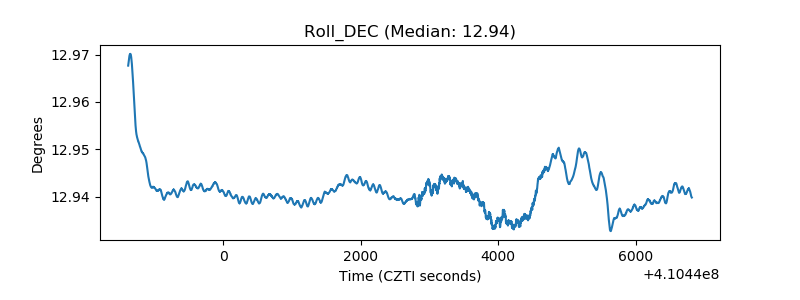 |
| _Roll_RA | 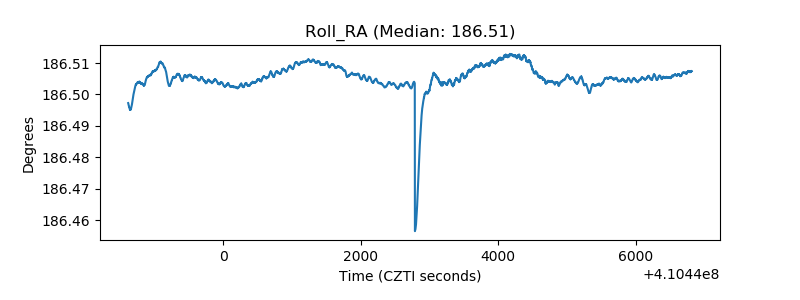 |
| Veto Counter | 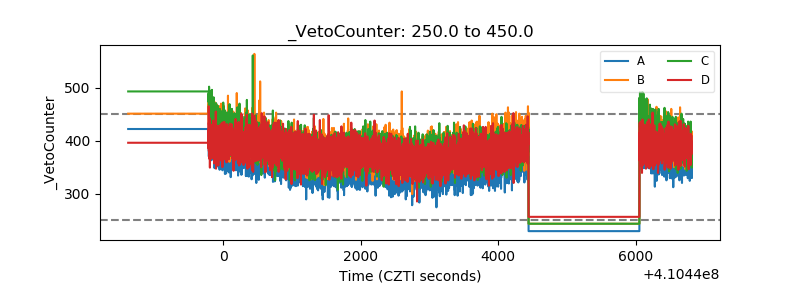 |