| Param | Original file | Final file |
|---|---|---|
| Filename | modeM0/AS1A12_037T03_9000005460_39292cztM0_level2.fits | modeM0/AS1A12_037T03_9000005460_39292cztM0_level2_quad_clean.evt |
| Size (bytes) | 648,642,240 | 80,424,000 |
| Size | 618.6 MB | 76.7 MB |
| Events in quadrant A | 3,400,032 | 651,041 |
| Events in quadrant B | 3,479,678 | 641,591 |
| Events in quadrant C | 2,850,548 | 631,050 |
| Events in quadrant D | 13,830,252 | 106,881 |
| Mode M0 | |||
|---|---|---|---|
| Quadrant | BADHDUFLAG | Total packets | Discarded packets |
| A | 0 | 13605 | 3 |
| B | 0 | 14177 | 2 |
| C | 0 | 11930 | 2 |
| D | 0 | 45062 | 2 |
| Mode SS | |||
|---|---|---|---|
| Quadrant | BADHDUFLAG | Total packets | Discarded packets |
| A | 0 | 118 | 0 |
| B | 0 | 118 | 0 |
| C | 0 | 118 | 0 |
| D | 0 | 118 | 0 |
| Mode M9 | |||
|---|---|---|---|
| Quadrant | BADHDUFLAG | Total packets | Discarded packets |
| A | 0 | 24 | 0 |
| B | 0 | 24 | 0 |
| C | 0 | 24 | 0 |
| D | 0 | 25 | 0 |
| Quadrant | Total seconds | Saturated seconds | Saturation percentage |
|---|---|---|---|
| A | 5787 | 20 | 0.345602% |
| B | 5787 | 250 | 4.320028% |
| C | 5787 | 4 | 0.069120% |
| D | 5787 | 4937 | 85.311906% |
Noise dominated data is calculated using 1-second bins in cleaned event files. If a bin has >2000 counts, and if more than 50% of those come from <1% of pixels, then it is considered to be noise-dominated and hence unusable.
| Quadrant | # 1 sec bins | Bins with >0 counts | Bins with >2000 counts | High rate bins dominated by noise | Noise dominated (total time) | Noise dominated (detector-on time) | Marked lightcurve |
|---|---|---|---|---|---|---|---|
| A | 7130 | 5788 | 10 | 10 | 0.14% | 0.17% | 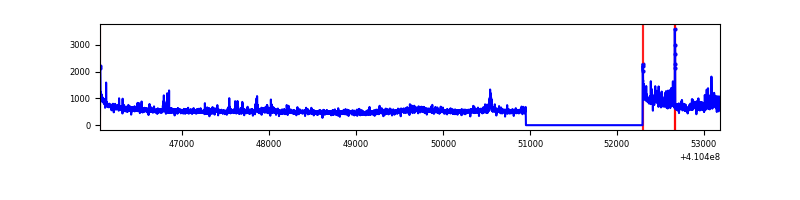 |
| B | 7130 | 5788 | 178 | 178 | 2.50% | 3.08% | 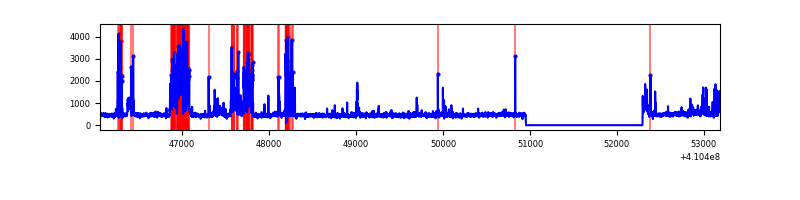 |
| C | 7130 | 5788 | 0 | 0 | 0.00% | 0.00% | 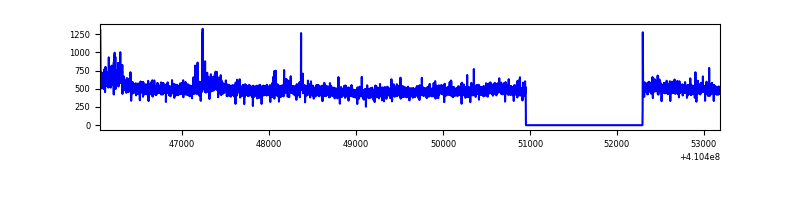 |
| D | 7130 | 5788 | 4229 | 4229 | 59.31% | 73.06% | 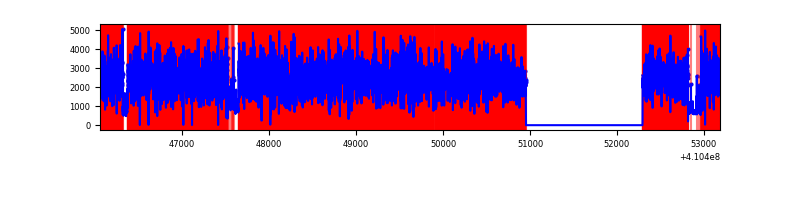 |
Top three noisy pixels from each quadrant. If the there are fewer than three noisy pixels in the level2.evt file, extra rows are filled as -1
| Pixel properties | Quadrant properties | ||||||
|---|---|---|---|---|---|---|---|
| Quadrant | DetID | PixID | Counts | Sigma | Mean | Median | Sigma |
| A | 10 | 83 | 449014 | 3338.29 | 655 | 641 | 134.3 |
| A | 15 | 222 | 340324 | 2529.06 | 655 | 641 | 134.3 |
| A | 13 | 248 | 78230 | 577.68 | 655 | 641 | 134.3 |
| B | 5 | 172 | 750545 | 5995.75 | 639 | 621 | 125.1 |
| B | 5 | 255 | 123200 | 980.04 | 639 | 621 | 125.1 |
| B | 15 | 35 | 60851 | 481.55 | 639 | 621 | 125.1 |
| C | 15 | 214 | 243868 | 1616.8 | 640 | 642 | 150.4 |
| C | 9 | 187 | 103511 | 683.8 | 640 | 642 | 150.4 |
| C | 0 | 10 | 4468 | 25.43 | 640 | 642 | 150.4 |
| D | 12 | 235 | 11818228 | 129440.0 | 366 | 354 | 91.3 |
| D | 12 | 227 | 319806 | 3498.93 | 366 | 354 | 91.3 |
| D | 2 | 249 | 126909 | 1386.14 | 366 | 354 | 91.3 |
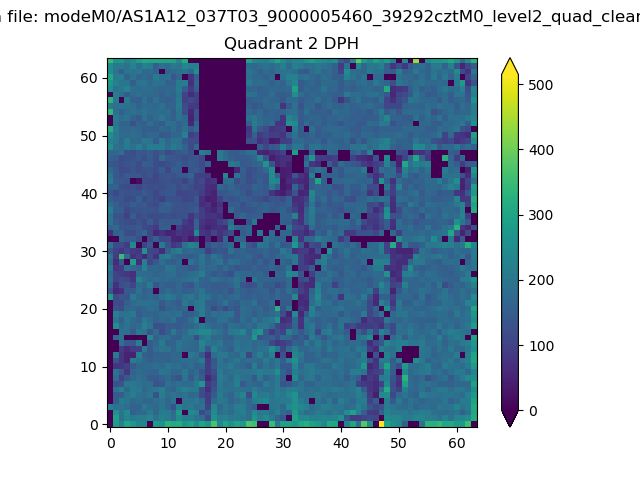
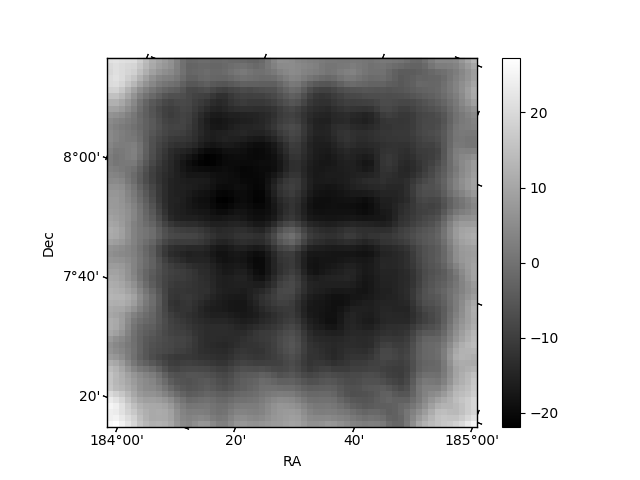
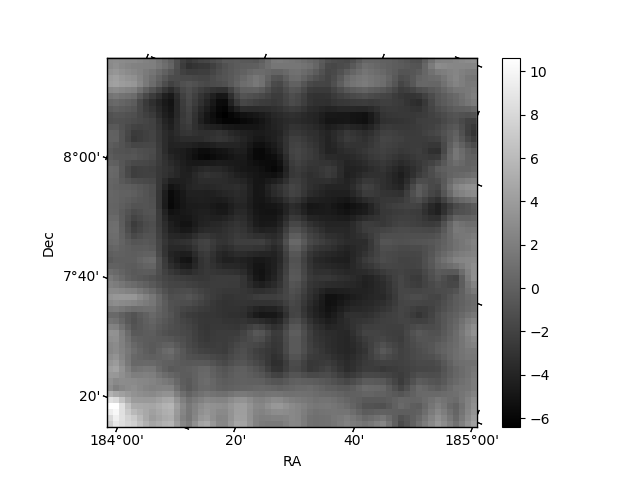
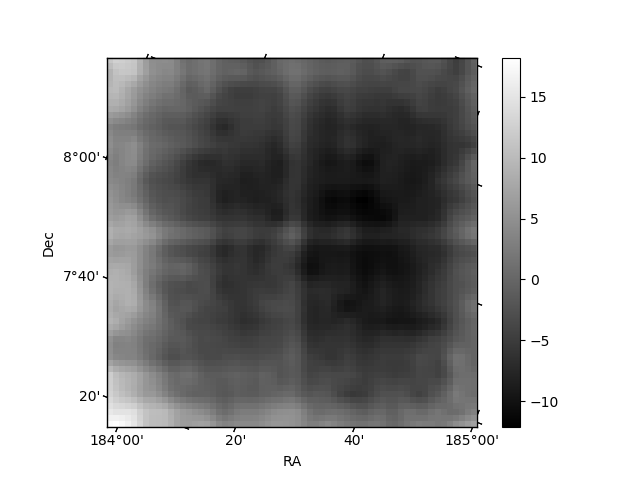
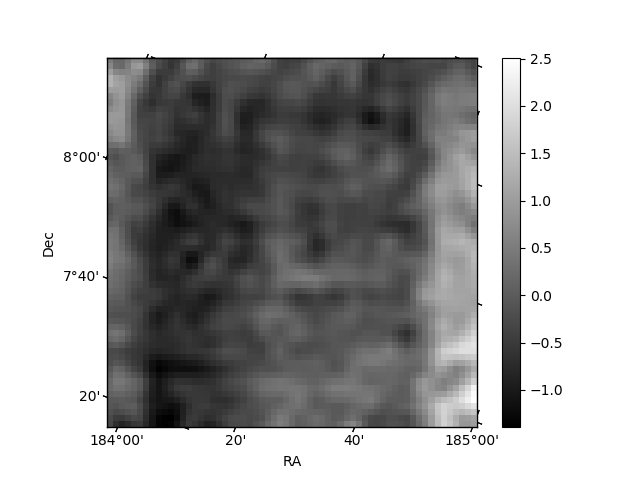
Histogram calculated using DETX and DETY for each event in the final _common_clean file
| Quadrant A | 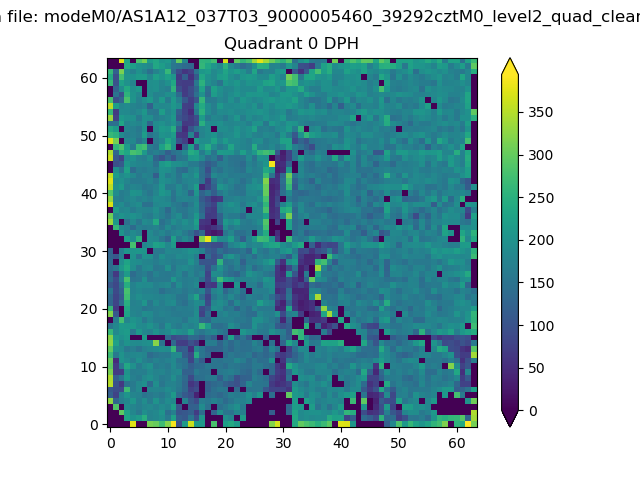 |
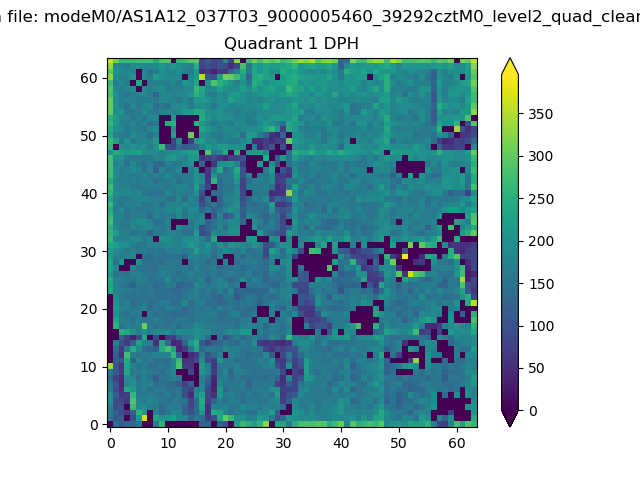 |
Quadrant B |
|---|---|---|---|
| Quadrant D | 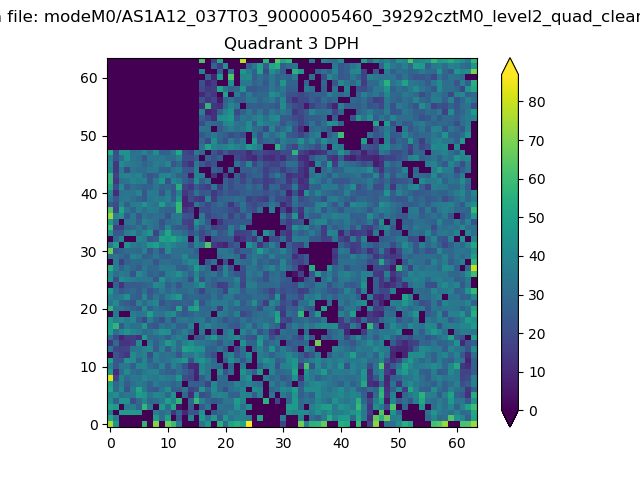 |
 |
Quadrant C |
| Plot type | Count rate plots | Images |
|---|---|---|
| Comparison with Poisson distribution Blue bars denote a histogram of data divided into 1 sec bins. Red curve is a Poisson curve with rate = median count rate of data. |
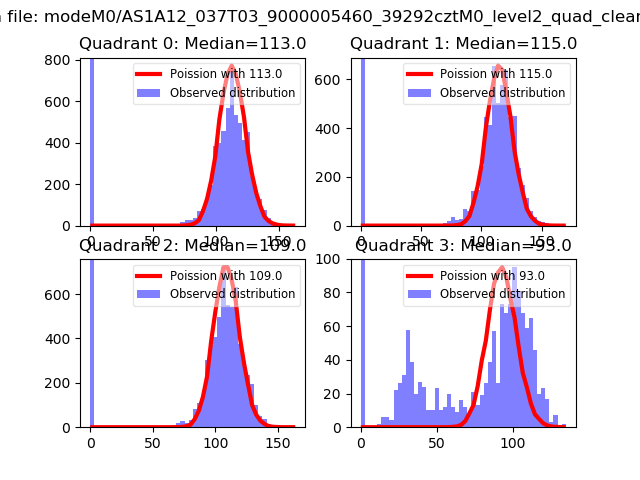 |
 |
| Quadrant-wise count rates Data is divided into 100 sec bins |
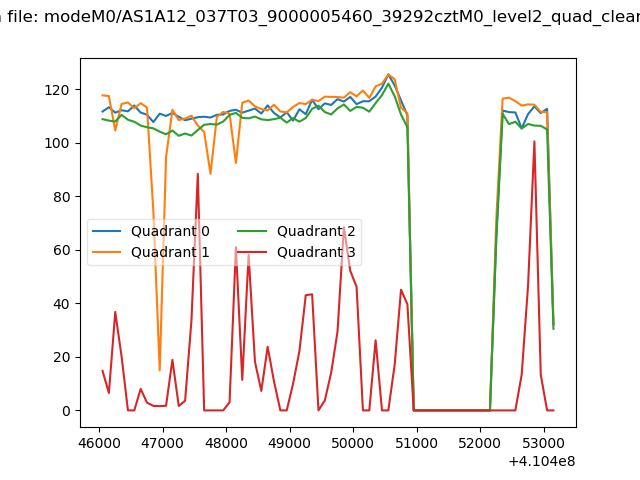 |
|
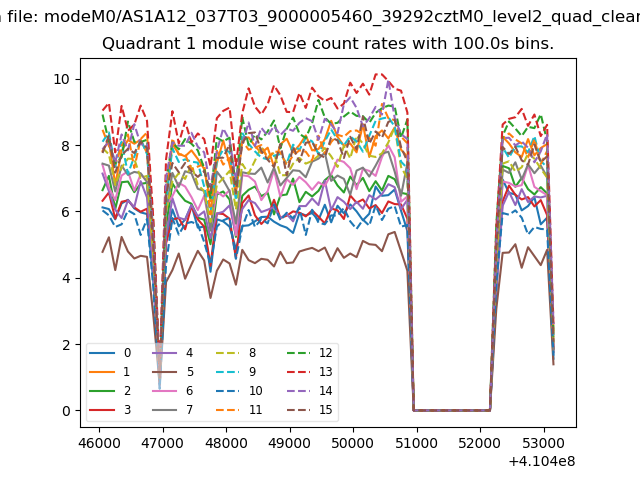
| Module-wise count rates for Quadrant A Data is divided into 100 sec bins |
 |
 |
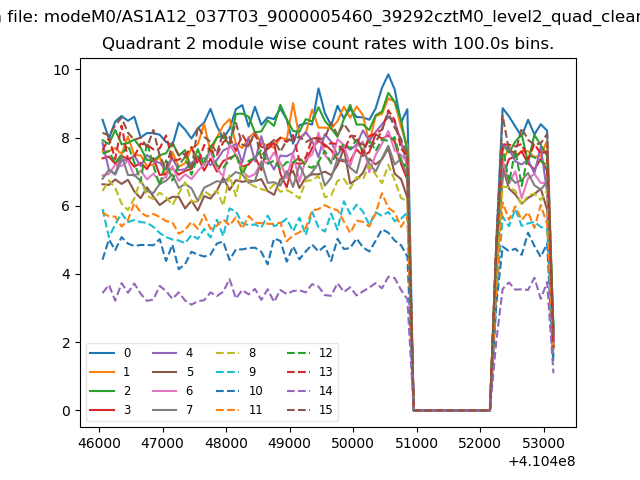
| Module-wise count rates for Quadrant B Data is divided into 100 sec bins |
 |
 |
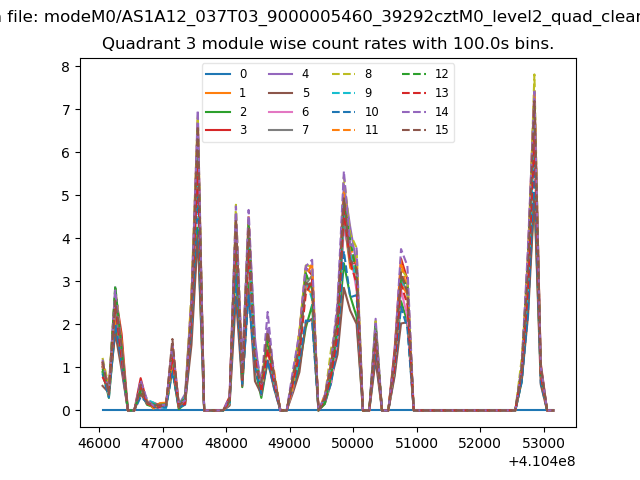
| Module-wise count rates for Quadrant C Data is divided into 100 sec bins |
 |
 |
| Module-wise count rates for Quadrant D Data is divided into 100 sec bins |
 |
 |
| Parameter | Plot |
|---|---|
| CZT HV Monitor |  |
| D_VDD | 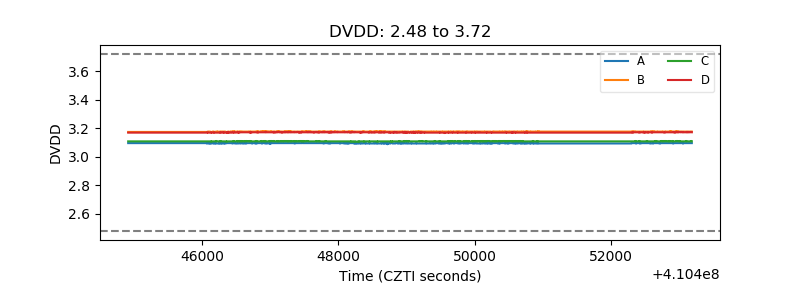 |
| Temperature 1 | 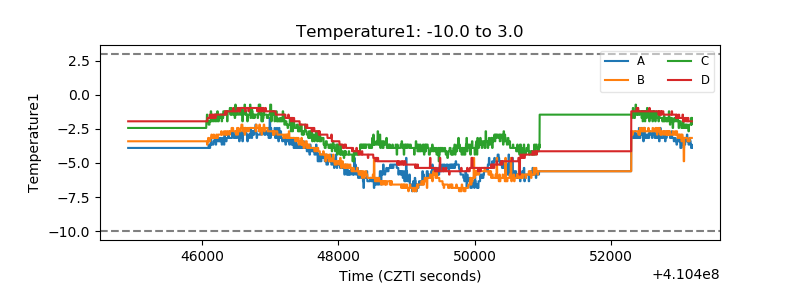 |
| Veto HV Monitor | 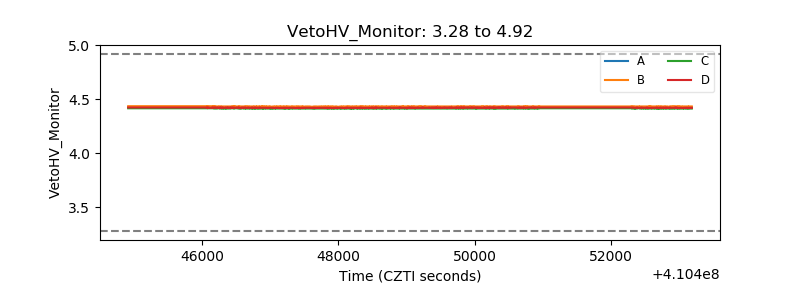 |
| Veto LLD | 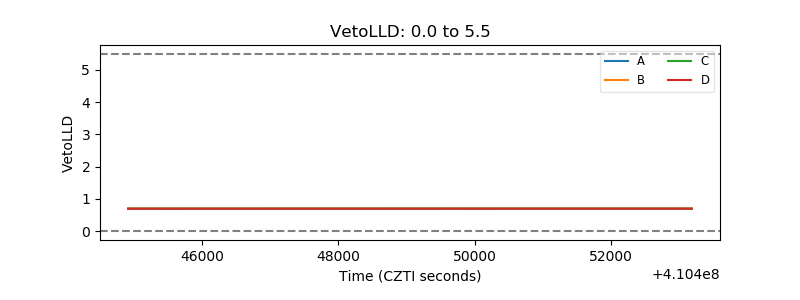 |
| Alpha Counter | 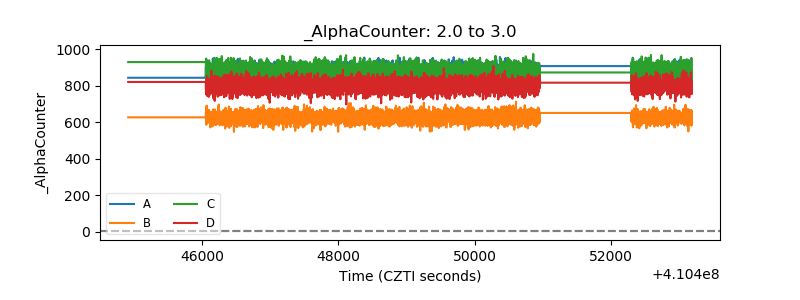 |
| _CPM_Rate | 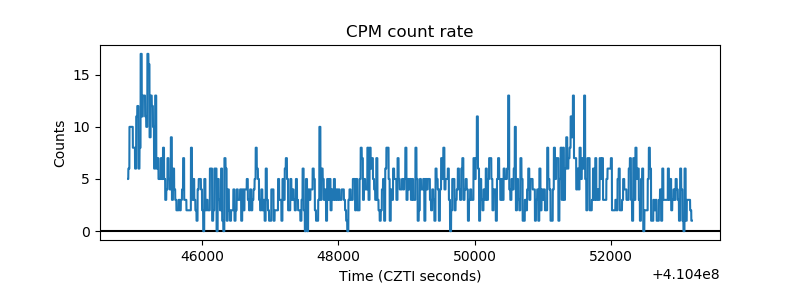 |
| CZT Counter | 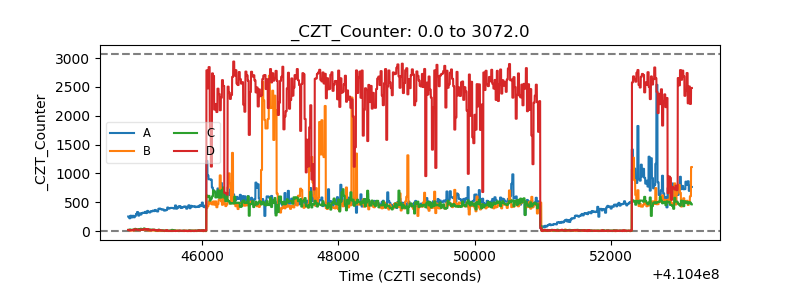 |
| +2.5 Volts monitor | 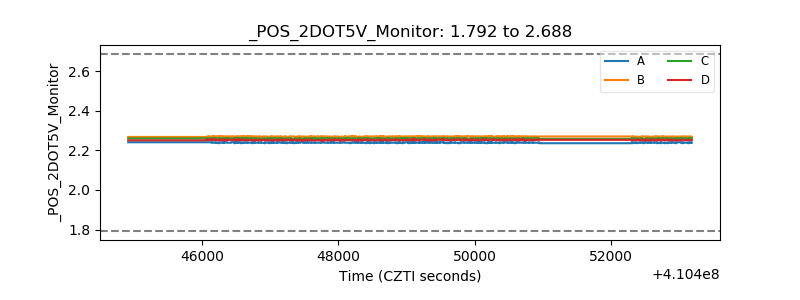 |
| +5 Volts monitor | 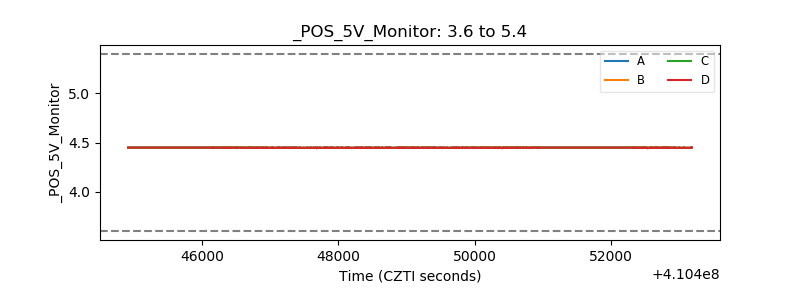 |
| _ROLL_ROT | 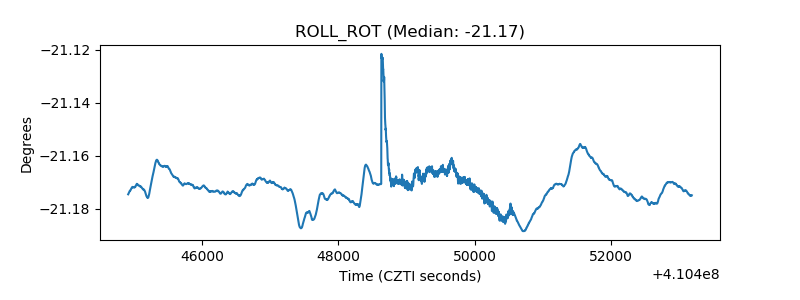 |
| _Roll_DEC | 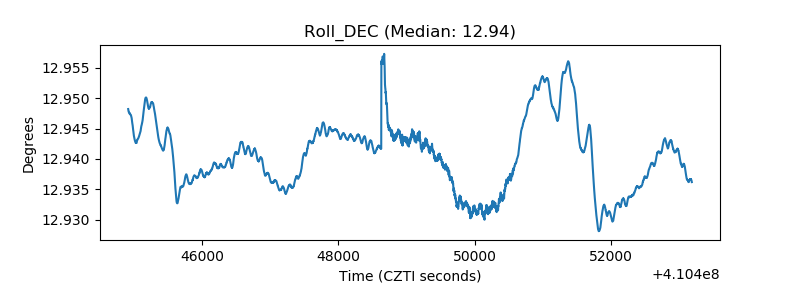 |
| _Roll_RA | 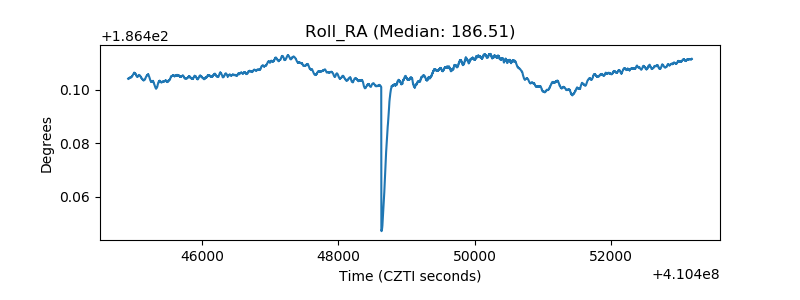 |
| Veto Counter | 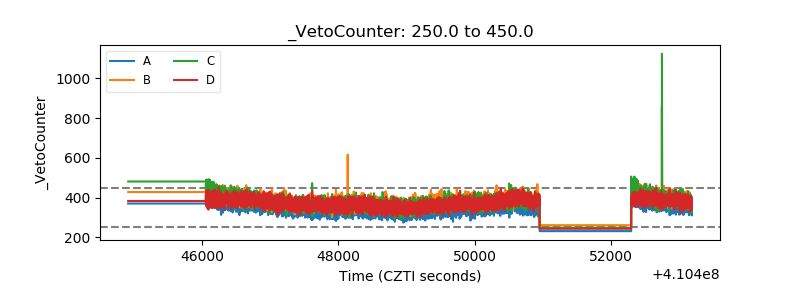 |