| Param | Original file | Final file |
|---|---|---|
| Filename | modeM0/AS1A12_037T03_9000005460_39293cztM0_level2.fits | modeM0/AS1A12_037T03_9000005460_39293cztM0_level2_quad_clean.evt |
| Size (bytes) | 281,868,480 | 33,871,680 |
| Size | 268.8 MB | 32.3 MB |
| Events in quadrant A | 2,108,332 | 267,081 |
| Events in quadrant B | 1,238,809 | 273,721 |
| Events in quadrant C | 1,172,401 | 261,297 |
| Events in quadrant D | 5,722,021 | 47,517 |
| Mode M0 | |||
|---|---|---|---|
| Quadrant | BADHDUFLAG | Total packets | Discarded packets |
| A | 0 | 8020 | 1 |
| B | 0 | 5343 | 1 |
| C | 0 | 4940 | 1 |
| D | 0 | 18709 | 1 |
| Mode SS | |||
|---|---|---|---|
| Quadrant | BADHDUFLAG | Total packets | Discarded packets |
| A | 0 | 50 | 0 |
| B | 0 | 50 | 0 |
| C | 0 | 50 | 0 |
| D | 0 | 50 | 0 |
| Mode M9 | |||
|---|---|---|---|
| Quadrant | BADHDUFLAG | Total packets | Discarded packets |
| A | 1 | 139995604260904 | 139994459013166 |
| B | 1 | -1 | -1 |
| C | 1 | -1 | -1 |
| D | 1 | -1 | -1 |
| Quadrant | Total seconds | Saturated seconds | Saturation percentage |
|---|---|---|---|
| A | 2447 | 60 | 2.451982% |
| B | 2447 | 12 | 0.490396% |
| C | 2447 | 3 | 0.122599% |
| D | 2447 | 2051 | 83.816919% |
Noise dominated data is calculated using 1-second bins in cleaned event files. If a bin has >2000 counts, and if more than 50% of those come from <1% of pixels, then it is considered to be noise-dominated and hence unusable.
| Quadrant | # 1 sec bins | Bins with >0 counts | Bins with >2000 counts | High rate bins dominated by noise | Noise dominated (total time) | Noise dominated (detector-on time) | Marked lightcurve |
|---|---|---|---|---|---|---|---|
| A | 2447 | 2447 | 30 | 30 | 1.23% | 1.23% | 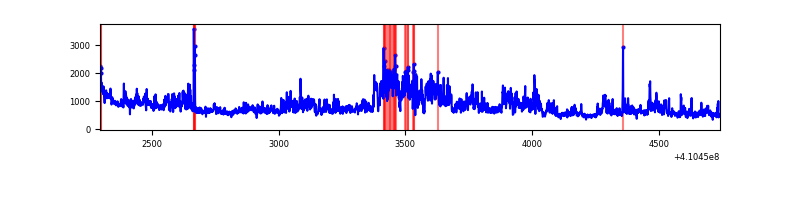 |
| B | 2447 | 2447 | 1 | 1 | 0.04% | 0.04% | 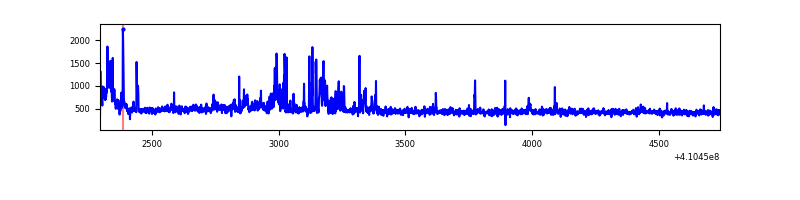 |
| C | 2447 | 2447 | 0 | 0 | 0.00% | 0.00% | 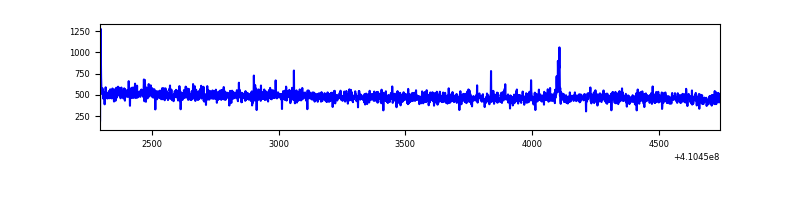 |
| D | 2446 | 2446 | 1664 | 1664 | 68.03% | 68.03% | 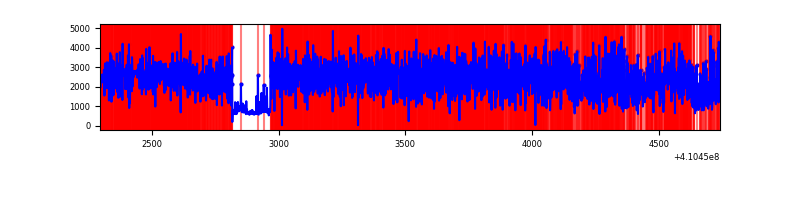 |
Top three noisy pixels from each quadrant. If the there are fewer than three noisy pixels in the level2.evt file, extra rows are filled as -1
| Pixel properties | Quadrant properties | ||||||
|---|---|---|---|---|---|---|---|
| Quadrant | DetID | PixID | Counts | Sigma | Mean | Median | Sigma |
| A | 15 | 222 | 793007 | 13713.77 | 275 | 269 | 57.8 |
| A | 10 | 83 | 205096 | 3543.35 | 275 | 269 | 57.8 |
| A | 13 | 248 | 43534 | 748.45 | 275 | 269 | 57.8 |
| B | 5 | 172 | 142015 | 2566.04 | 274 | 267 | 55.2 |
| B | 0 | 190 | 8349 | 146.31 | 274 | 267 | 55.2 |
| B | 12 | 111 | 6779 | 117.89 | 274 | 267 | 55.2 |
| C | 15 | 214 | 103854 | 1587.62 | 271 | 272 | 65.2 |
| C | 9 | 187 | 5554 | 80.96 | 271 | 272 | 65.2 |
| C | 0 | 10 | 2765 | 38.21 | 271 | 272 | 65.2 |
| D | 12 | 235 | 4958684 | 129618.24 | 146 | 141 | 38.3 |
| D | 12 | 227 | 107087 | 2795.61 | 146 | 141 | 38.3 |
| D | 2 | 250 | 66359 | 1730.96 | 146 | 141 | 38.3 |
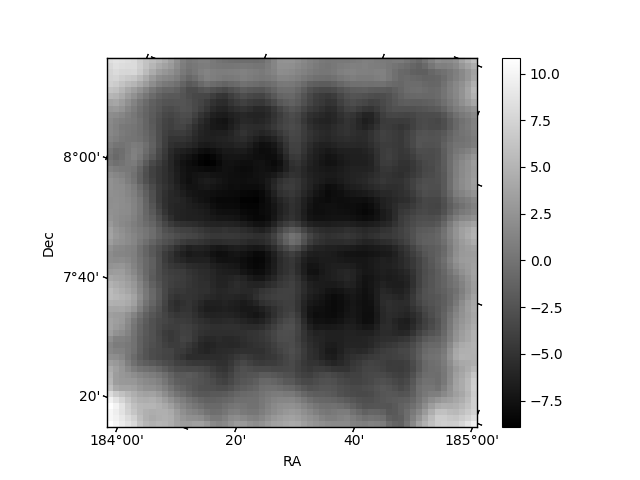
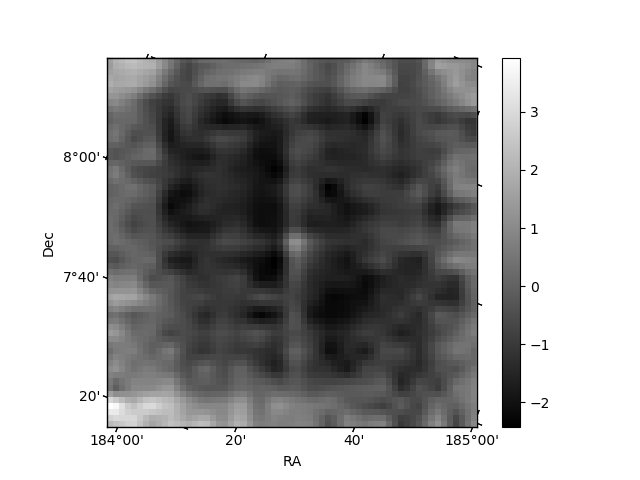
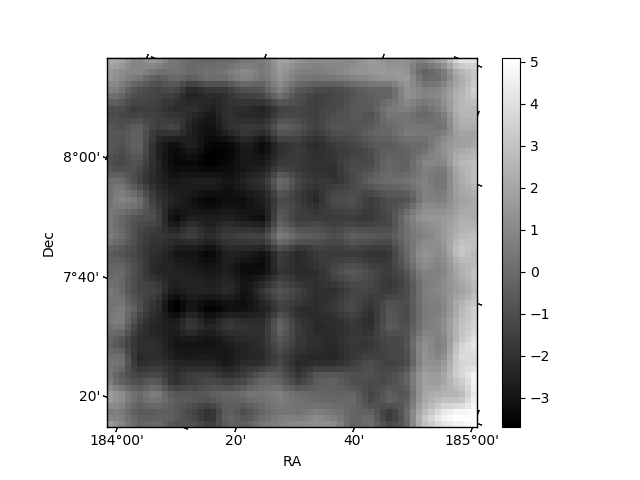
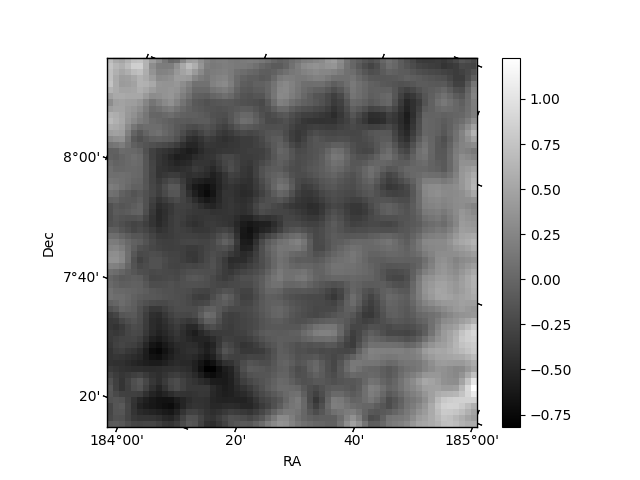
Histogram calculated using DETX and DETY for each event in the final _common_clean file
| Quadrant A | 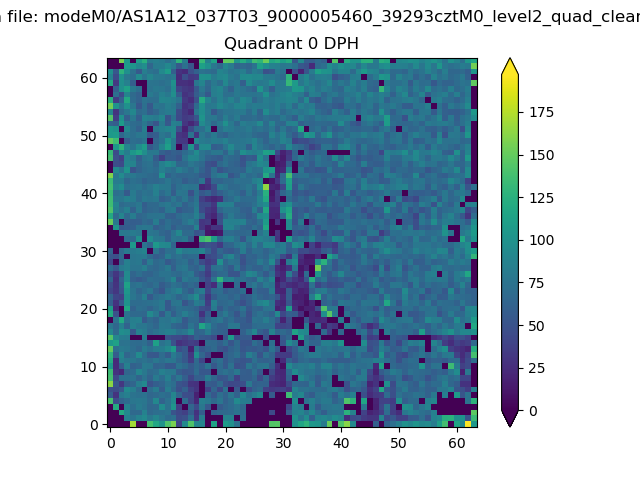 |
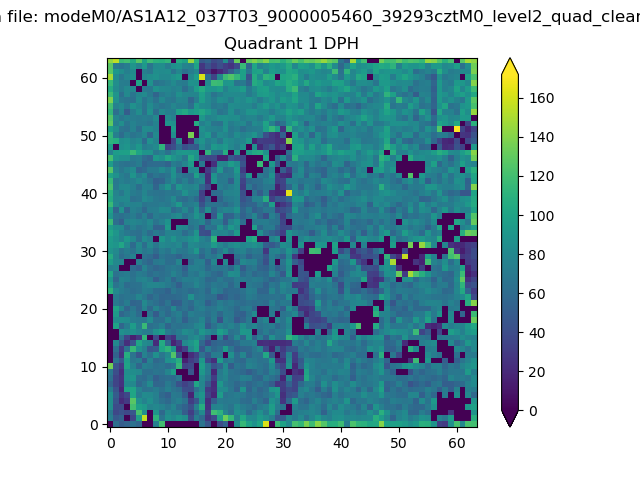 |
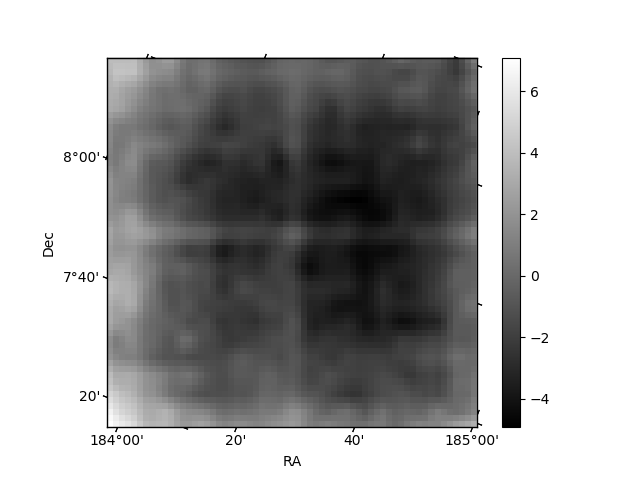
Quadrant B |
|---|---|---|---|
| Quadrant D | 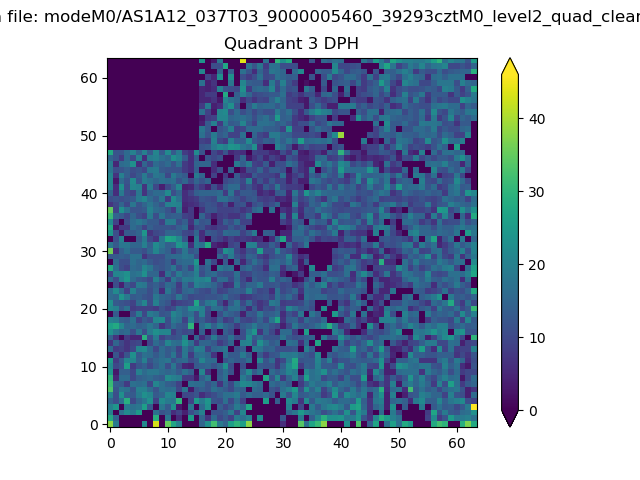 |
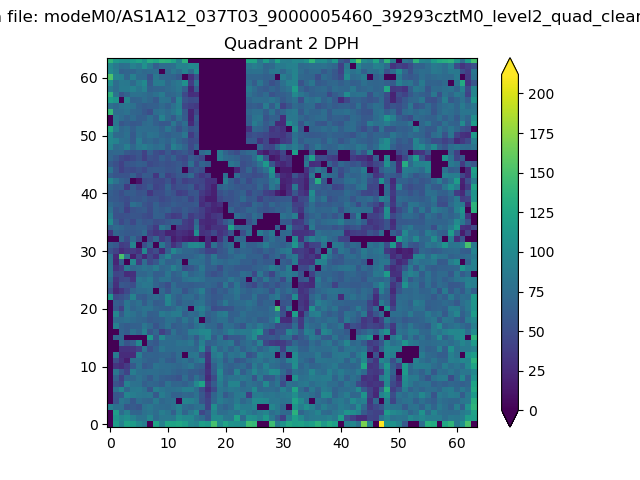 |
Quadrant C |
| Plot type | Count rate plots | Images |
|---|---|---|
| Comparison with Poisson distribution Blue bars denote a histogram of data divided into 1 sec bins. Red curve is a Poisson curve with rate = median count rate of data. |
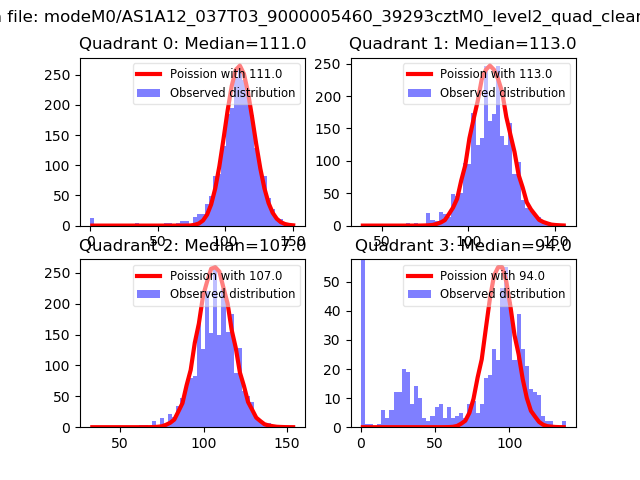 |
 |
| Quadrant-wise count rates Data is divided into 100 sec bins |
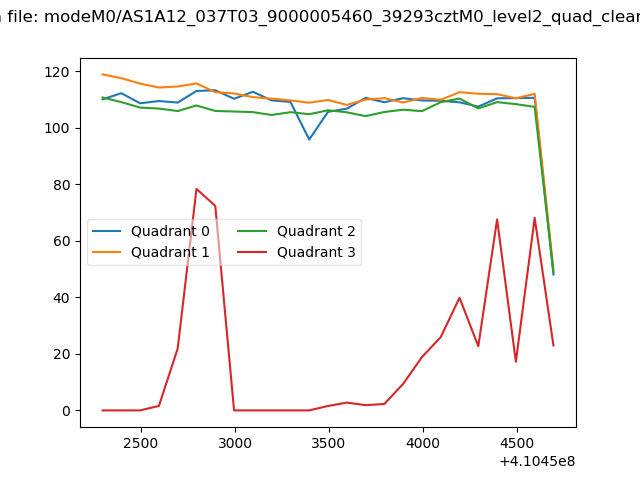 |
|
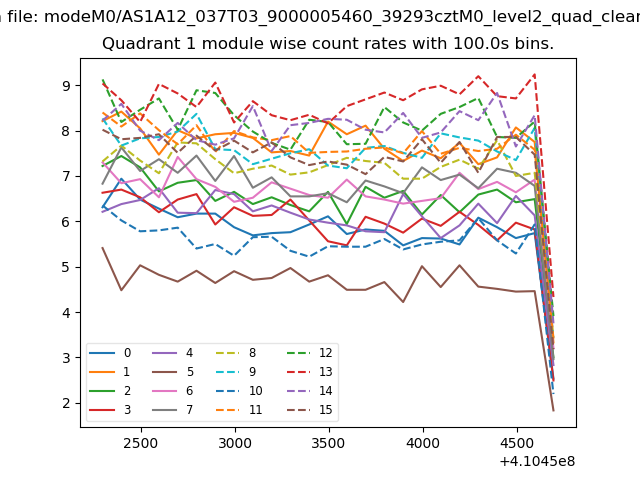
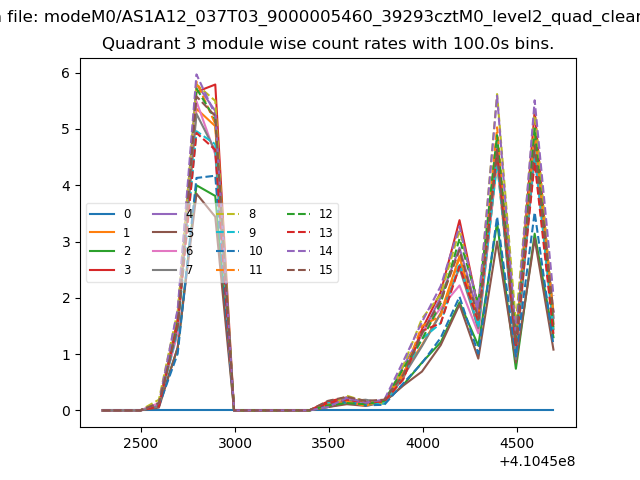
| Module-wise count rates for Quadrant A Data is divided into 100 sec bins |
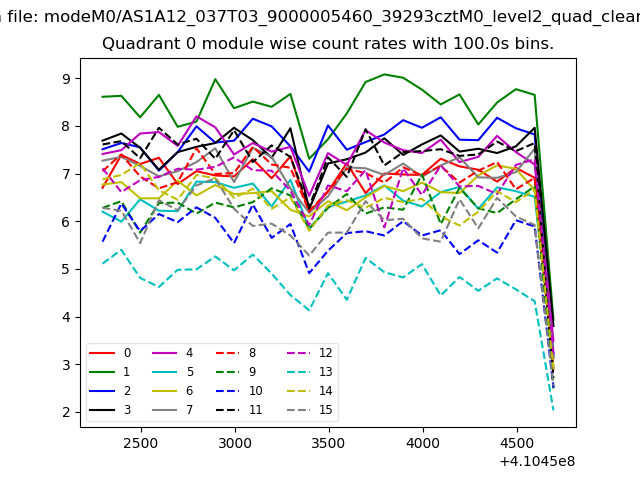 |
 |
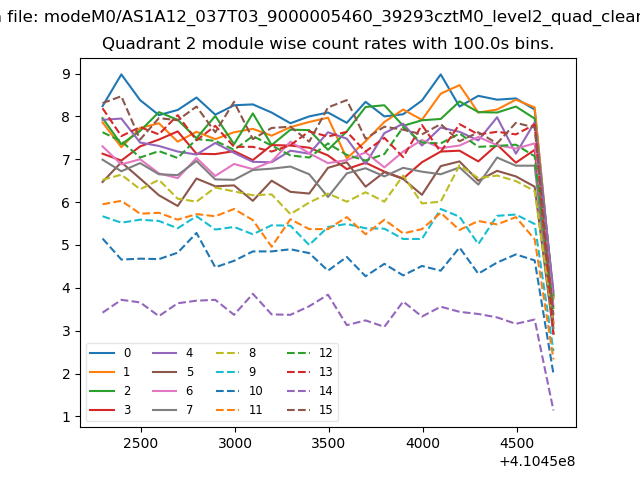
| Module-wise count rates for Quadrant B Data is divided into 100 sec bins |
 |
 |
| Module-wise count rates for Quadrant C Data is divided into 100 sec bins |
 |
 |
| Module-wise count rates for Quadrant D Data is divided into 100 sec bins |
 |
 |
| Parameter | Plot |
|---|---|
| CZT HV Monitor | 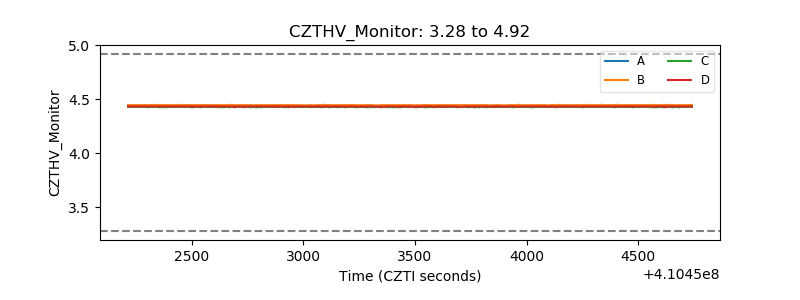 |
| D_VDD | 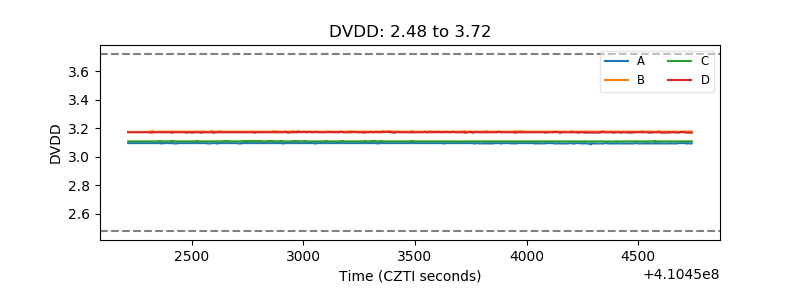 |
| Temperature 1 | 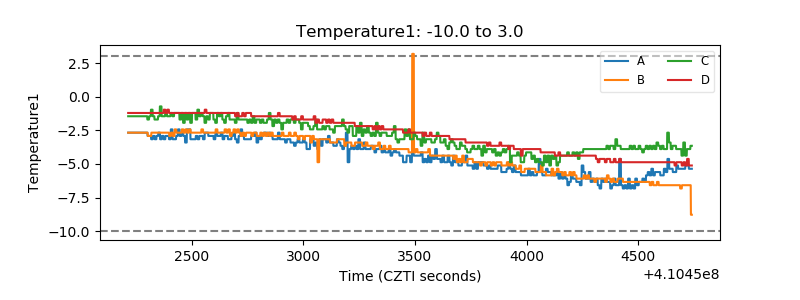 |
| Veto HV Monitor | 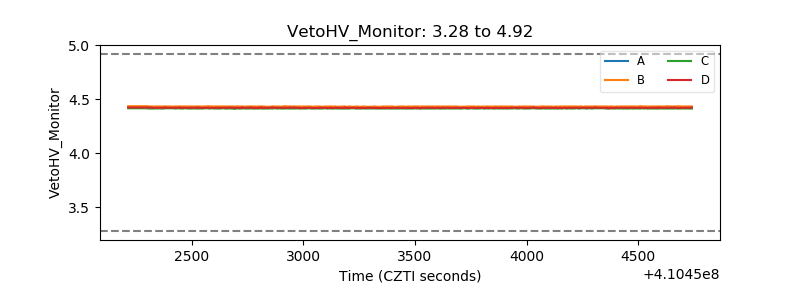 |
| Veto LLD | 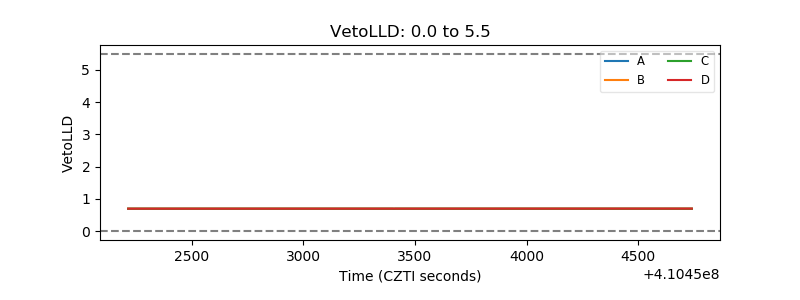 |
| Alpha Counter | 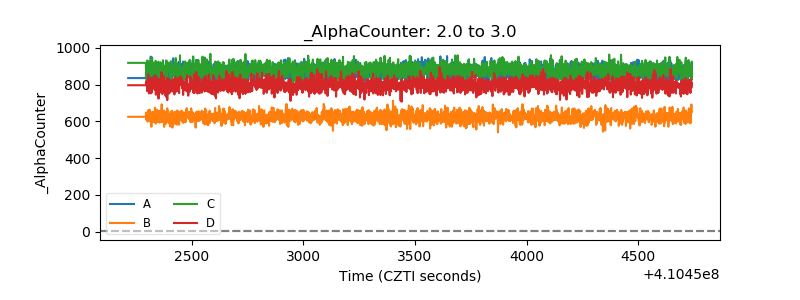 |
| _CPM_Rate | 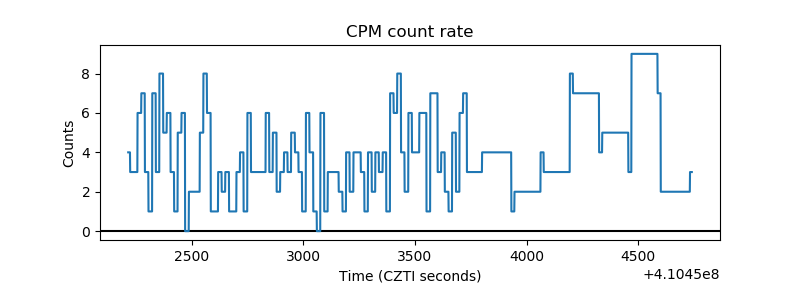 |
| CZT Counter | 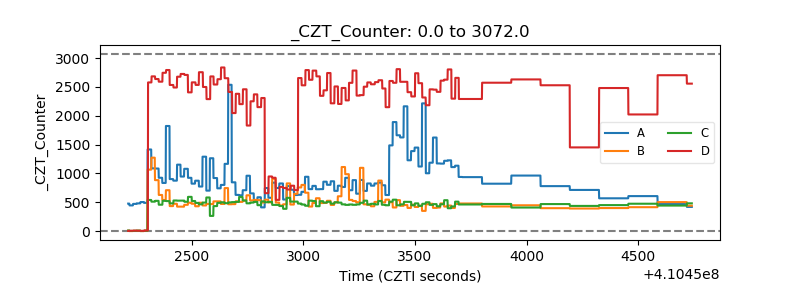 |
| +2.5 Volts monitor | 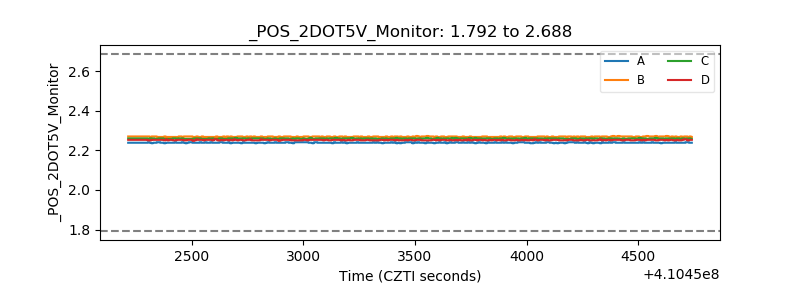 |
| +5 Volts monitor | 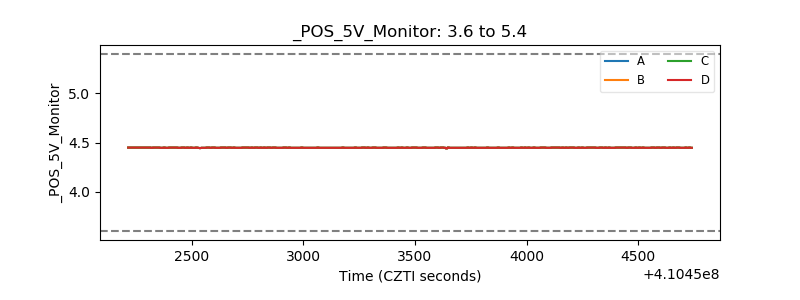 |
| _ROLL_ROT | 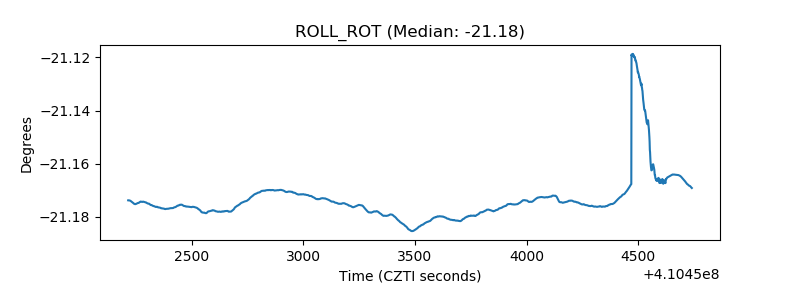 |
| _Roll_DEC |  |
| _Roll_RA | 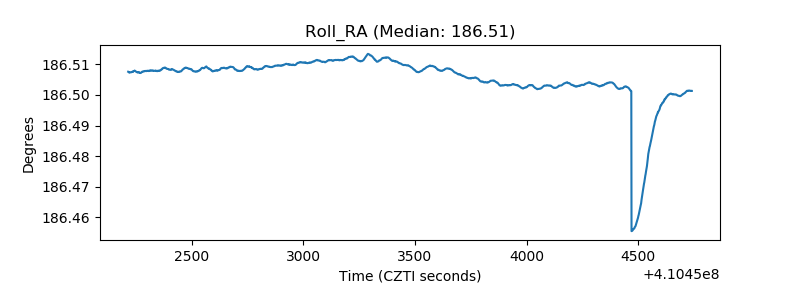 |
| Veto Counter | 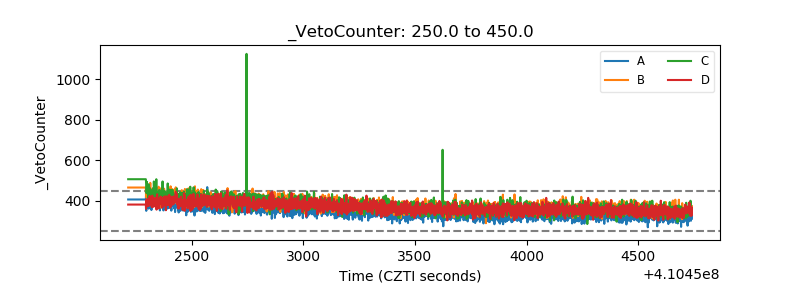 |