| Param | Original file | Final file |
|---|---|---|
| Filename | modeM0/AS1A12_042T01_9000005462_39293cztM0_level2.fits | modeM0/AS1A12_042T01_9000005462_39293cztM0_level2_quad_clean.evt |
| Size (bytes) | 273,427,200 | 40,697,280 |
| Size | 260.8 MB | 38.8 MB |
| Events in quadrant A | 1,601,951 | 310,324 |
| Events in quadrant B | 1,873,814 | 293,892 |
| Events in quadrant C | 1,285,593 | 298,774 |
| Events in quadrant D | 5,147,675 | 136,305 |
| Mode SS | |||
|---|---|---|---|
| Quadrant | BADHDUFLAG | Total packets | Discarded packets |
| A | 0 | 54 | 0 |
| B | 0 | 54 | 0 |
| C | 0 | 54 | 0 |
| D | 0 | 54 | 0 |
| Mode M0 | |||
|---|---|---|---|
| Quadrant | BADHDUFLAG | Total packets | Discarded packets |
| A | 0 | 6363 | 2 |
| B | 0 | 7363 | 1 |
| C | 0 | 5442 | 1 |
| D | 0 | 17163 | 1 |
| Mode M9 | |||
|---|---|---|---|
| Quadrant | BADHDUFLAG | Total packets | Discarded packets |
| A | 0 | 13 | 0 |
| B | 0 | 13 | 0 |
| C | 0 | 13 | 0 |
| D | 0 | 13 | 0 |
| Quadrant | Total seconds | Saturated seconds | Saturation percentage |
|---|---|---|---|
| A | 2705 | 25 | 0.924214% |
| B | 2705 | 228 | 8.428835% |
| C | 2705 | 2 | 0.073937% |
| D | 2705 | 1522 | 56.266174% |
Noise dominated data is calculated using 1-second bins in cleaned event files. If a bin has >2000 counts, and if more than 50% of those come from <1% of pixels, then it is considered to be noise-dominated and hence unusable.
| Quadrant | # 1 sec bins | Bins with >0 counts | Bins with >2000 counts | High rate bins dominated by noise | Noise dominated (total time) | Noise dominated (detector-on time) | Marked lightcurve |
|---|---|---|---|---|---|---|---|
| A | 3988 | 2706 | 9 | 9 | 0.23% | 0.33% | 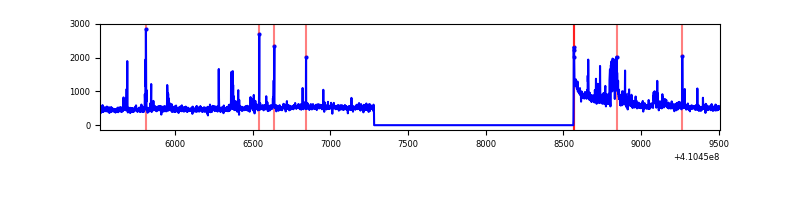 |
| B | 3988 | 2706 | 140 | 140 | 3.51% | 5.17% | 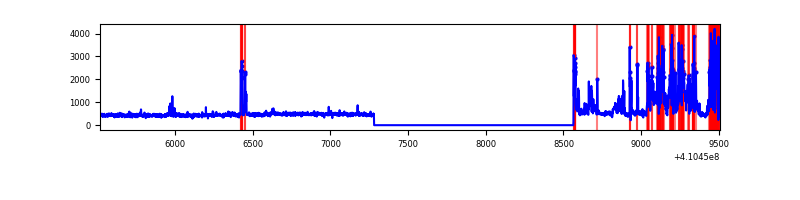 |
| C | 3988 | 2706 | 0 | 0 | 0.00% | 0.00% | 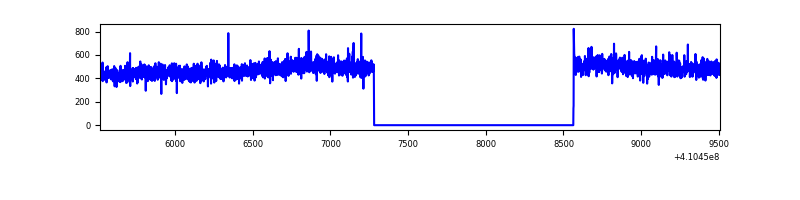 |
| D | 3988 | 2706 | 1363 | 1363 | 34.18% | 50.37% | 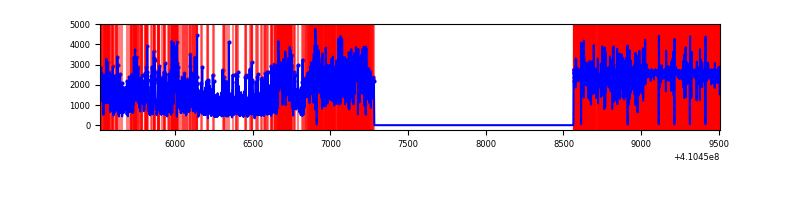 |
Top three noisy pixels from each quadrant. If the there are fewer than three noisy pixels in the level2.evt file, extra rows are filled as -1
| Pixel properties | Quadrant properties | ||||||
|---|---|---|---|---|---|---|---|
| Quadrant | DetID | PixID | Counts | Sigma | Mean | Median | Sigma |
| A | 10 | 83 | 223931 | 3463.06 | 311 | 304 | 64.6 |
| A | 13 | 248 | 139300 | 2152.48 | 311 | 304 | 64.6 |
| A | 15 | 222 | 30854 | 473.09 | 311 | 304 | 64.6 |
| B | 5 | 172 | 625869 | 10547.75 | 297 | 288 | 59.3 |
| B | 5 | 255 | 50234 | 842.13 | 297 | 288 | 59.3 |
| B | 12 | 111 | 7353 | 119.12 | 297 | 288 | 59.3 |
| C | 15 | 214 | 115035 | 1624.38 | 299 | 300 | 70.6 |
| C | 9 | 187 | 2446 | 30.38 | 299 | 300 | 70.6 |
| C | 13 | 61 | 2000 | 24.07 | 299 | 300 | 70.6 |
| D | 12 | 235 | 3333179 | 64790.18 | 205 | 198 | 51.4 |
| D | 12 | 227 | 403968 | 7848.93 | 205 | 198 | 51.4 |
| D | 5 | 32 | 215267 | 4180.75 | 205 | 198 | 51.4 |
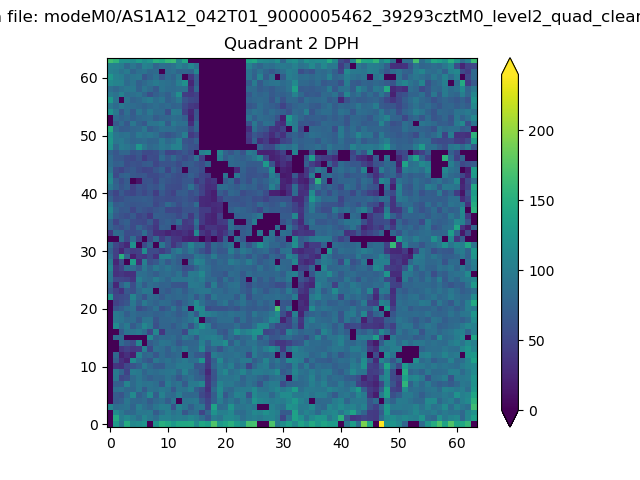
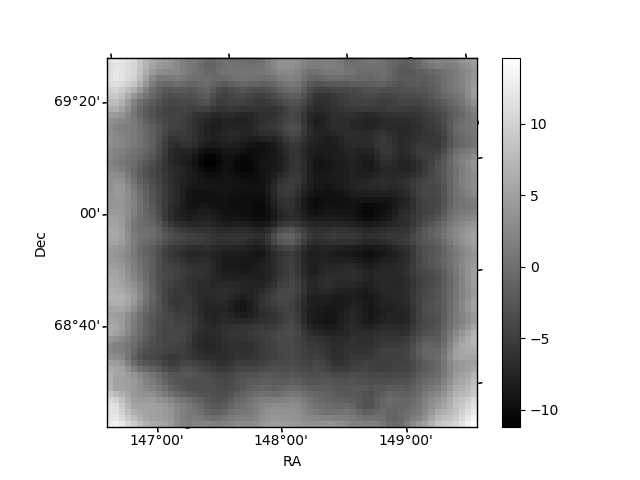
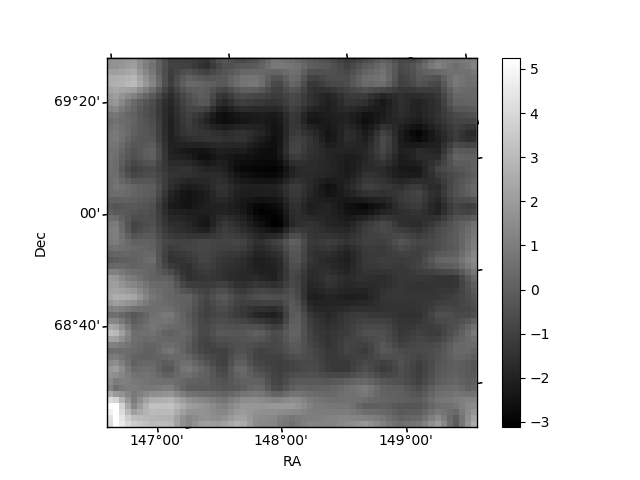
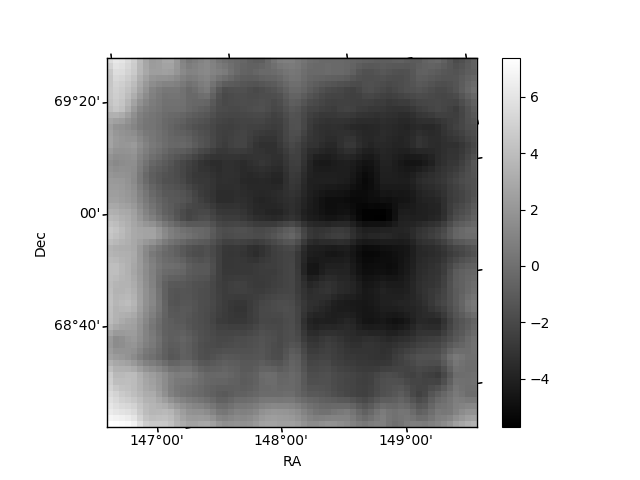
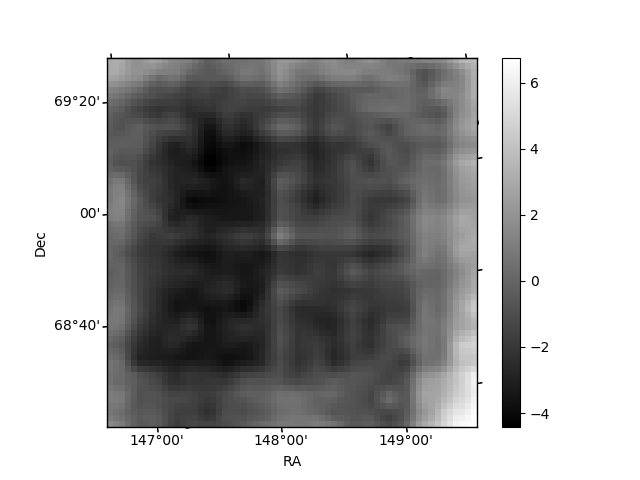
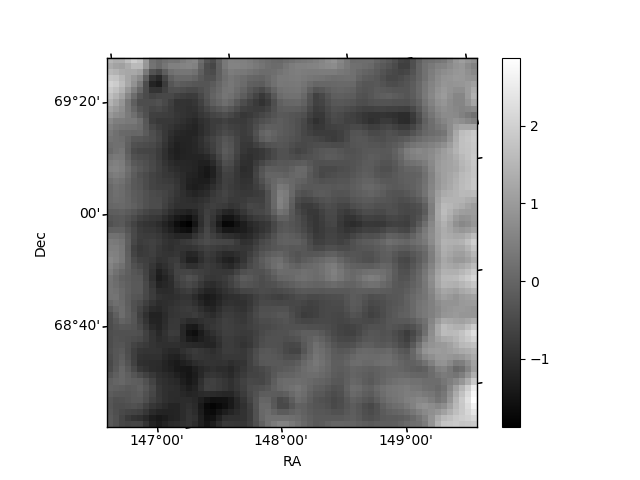
Histogram calculated using DETX and DETY for each event in the final _common_clean file
| Quadrant A | 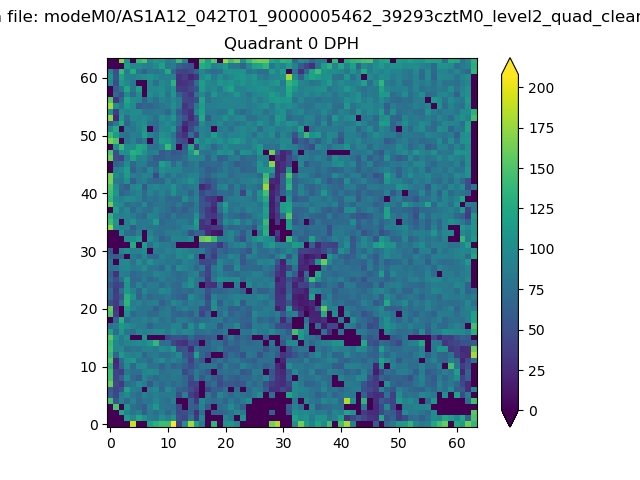 |
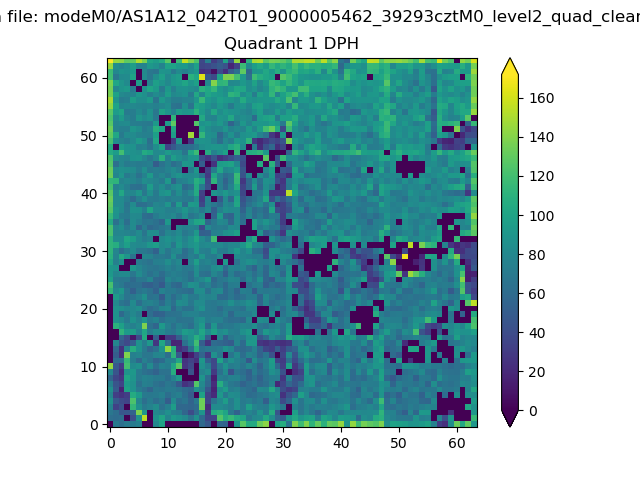 |
Quadrant B |
|---|---|---|---|
| Quadrant D | 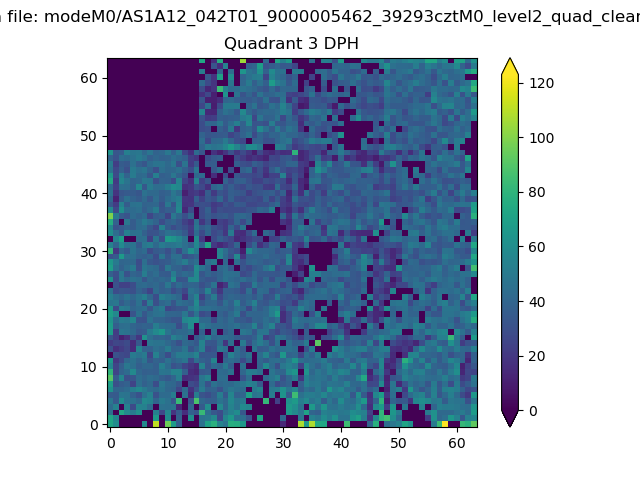 |
 |
Quadrant C |
| Plot type | Count rate plots | Images |
|---|---|---|
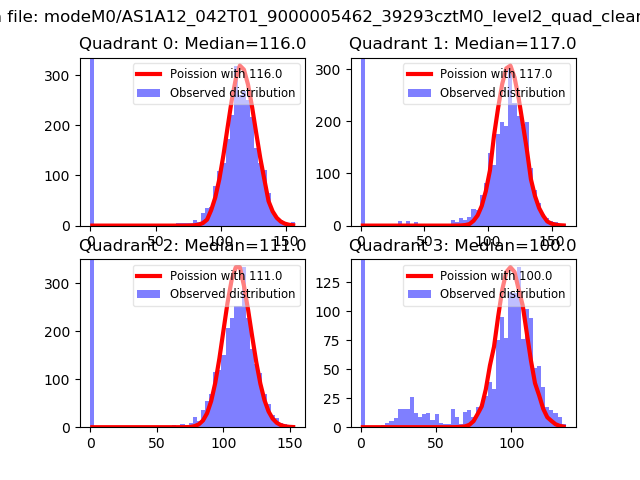
| Comparison with Poisson distribution Blue bars denote a histogram of data divided into 1 sec bins. Red curve is a Poisson curve with rate = median count rate of data. |
 |
 |
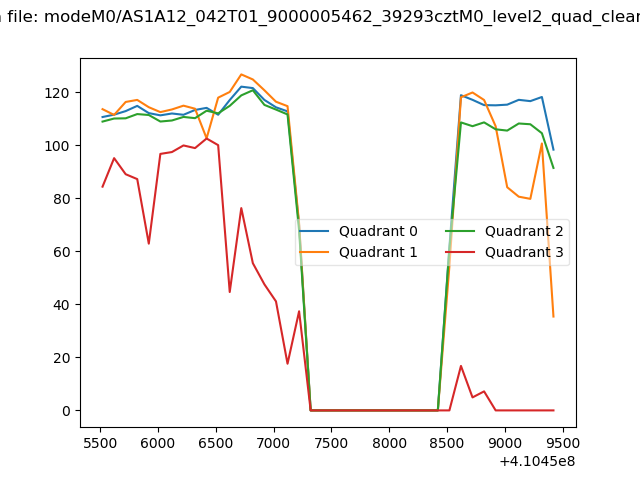
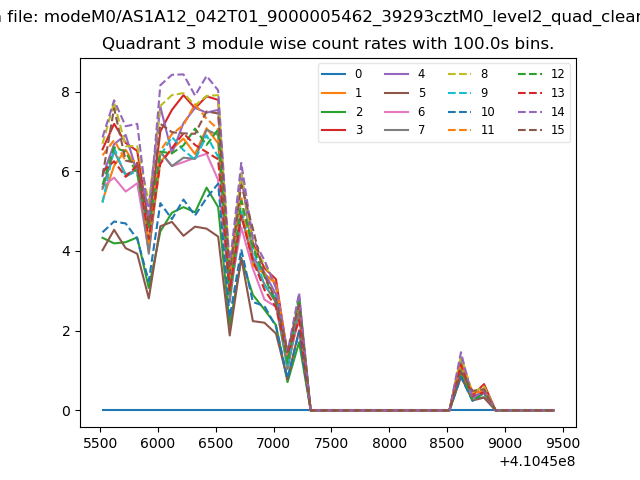
| Quadrant-wise count rates Data is divided into 100 sec bins |
 |
|
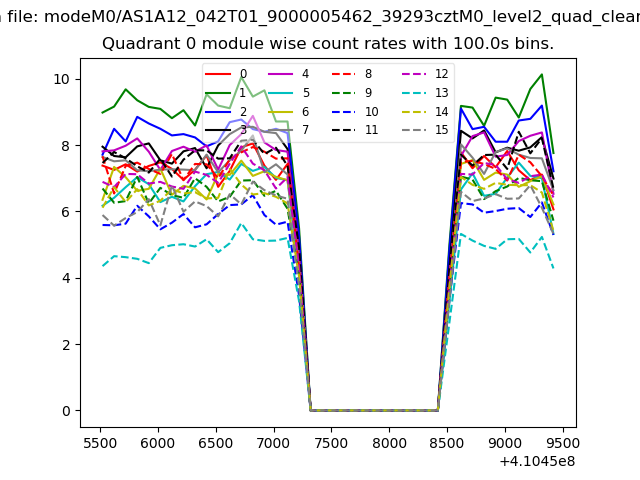
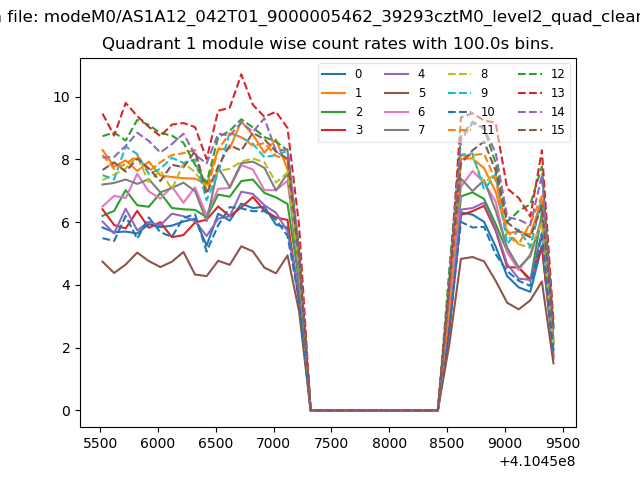
| Module-wise count rates for Quadrant A Data is divided into 100 sec bins |
 |
 |
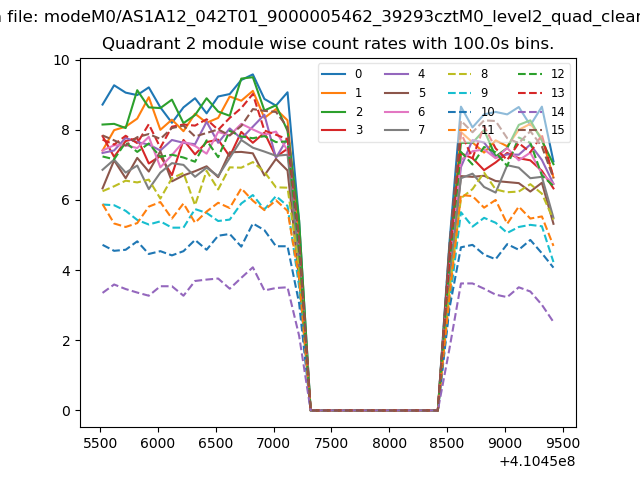
| Module-wise count rates for Quadrant B Data is divided into 100 sec bins |
 |
 |
| Module-wise count rates for Quadrant C Data is divided into 100 sec bins |
 |
 |
| Module-wise count rates for Quadrant D Data is divided into 100 sec bins |
 |
 |
| Parameter | Plot |
|---|---|
| CZT HV Monitor | 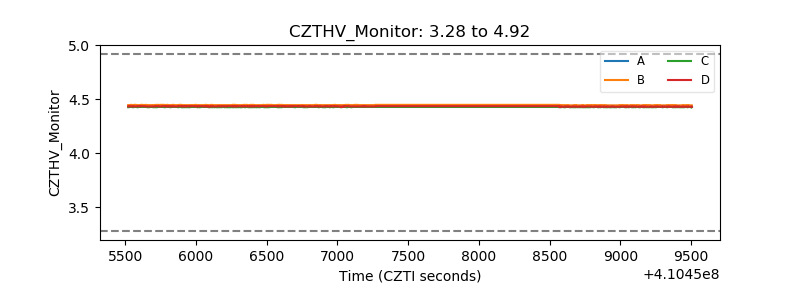 |
| D_VDD | 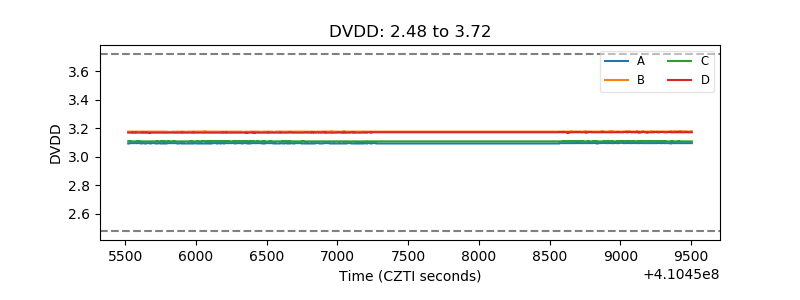 |
| Temperature 1 | 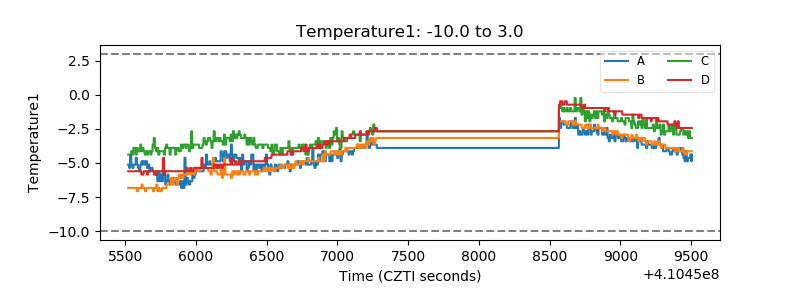 |
| Veto HV Monitor | 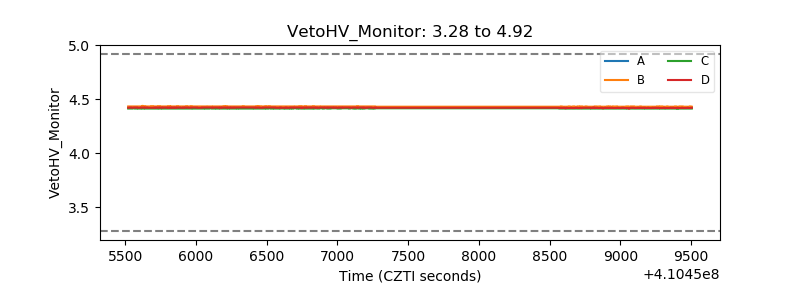 |
| Veto LLD | 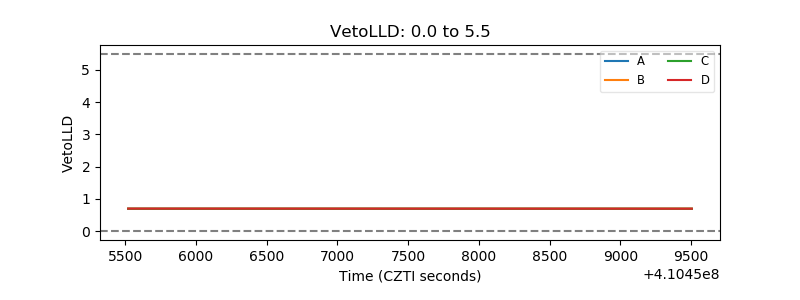 |
| Alpha Counter | 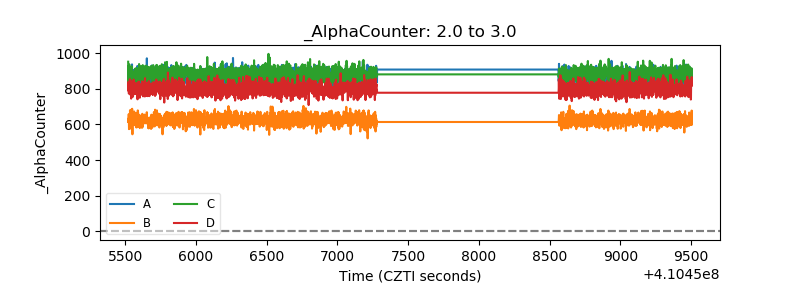 |
| _CPM_Rate | 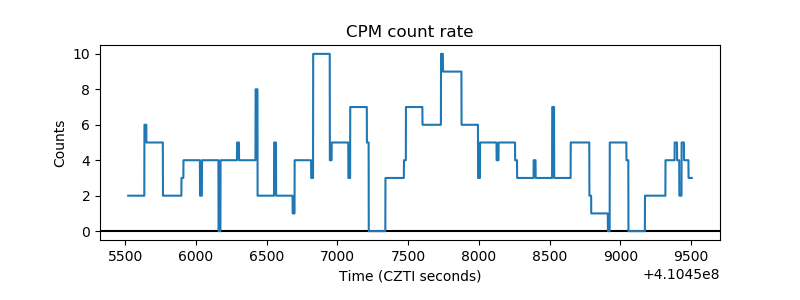 |
| CZT Counter | 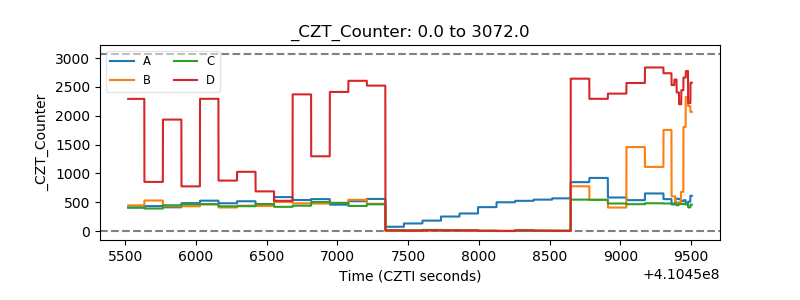 |
| +2.5 Volts monitor |  |
| +5 Volts monitor | 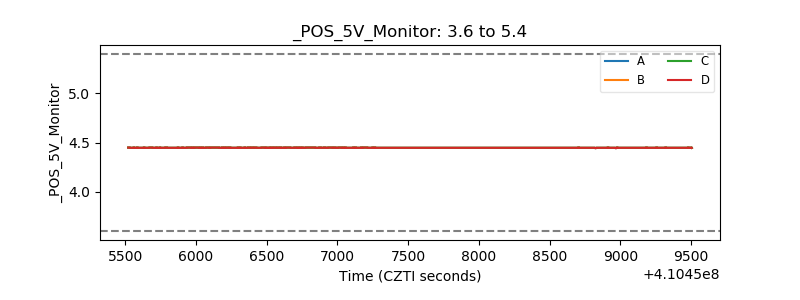 |
| _ROLL_ROT | 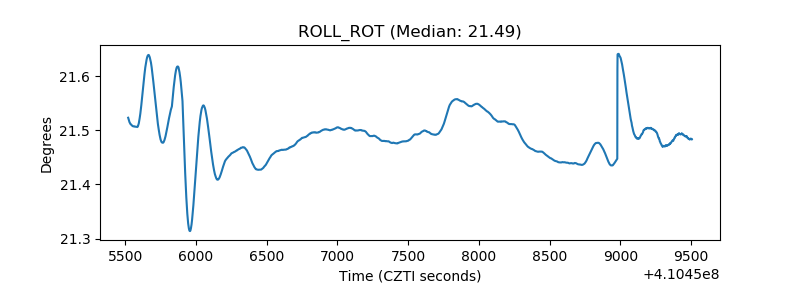 |
| _Roll_DEC | 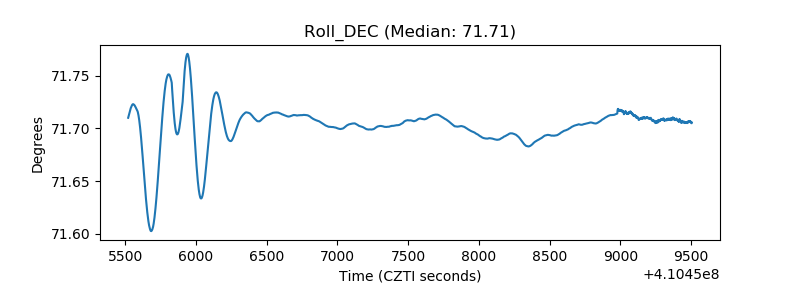 |
| _Roll_RA | 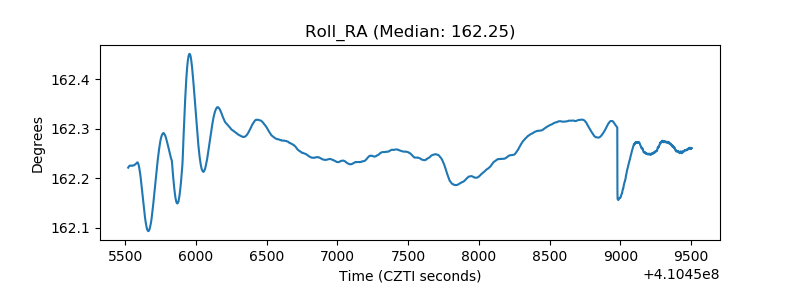 |
| Veto Counter | 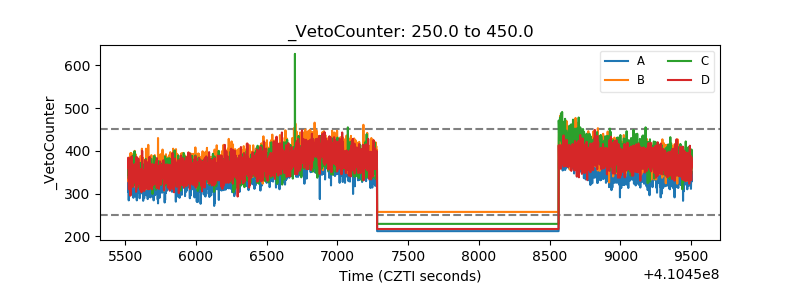 |