| Param | Original file | Final file |
|---|---|---|
| Filename | modeM0/AS1A12_042T01_9000005462_39295cztM0_level2.fits | modeM0/AS1A12_042T01_9000005462_39295cztM0_level2_quad_clean.evt |
| Size (bytes) | 812,856,960 | 98,087,040 |
| Size | 775.2 MB | 93.5 MB |
| Events in quadrant A | 3,749,914 | 816,909 |
| Events in quadrant B | 4,162,080 | 793,741 |
| Events in quadrant C | 3,372,864 | 784,681 |
| Events in quadrant D | 18,236,628 | 66,233 |
| Mode SS | |||
|---|---|---|---|
| Quadrant | BADHDUFLAG | Total packets | Discarded packets |
| A | 0 | 148 | 0 |
| B | 0 | 148 | 0 |
| C | 0 | 148 | 0 |
| D | 0 | 148 | 0 |
| Mode M0 | |||
|---|---|---|---|
| Quadrant | BADHDUFLAG | Total packets | Discarded packets |
| A | 0 | 15860 | 2 |
| B | 0 | 17630 | 1 |
| C | 0 | 14713 | 1 |
| D | 0 | 59232 | 1 |
| Mode M9 | |||
|---|---|---|---|
| Quadrant | BADHDUFLAG | Total packets | Discarded packets |
| A | 0 | 13 | 0 |
| B | 0 | 13 | 0 |
| C | 0 | 13 | 0 |
| D | 0 | 13 | 0 |
| Quadrant | Total seconds | Saturated seconds | Saturation percentage |
|---|---|---|---|
| A | 7301 | 21 | 0.287632% |
| B | 7301 | 326 | 4.465142% |
| C | 7301 | 6 | 0.082181% |
| D | 7301 | 6740 | 92.316121% |
Noise dominated data is calculated using 1-second bins in cleaned event files. If a bin has >2000 counts, and if more than 50% of those come from <1% of pixels, then it is considered to be noise-dominated and hence unusable.
| Quadrant | # 1 sec bins | Bins with >0 counts | Bins with >2000 counts | High rate bins dominated by noise | Noise dominated (total time) | Noise dominated (detector-on time) | Marked lightcurve |
|---|---|---|---|---|---|---|---|
| A | 8614 | 7302 | 7 | 7 | 0.08% | 0.10% | 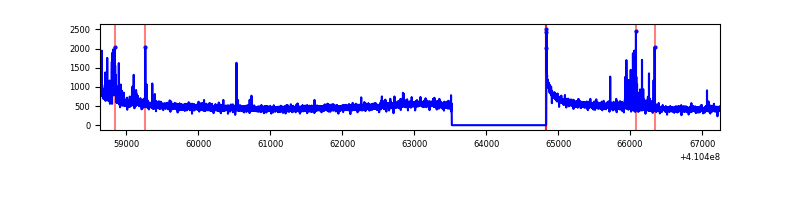 |
| B | 8614 | 7302 | 177 | 177 | 2.05% | 2.42% | 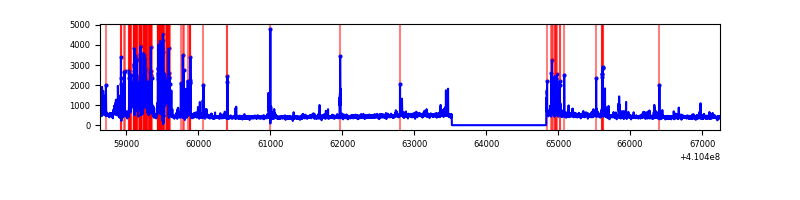 |
| C | 8614 | 7302 | 1 | 1 | 0.01% | 0.01% | 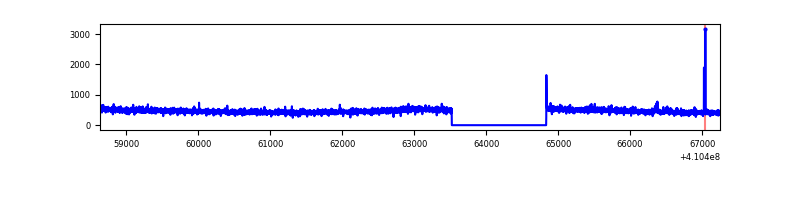 |
| D | 8614 | 7301 | 5892 | 5892 | 68.40% | 80.70% | 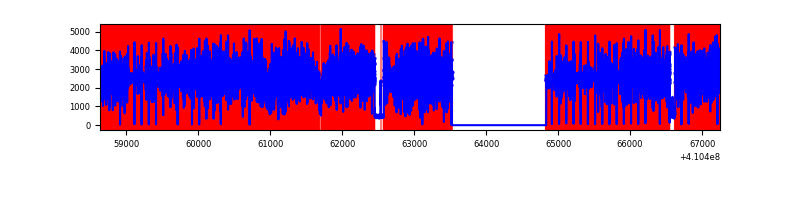 |
Top three noisy pixels from each quadrant. If the there are fewer than three noisy pixels in the level2.evt file, extra rows are filled as -1
| Pixel properties | Quadrant properties | ||||||
|---|---|---|---|---|---|---|---|
| Quadrant | DetID | PixID | Counts | Sigma | Mean | Median | Sigma |
| A | 10 | 83 | 499029 | 3090.48 | 792 | 773 | 161.2 |
| A | 13 | 248 | 156445 | 965.57 | 792 | 773 | 161.2 |
| A | 15 | 222 | 31584 | 191.11 | 792 | 773 | 161.2 |
| B | 5 | 172 | 904264 | 6141.5 | 770 | 748 | 147.1 |
| B | 5 | 255 | 165381 | 1119.06 | 770 | 748 | 147.1 |
| B | 0 | 213 | 27999 | 185.23 | 770 | 748 | 147.1 |
| C | 15 | 214 | 302866 | 1673.05 | 777 | 780 | 180.6 |
| C | 9 | 187 | 28065 | 151.11 | 777 | 780 | 180.6 |
| C | 6 | 255 | 7474 | 37.07 | 777 | 780 | 180.6 |
| D | 12 | 235 | 15624026 | 189176.65 | 330 | 320 | 82.6 |
| D | 12 | 227 | 579433 | 7012.08 | 330 | 320 | 82.6 |
| D | 12 | 233 | 412129 | 4986.31 | 330 | 320 | 82.6 |
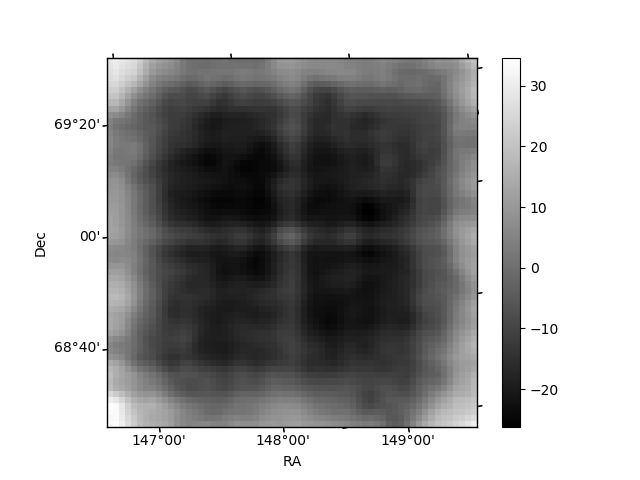
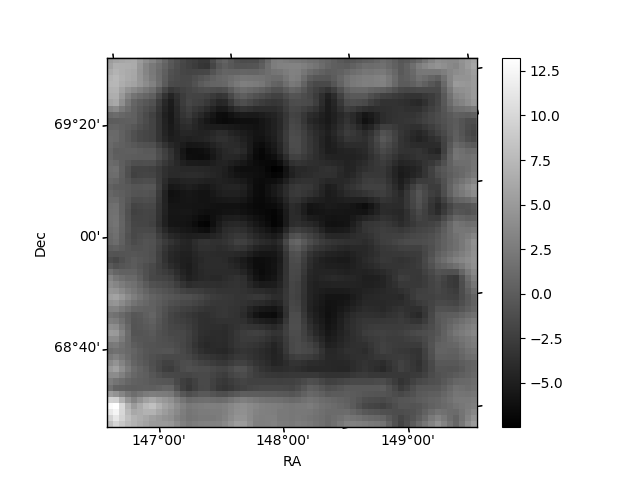
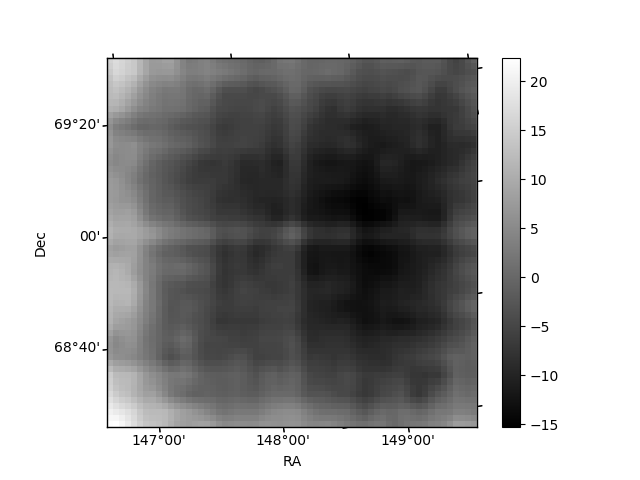
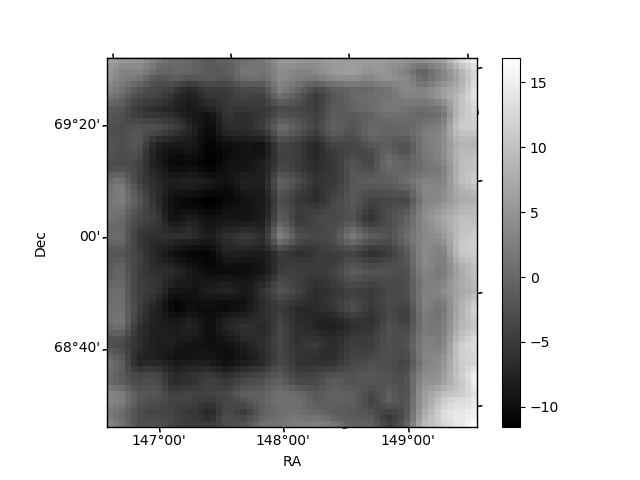
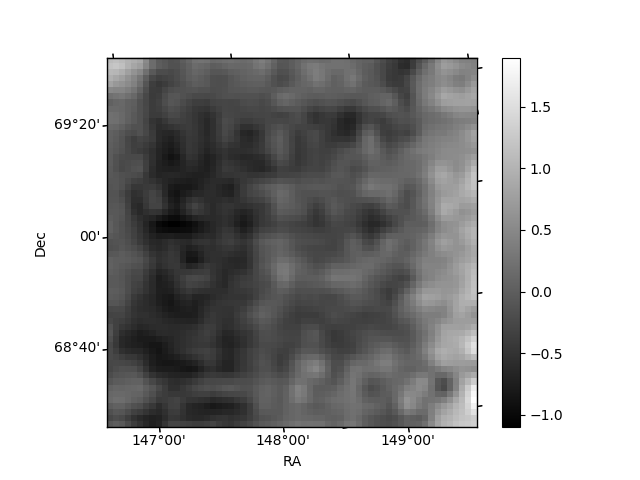
Histogram calculated using DETX and DETY for each event in the final _common_clean file
| Quadrant A | 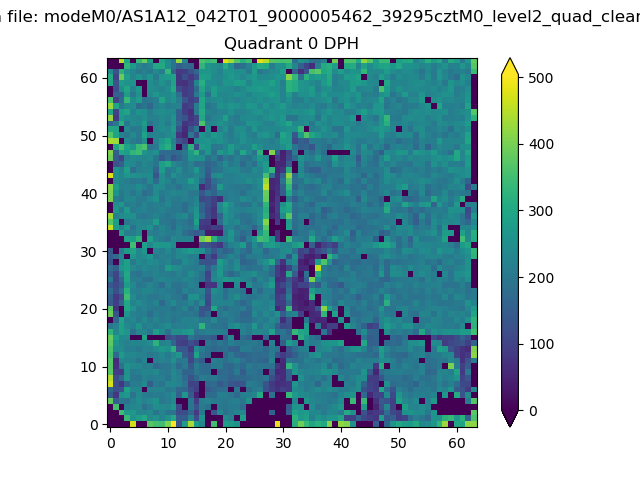 |
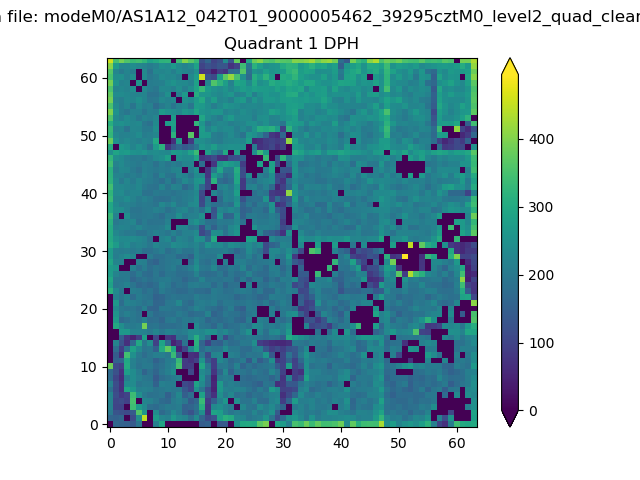 |
Quadrant B |
|---|---|---|---|
| Quadrant D | 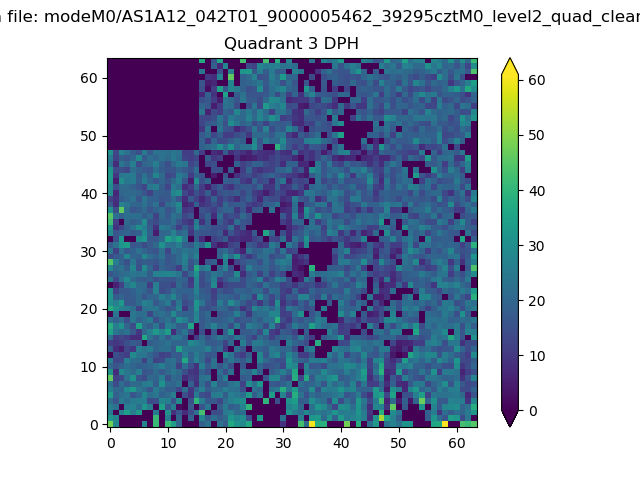 |
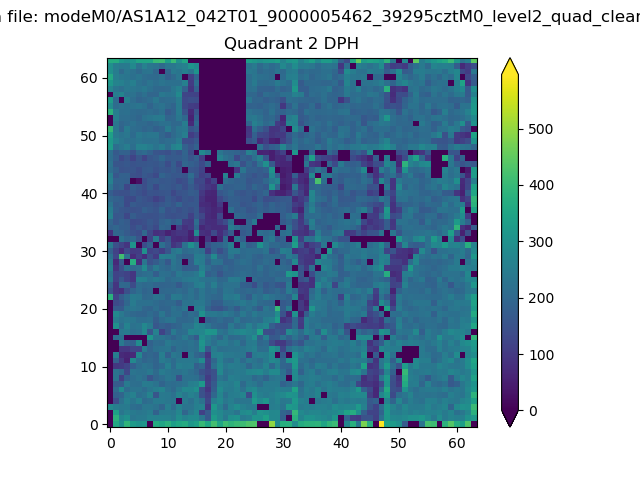 |
Quadrant C |
| Plot type | Count rate plots | Images |
|---|---|---|
| Comparison with Poisson distribution Blue bars denote a histogram of data divided into 1 sec bins. Red curve is a Poisson curve with rate = median count rate of data. |
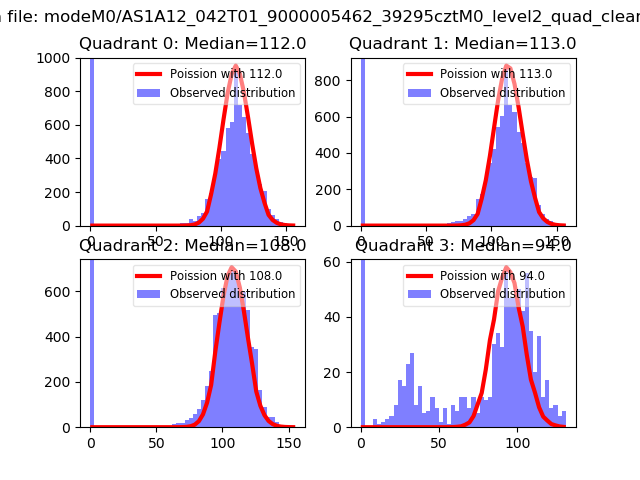 |
 |
| Quadrant-wise count rates Data is divided into 100 sec bins |
 |
|
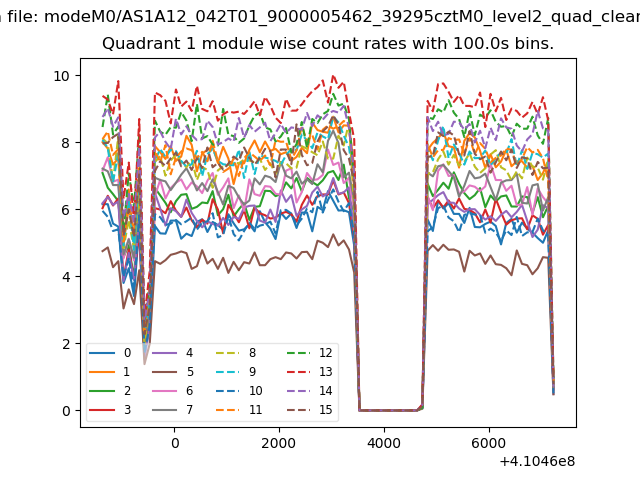
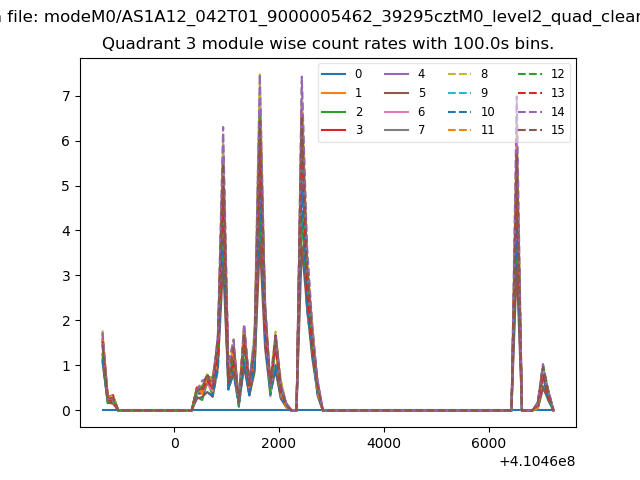
| Module-wise count rates for Quadrant A Data is divided into 100 sec bins |
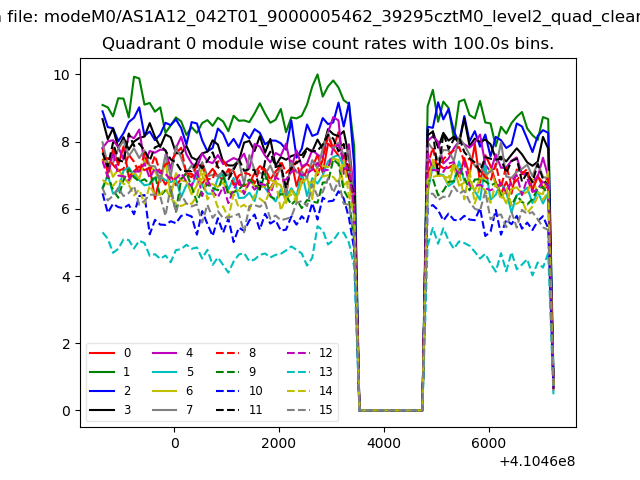 |
 |
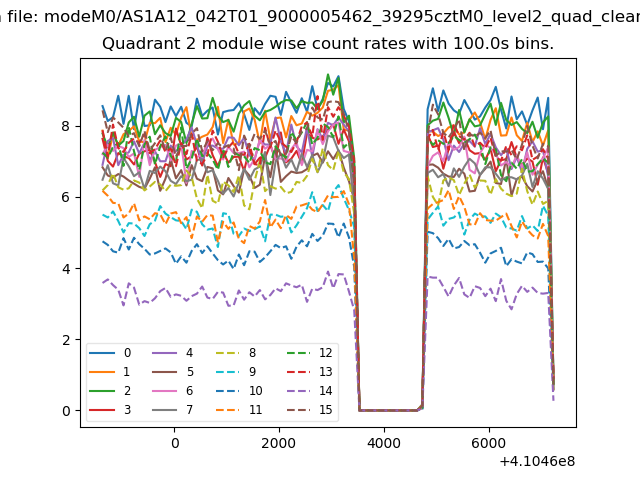
| Module-wise count rates for Quadrant B Data is divided into 100 sec bins |
 |
 |
| Module-wise count rates for Quadrant C Data is divided into 100 sec bins |
 |
 |
| Module-wise count rates for Quadrant D Data is divided into 100 sec bins |
 |
 |
| Parameter | Plot |
|---|---|
| CZT HV Monitor | 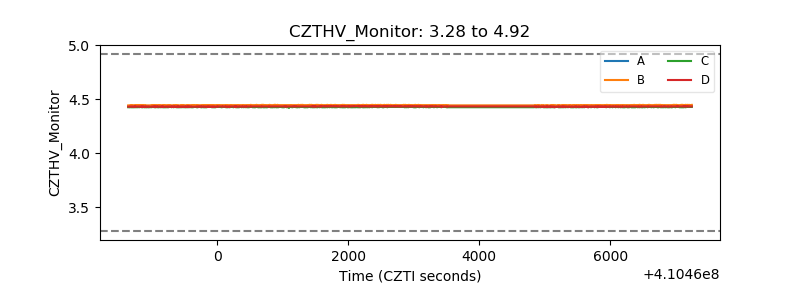 |
| D_VDD | 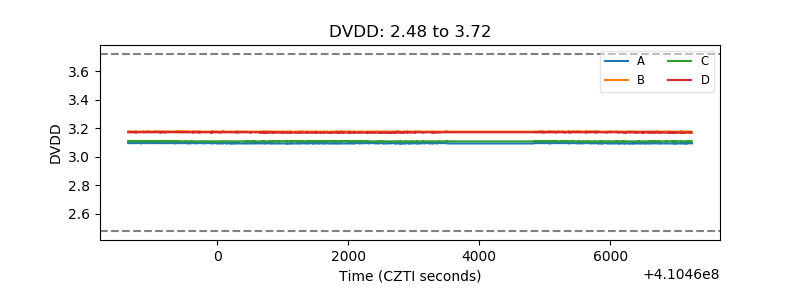 |
| Temperature 1 | 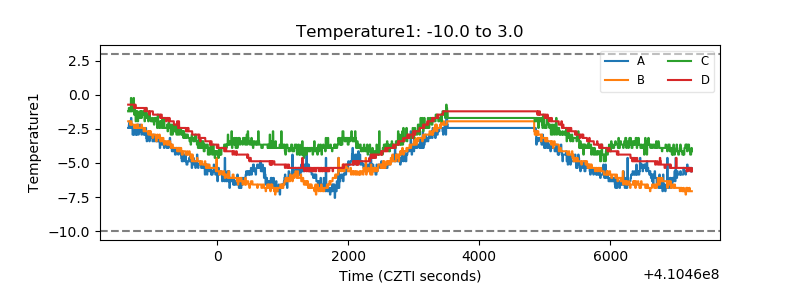 |
| Veto HV Monitor |  |
| Veto LLD | 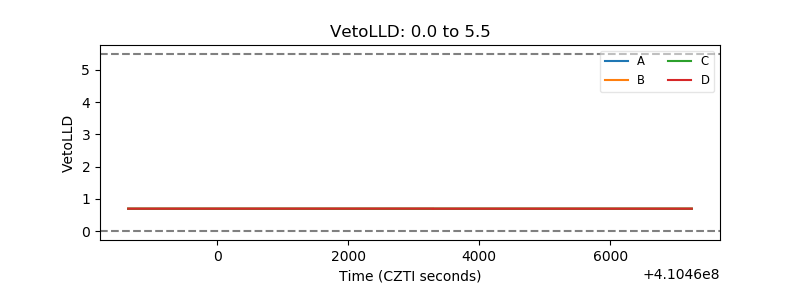 |
| Alpha Counter |  |
| _CPM_Rate | 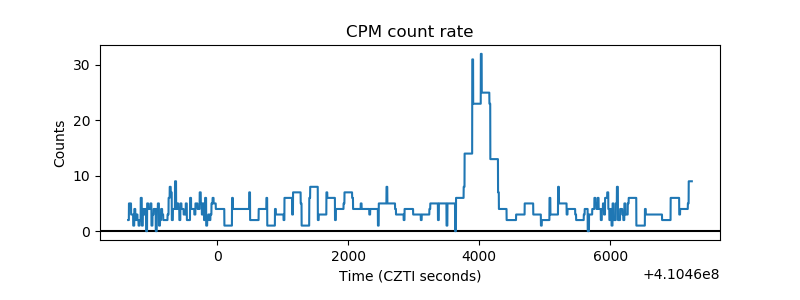 |
| CZT Counter | 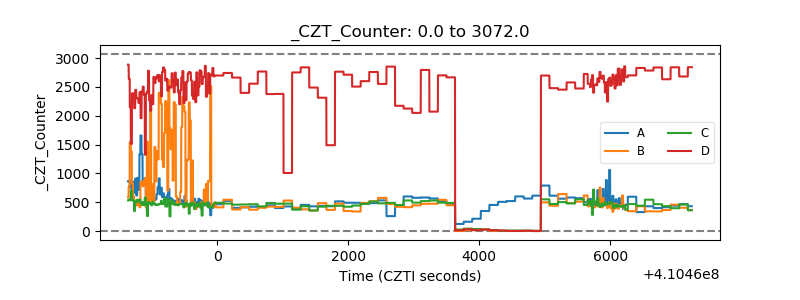 |
| +2.5 Volts monitor | 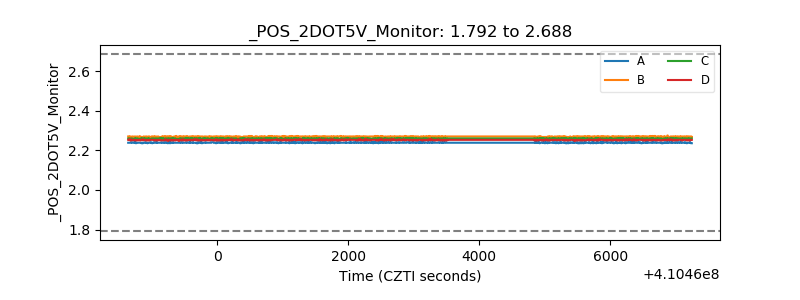 |
| +5 Volts monitor | 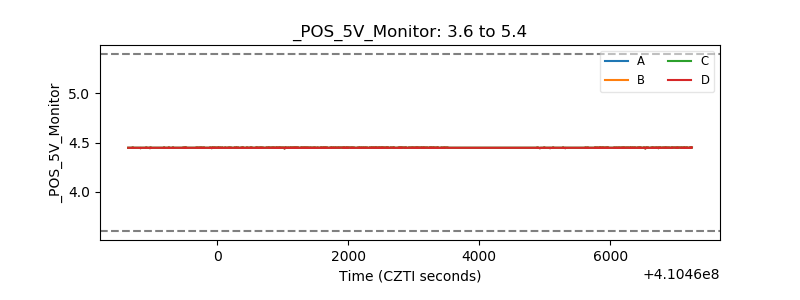 |
| _ROLL_ROT | 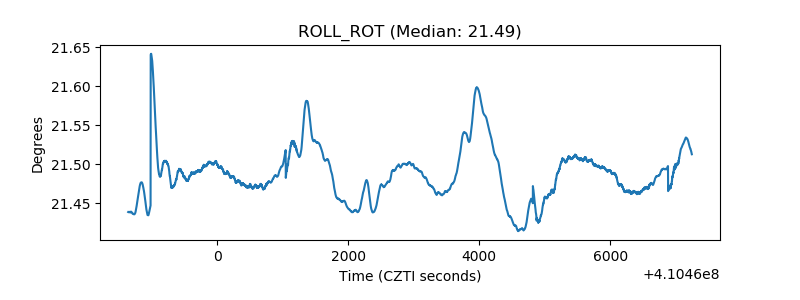 |
| _Roll_DEC | 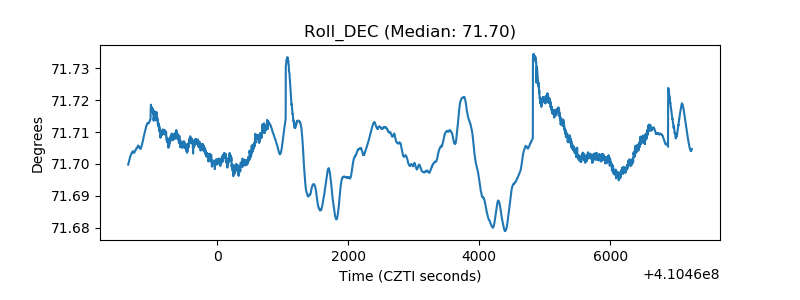 |
| _Roll_RA | 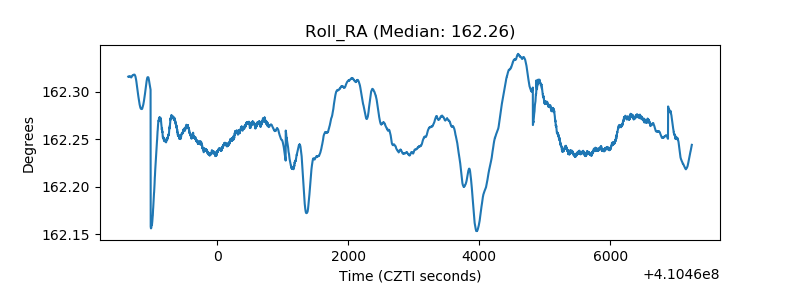 |
| Veto Counter | 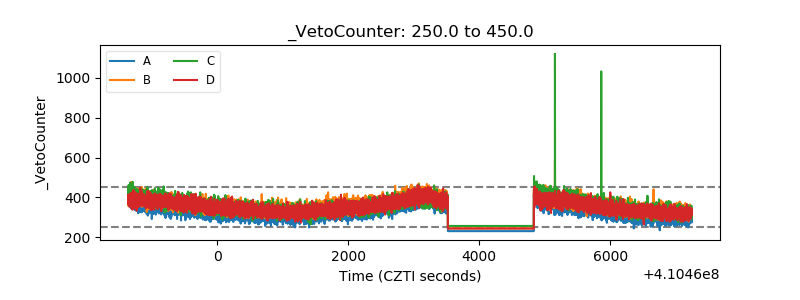 |