| Param | Original file | Final file |
|---|---|---|
| Filename | modeM0/AS1A12_042T01_9000005462_39296cztM0_level2.fits | modeM0/AS1A12_042T01_9000005462_39296cztM0_level2_quad_clean.evt |
| Size (bytes) | 1,013,495,040 | 126,685,440 |
| Size | 966.5 MB | 120.8 MB |
| Events in quadrant A | 4,840,474 | 1,032,244 |
| Events in quadrant B | 4,326,159 | 1,050,080 |
| Events in quadrant C | 4,301,506 | 1,005,880 |
| Events in quadrant D | 23,326,379 | 102,443 |
| Mode SS | |||
|---|---|---|---|
| Quadrant | BADHDUFLAG | Total packets | Discarded packets |
| A | 0 | 190 | 0 |
| B | 0 | 190 | 0 |
| C | 0 | 190 | 0 |
| D | 0 | 190 | 0 |
| Mode M0 | |||
|---|---|---|---|
| Quadrant | BADHDUFLAG | Total packets | Discarded packets |
| A | 0 | 20550 | 3 |
| B | 0 | 19607 | 2 |
| C | 0 | 18950 | 2 |
| D | 0 | 75717 | 2 |
| Mode M9 | |||
|---|---|---|---|
| Quadrant | BADHDUFLAG | Total packets | Discarded packets |
| A | 0 | 29 | 0 |
| B | 0 | 29 | 0 |
| C | 0 | 29 | 0 |
| D | 0 | 29 | 0 |
| Quadrant | Total seconds | Saturated seconds | Saturation percentage |
|---|---|---|---|
| A | 9297 | 38 | 0.408734% |
| B | 9297 | 59 | 0.634613% |
| C | 9297 | 6 | 0.064537% |
| D | 9297 | 8471 | 91.115414% |
Noise dominated data is calculated using 1-second bins in cleaned event files. If a bin has >2000 counts, and if more than 50% of those come from <1% of pixels, then it is considered to be noise-dominated and hence unusable.
| Quadrant | # 1 sec bins | Bins with >0 counts | Bins with >2000 counts | High rate bins dominated by noise | Noise dominated (total time) | Noise dominated (detector-on time) | Marked lightcurve |
|---|---|---|---|---|---|---|---|
| A | 12223 | 9299 | 21 | 21 | 0.17% | 0.23% | 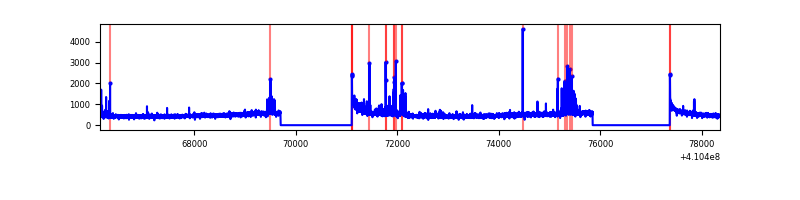 |
| B | 12223 | 9299 | 35 | 35 | 0.29% | 0.38% | 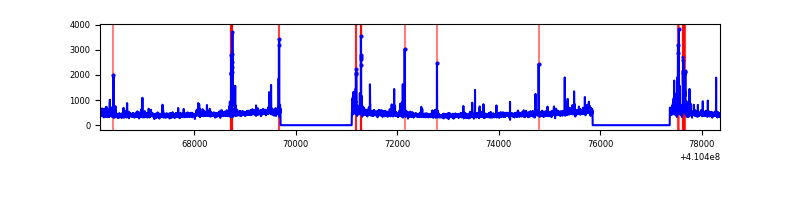 |
| C | 12223 | 9299 | 2 | 2 | 0.02% | 0.02% | 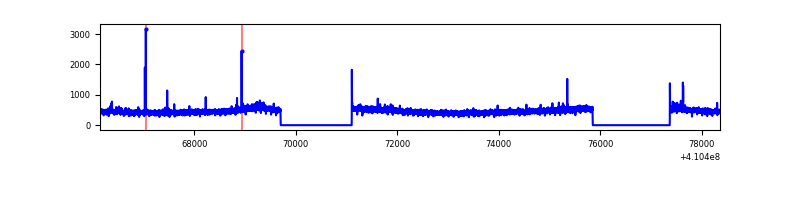 |
| D | 12223 | 9298 | 7223 | 7223 | 59.09% | 77.68% | 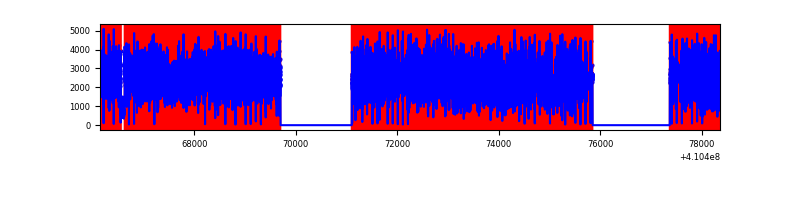 |
Top three noisy pixels from each quadrant. If the there are fewer than three noisy pixels in the level2.evt file, extra rows are filled as -1
| Pixel properties | Quadrant properties | ||||||
|---|---|---|---|---|---|---|---|
| Quadrant | DetID | PixID | Counts | Sigma | Mean | Median | Sigma |
| A | 10 | 83 | 616134 | 3015.87 | 1008 | 989 | 204.0 |
| A | 13 | 248 | 194007 | 946.31 | 1008 | 989 | 204.0 |
| A | 15 | 222 | 130088 | 632.93 | 1008 | 989 | 204.0 |
| B | 5 | 172 | 199592 | 1036.84 | 1004 | 977 | 191.6 |
| B | 5 | 255 | 114539 | 592.83 | 1004 | 977 | 191.6 |
| B | 12 | 111 | 24554 | 123.08 | 1004 | 977 | 191.6 |
| C | 15 | 214 | 384059 | 1687.53 | 981 | 983 | 227.0 |
| C | 9 | 187 | 66305 | 287.76 | 981 | 983 | 227.0 |
| C | 6 | 255 | 7734 | 29.74 | 981 | 983 | 227.0 |
| D | 12 | 235 | 20978795 | 193745.35 | 446 | 433 | 108.3 |
| D | 13 | 249 | 216332 | 1993.93 | 446 | 433 | 108.3 |
| D | 12 | 227 | 199279 | 1836.44 | 446 | 433 | 108.3 |
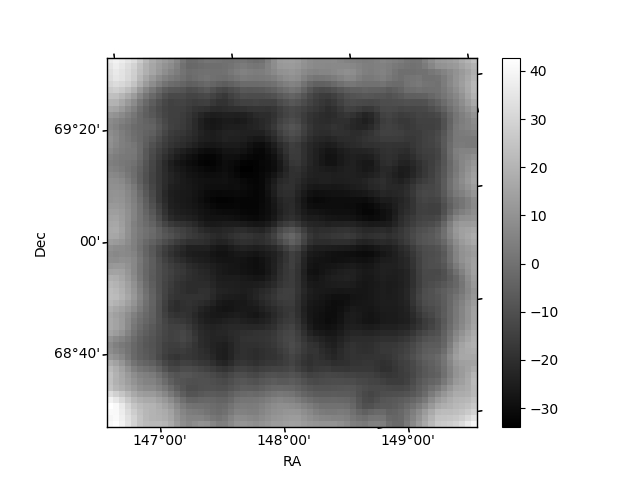
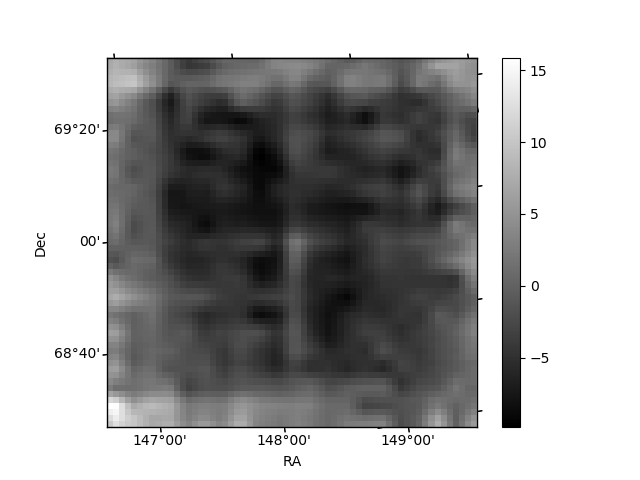
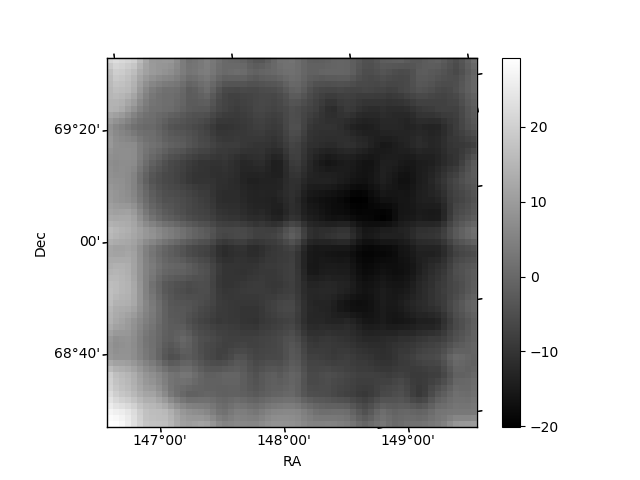
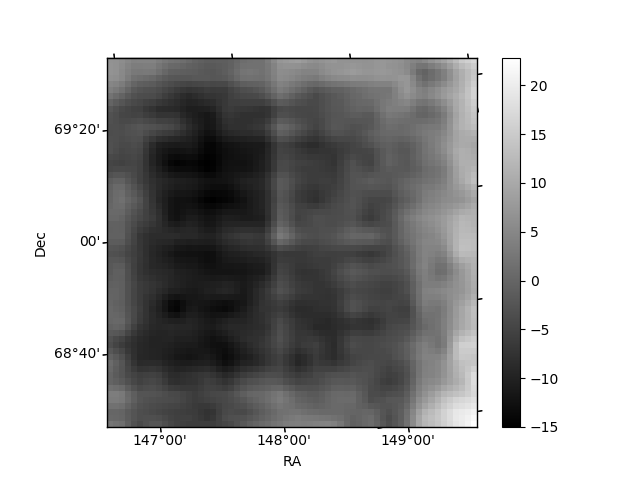
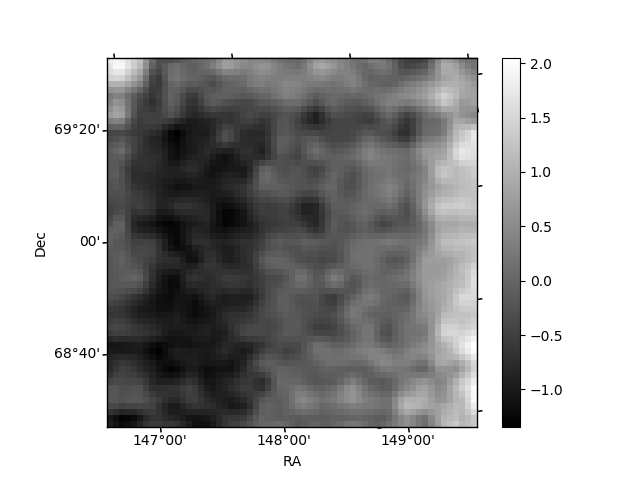
Histogram calculated using DETX and DETY for each event in the final _common_clean file
| Quadrant A | 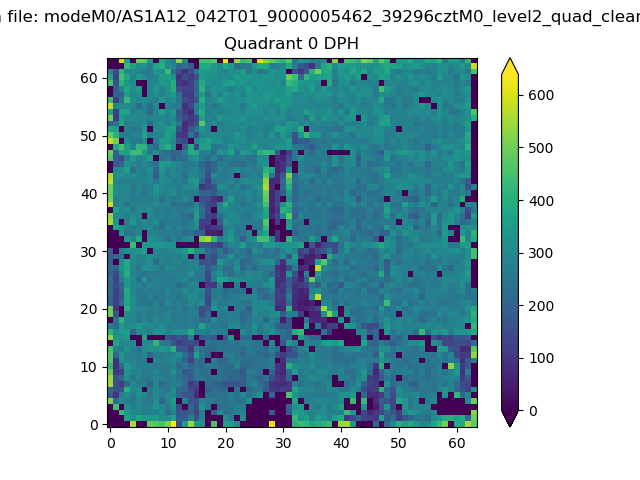 |
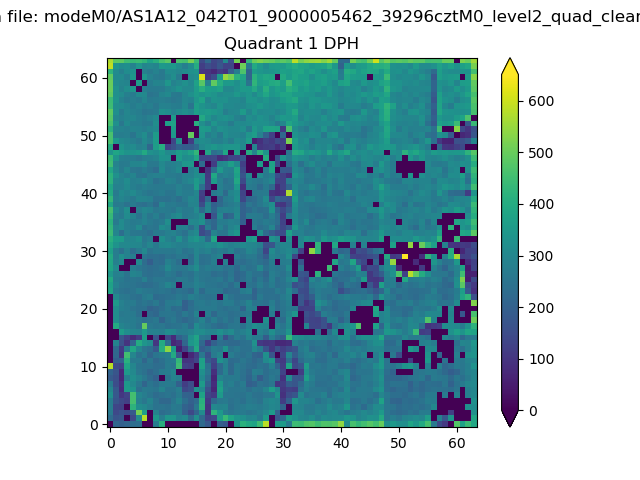 |
Quadrant B |
|---|---|---|---|
| Quadrant D | 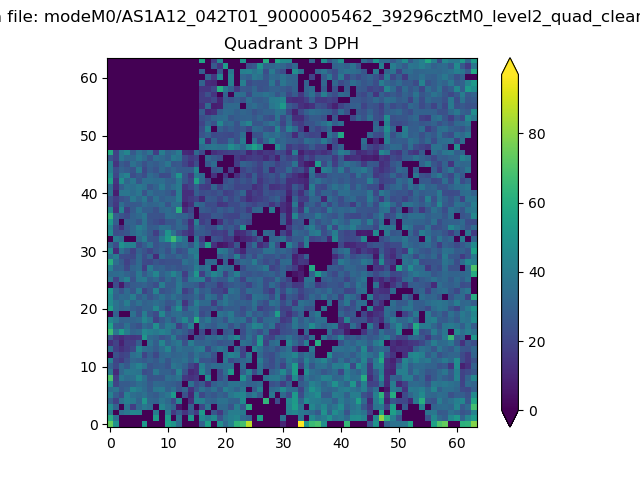 |
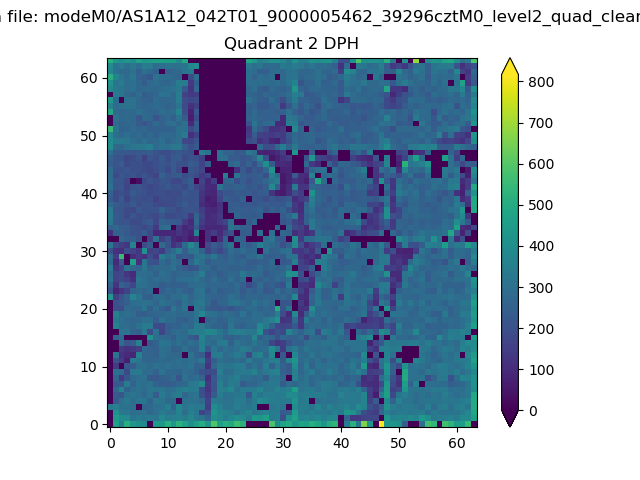 |
Quadrant C |
| Plot type | Count rate plots | Images |
|---|---|---|
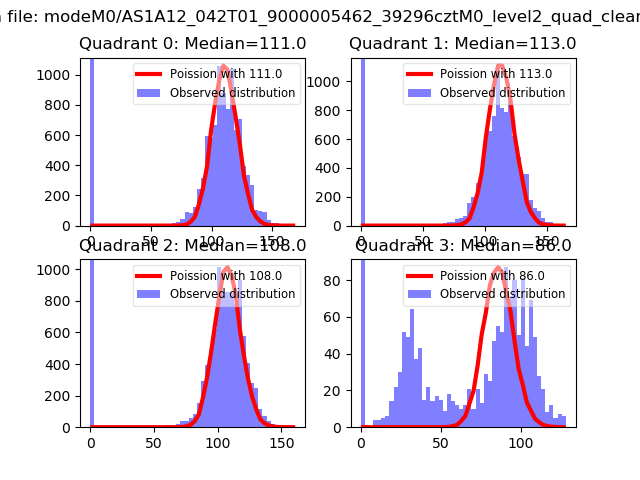
| Comparison with Poisson distribution Blue bars denote a histogram of data divided into 1 sec bins. Red curve is a Poisson curve with rate = median count rate of data. |
 |
 |
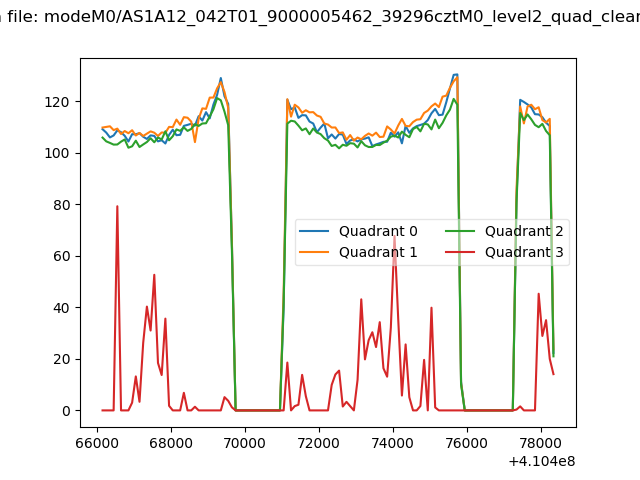
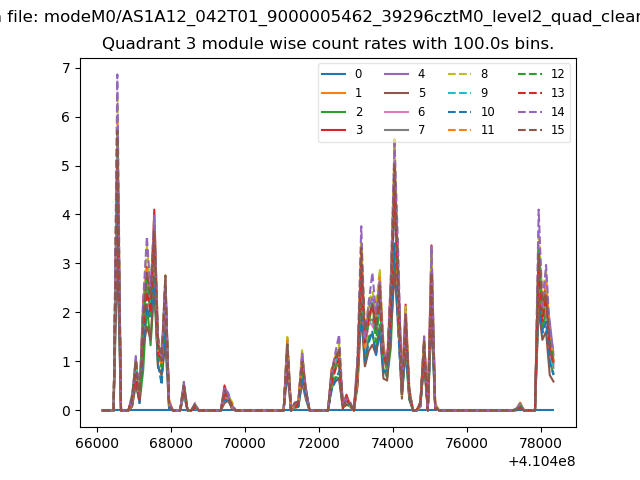
| Quadrant-wise count rates Data is divided into 100 sec bins |
 |
|
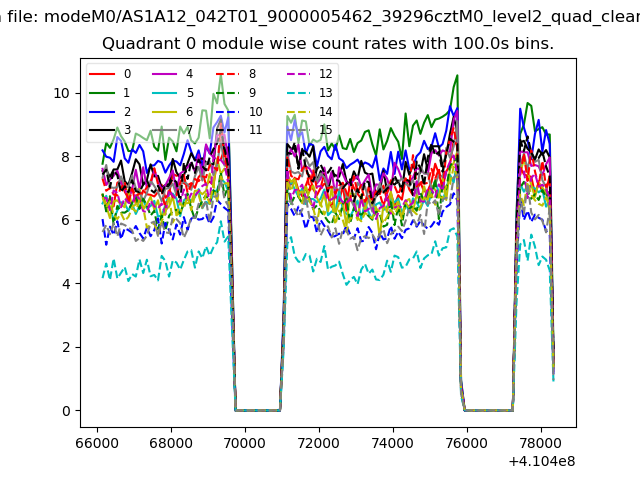
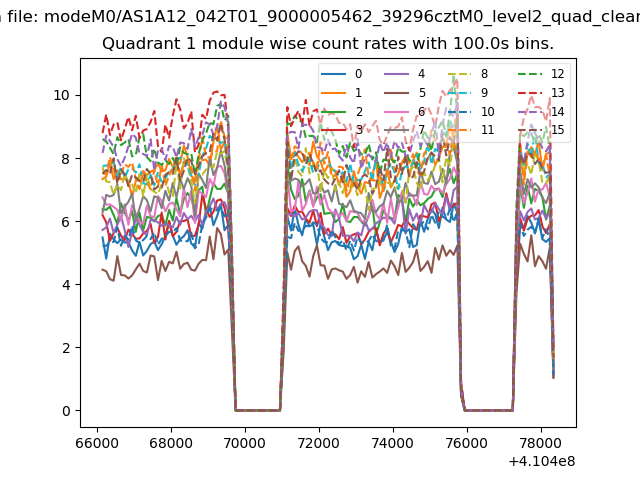
| Module-wise count rates for Quadrant A Data is divided into 100 sec bins |
 |
 |
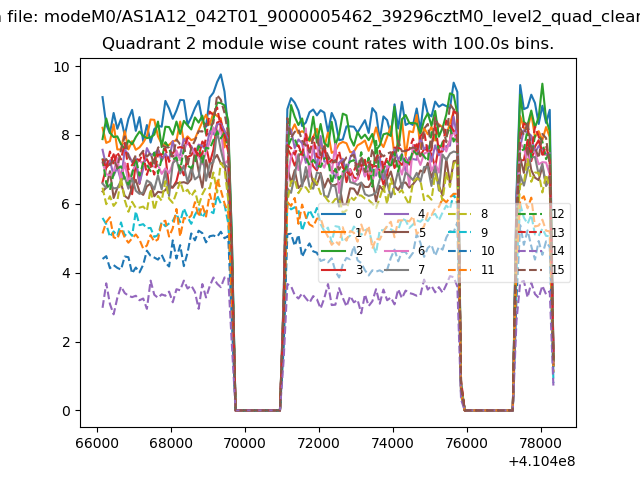
| Module-wise count rates for Quadrant B Data is divided into 100 sec bins |
 |
 |
| Module-wise count rates for Quadrant C Data is divided into 100 sec bins |
 |
 |
| Module-wise count rates for Quadrant D Data is divided into 100 sec bins |
 |
 |
| Parameter | Plot |
|---|---|
| CZT HV Monitor |  |
| D_VDD | 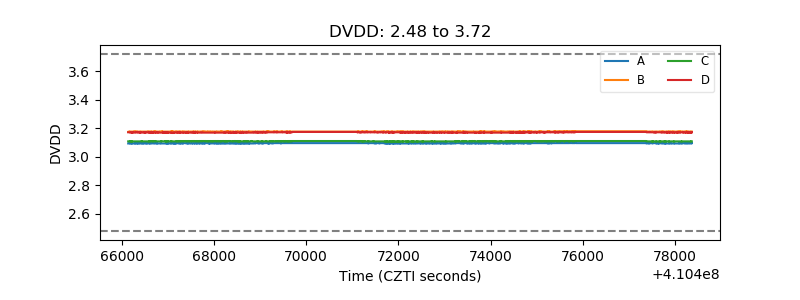 |
| Temperature 1 | 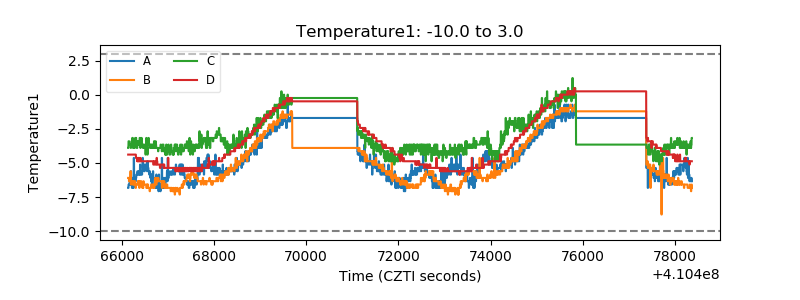 |
| Veto HV Monitor | 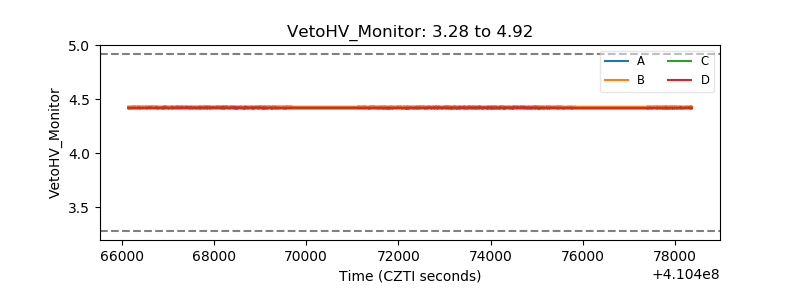 |
| Veto LLD | 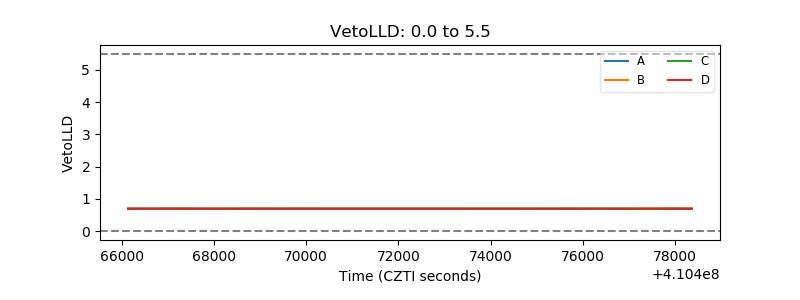 |
| Alpha Counter | 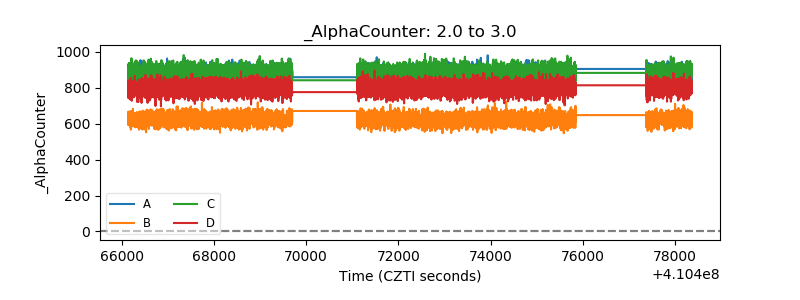 |
| _CPM_Rate | 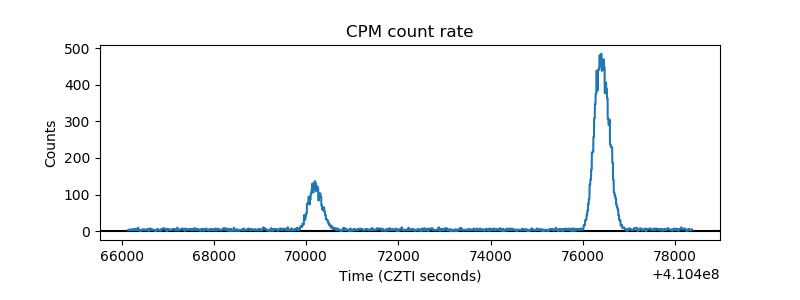 |
| CZT Counter | 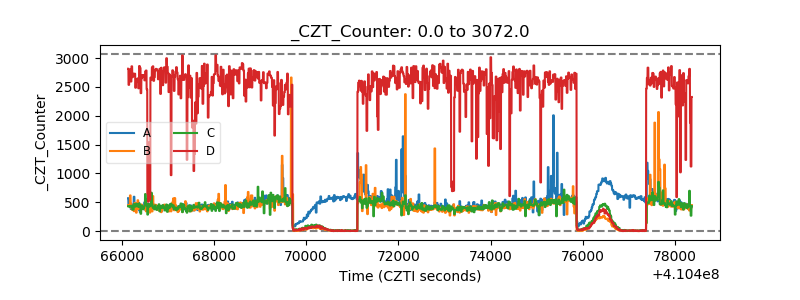 |
| +2.5 Volts monitor | 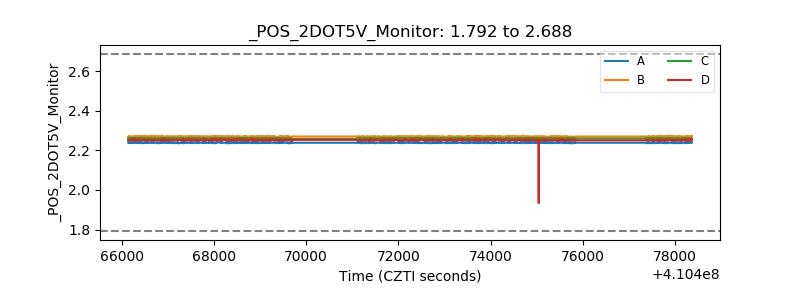 |
| +5 Volts monitor |  |
| _ROLL_ROT | 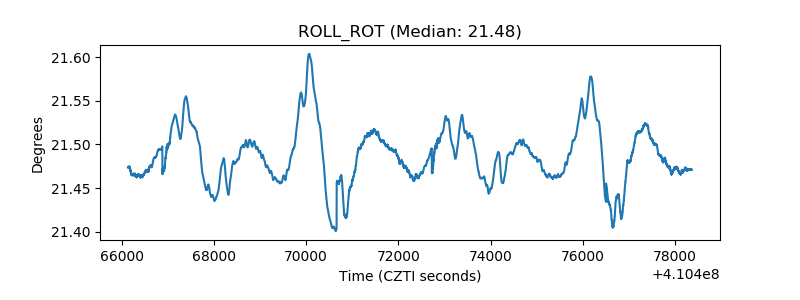 |
| _Roll_DEC | 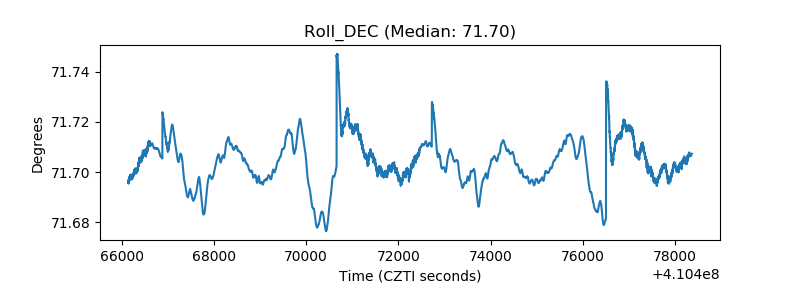 |
| _Roll_RA | 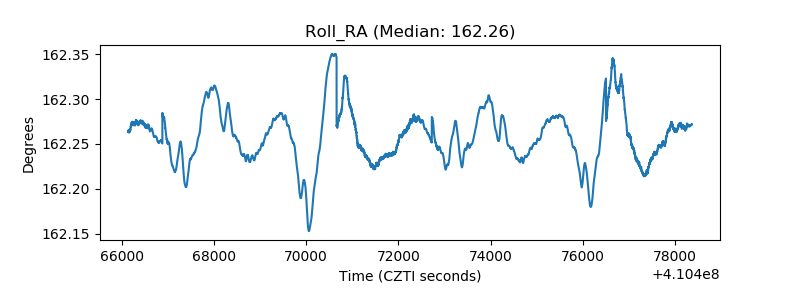 |
| Veto Counter | 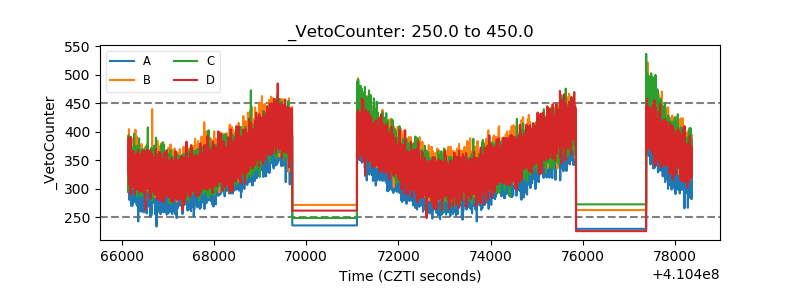 |