| Param | Original file | Final file |
|---|---|---|
| Filename | modeM0/AS1A12_042T01_9000005462_39297cztM0_level2.fits | modeM0/AS1A12_042T01_9000005462_39297cztM0_level2_quad_clean.evt |
| Size (bytes) | 606,876,480 | 76,152,960 |
| Size | 578.8 MB | 72.6 MB |
| Events in quadrant A | 3,401,065 | 599,122 |
| Events in quadrant B | 2,645,751 | 621,121 |
| Events in quadrant C | 2,748,269 | 593,151 |
| Events in quadrant D | 13,245,251 | 110,927 |
| Mode SS | |||
|---|---|---|---|
| Quadrant | BADHDUFLAG | Total packets | Discarded packets |
| A | 0 | 110 | 0 |
| B | 0 | 110 | 0 |
| C | 0 | 110 | 0 |
| D | 0 | 110 | 0 |
| Mode M0 | |||
|---|---|---|---|
| Quadrant | BADHDUFLAG | Total packets | Discarded packets |
| A | 0 | 13817 | 3 |
| B | 0 | 11849 | 2 |
| C | 0 | 11740 | 2 |
| D | 0 | 43095 | 2 |
| Mode M9 | |||
|---|---|---|---|
| Quadrant | BADHDUFLAG | Total packets | Discarded packets |
| A | 0 | 20 | 0 |
| B | 0 | 20 | 0 |
| C | 0 | 20 | 0 |
| D | 0 | 21 | 0 |
| Quadrant | Total seconds | Saturated seconds | Saturation percentage |
|---|---|---|---|
| A | 5450 | 185 | 3.394495% |
| B | 5450 | 76 | 1.394495% |
| C | 5450 | 50 | 0.917431% |
| D | 5450 | 4575 | 83.944954% |
Noise dominated data is calculated using 1-second bins in cleaned event files. If a bin has >2000 counts, and if more than 50% of those come from <1% of pixels, then it is considered to be noise-dominated and hence unusable.
| Quadrant | # 1 sec bins | Bins with >0 counts | Bins with >2000 counts | High rate bins dominated by noise | Noise dominated (total time) | Noise dominated (detector-on time) | Marked lightcurve |
|---|---|---|---|---|---|---|---|
| A | 7121 | 5451 | 135 | 135 | 1.90% | 2.48% | 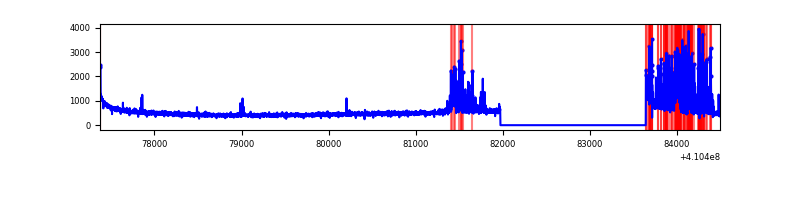 |
| B | 7121 | 5451 | 44 | 44 | 0.62% | 0.81% | 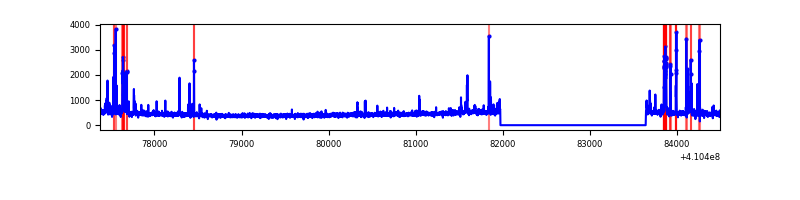 |
| C | 7121 | 5451 | 47 | 47 | 0.66% | 0.86% | 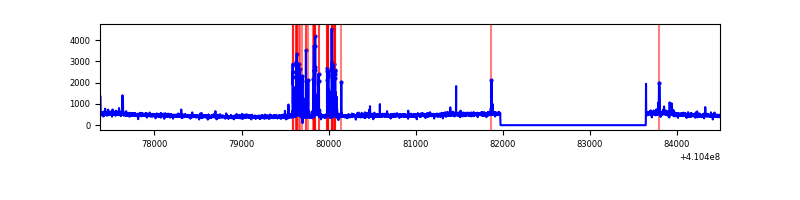 |
| D | 7121 | 5450 | 4028 | 4028 | 56.57% | 73.91% | 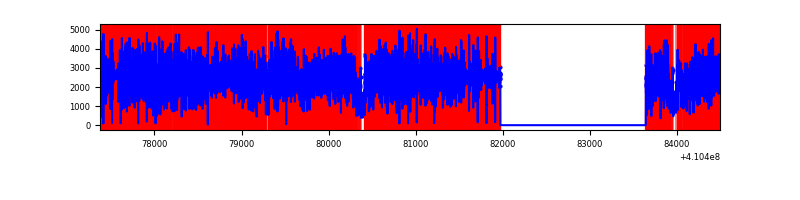 |
Top three noisy pixels from each quadrant. If the there are fewer than three noisy pixels in the level2.evt file, extra rows are filled as -1
| Pixel properties | Quadrant properties | ||||||
|---|---|---|---|---|---|---|---|
| Quadrant | DetID | PixID | Counts | Sigma | Mean | Median | Sigma |
| A | 13 | 248 | 709234 | 5946.27 | 586 | 574 | 119.2 |
| A | 10 | 83 | 424703 | 3558.81 | 586 | 574 | 119.2 |
| A | 13 | 254 | 6859 | 52.74 | 586 | 574 | 119.2 |
| B | 5 | 172 | 228401 | 2000.54 | 589 | 573 | 113.9 |
| B | 5 | 255 | 61542 | 535.36 | 589 | 573 | 113.9 |
| B | 5 | 184 | 16769 | 142.22 | 589 | 573 | 113.9 |
| C | 15 | 214 | 230423 | 1711.53 | 576 | 578 | 134.3 |
| C | 14 | 254 | 212930 | 1581.27 | 576 | 578 | 134.3 |
| C | 10 | 20 | 37410 | 274.27 | 576 | 578 | 134.3 |
| D | 12 | 235 | 11624460 | 153444.11 | 312 | 302 | 75.8 |
| D | 12 | 227 | 153483 | 2022.06 | 312 | 302 | 75.8 |
| D | 5 | 222 | 117657 | 1549.14 | 312 | 302 | 75.8 |
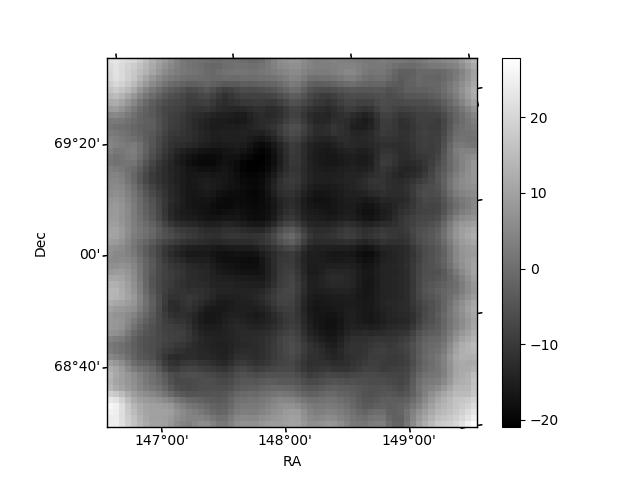
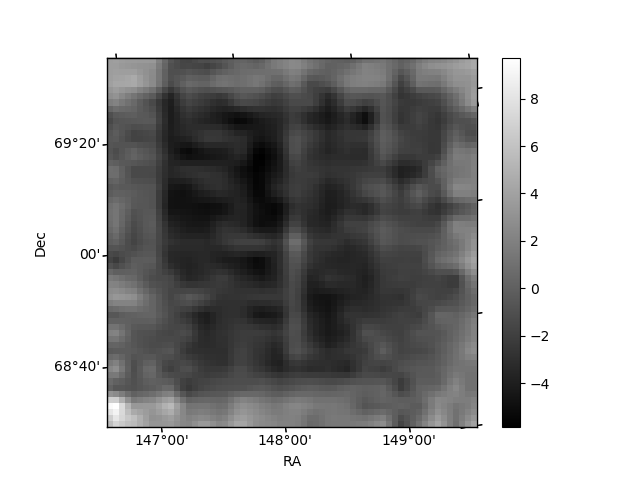
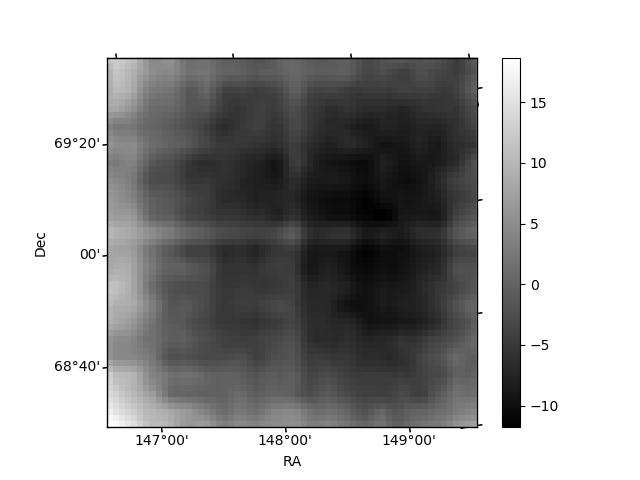
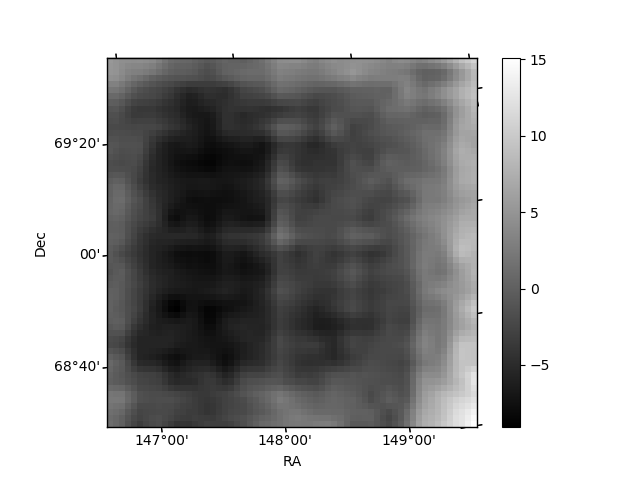
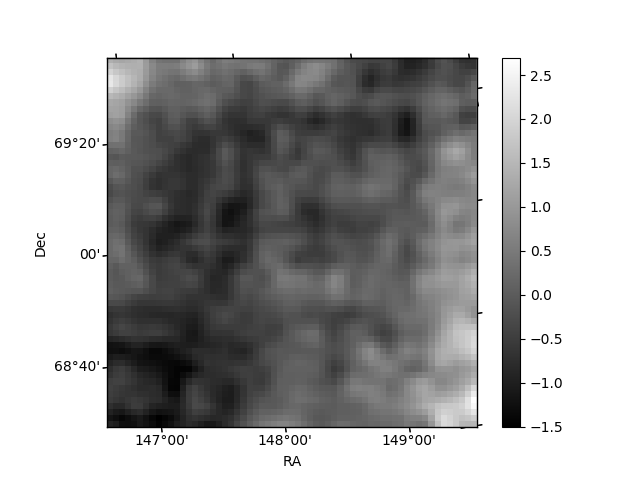
Histogram calculated using DETX and DETY for each event in the final _common_clean file
| Quadrant A | 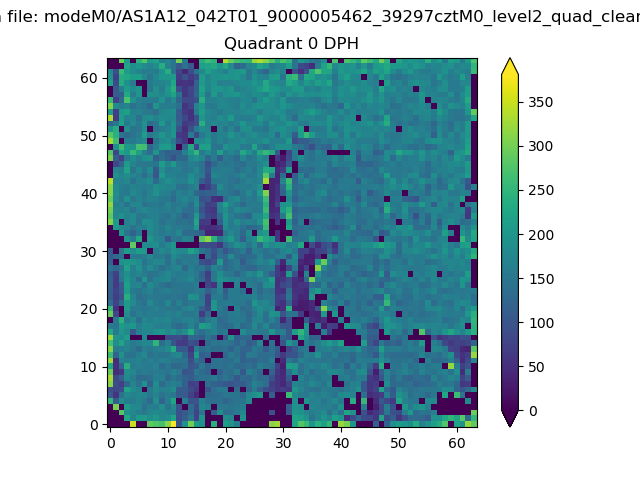 |
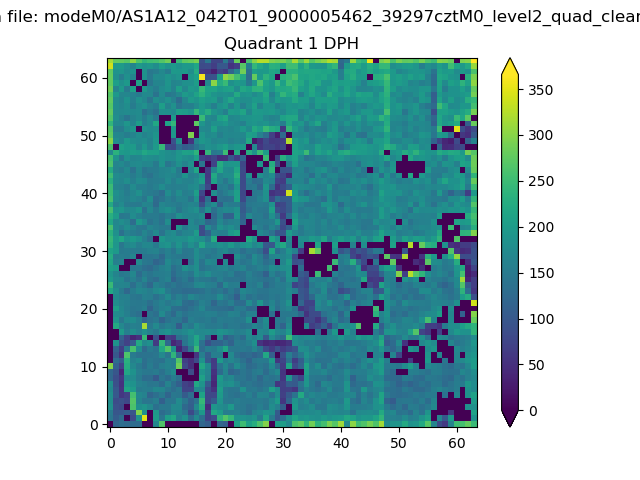 |
Quadrant B |
|---|---|---|---|
| Quadrant D | 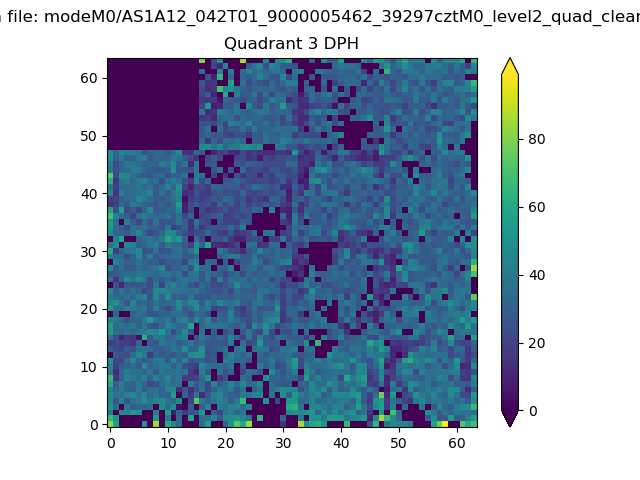 |
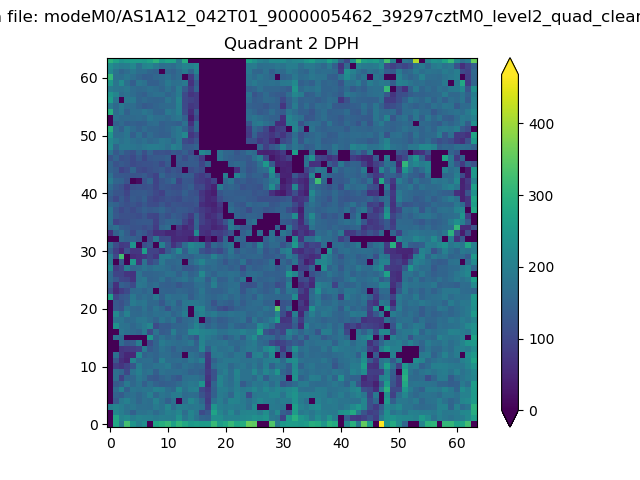 |
Quadrant C |
| Plot type | Count rate plots | Images |
|---|---|---|
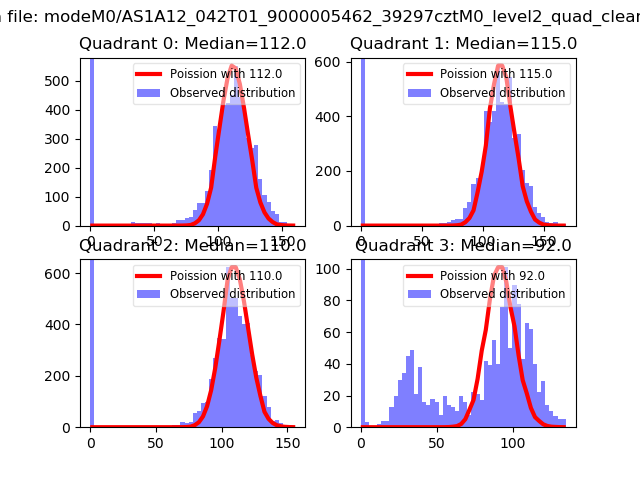
| Comparison with Poisson distribution Blue bars denote a histogram of data divided into 1 sec bins. Red curve is a Poisson curve with rate = median count rate of data. |
 |
 |
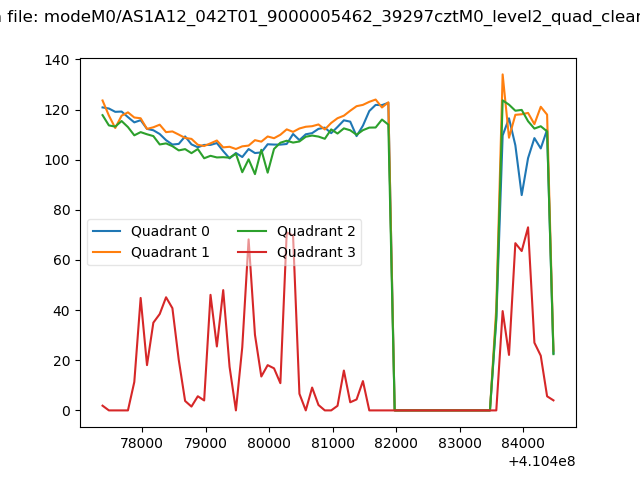
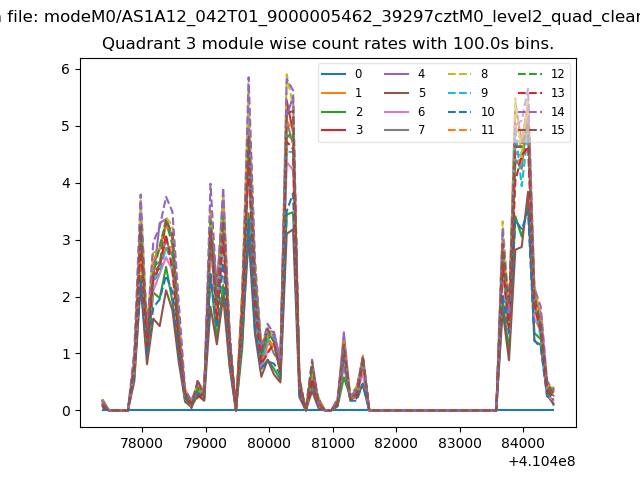
| Quadrant-wise count rates Data is divided into 100 sec bins |
 |
|
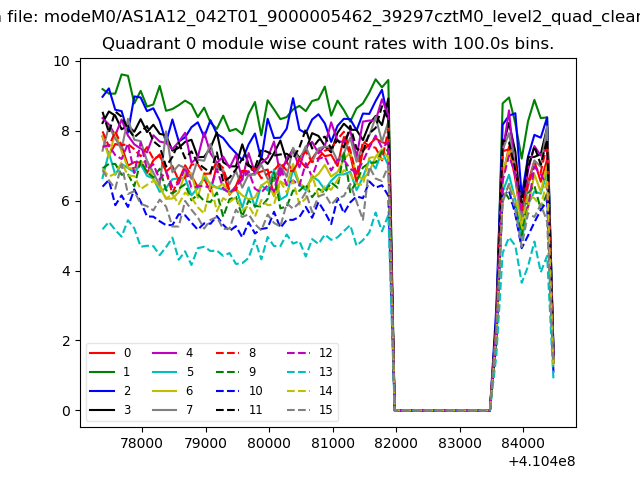
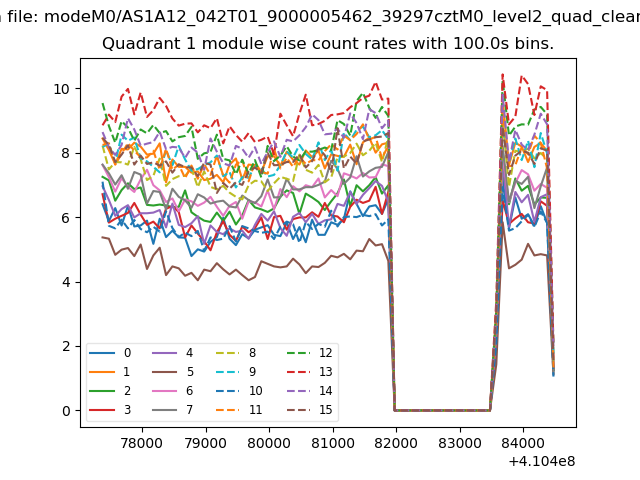
| Module-wise count rates for Quadrant A Data is divided into 100 sec bins |
 |
 |
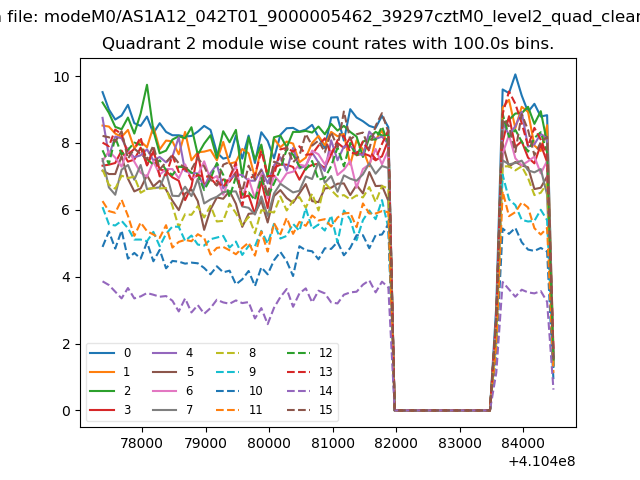
| Module-wise count rates for Quadrant B Data is divided into 100 sec bins |
 |
 |
| Module-wise count rates for Quadrant C Data is divided into 100 sec bins |
 |
 |
| Module-wise count rates for Quadrant D Data is divided into 100 sec bins |
 |
 |
| Parameter | Plot |
|---|---|
| CZT HV Monitor | 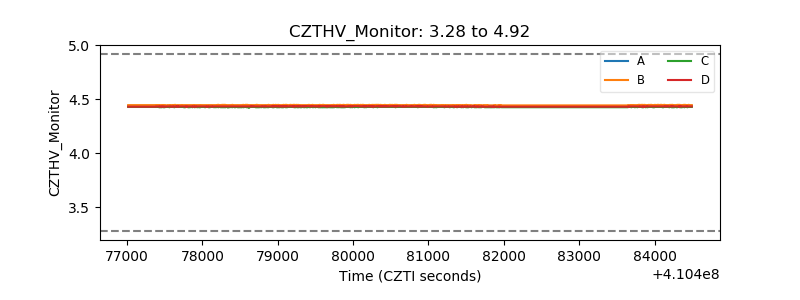 |
| D_VDD | 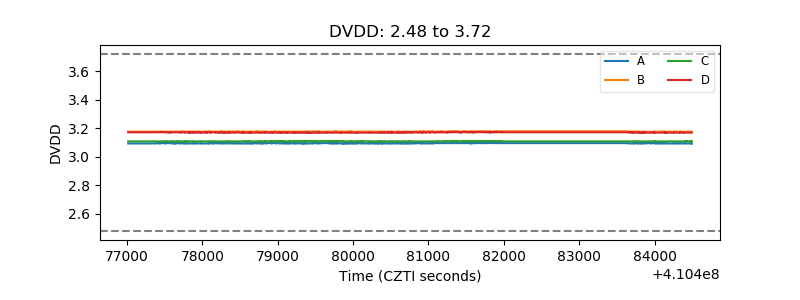 |
| Temperature 1 | 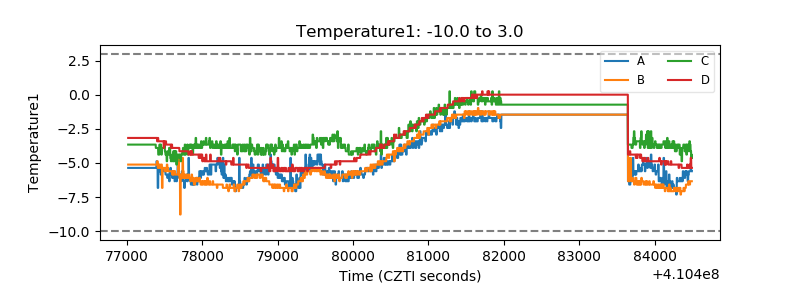 |
| Veto HV Monitor | 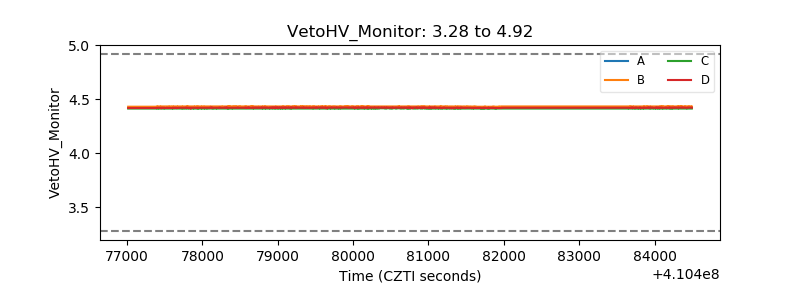 |
| Veto LLD | 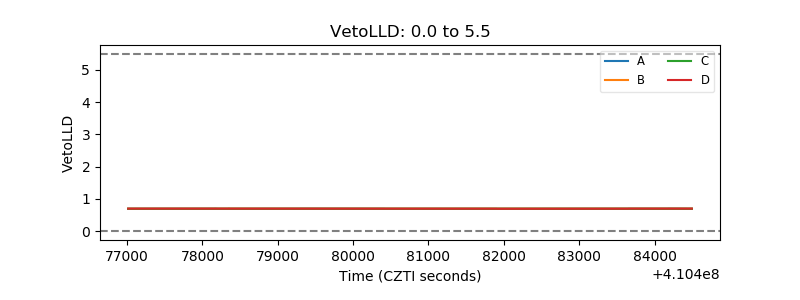 |
| Alpha Counter |  |
| _CPM_Rate | 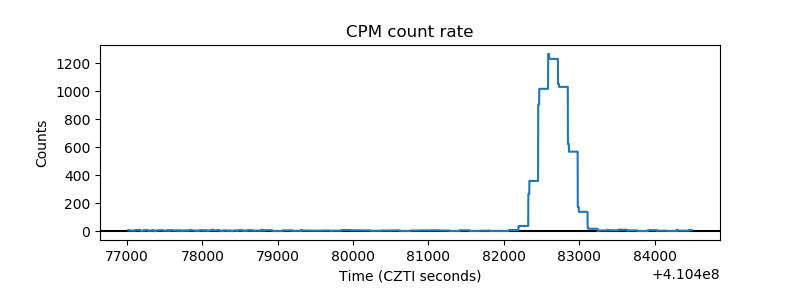 |
| CZT Counter | 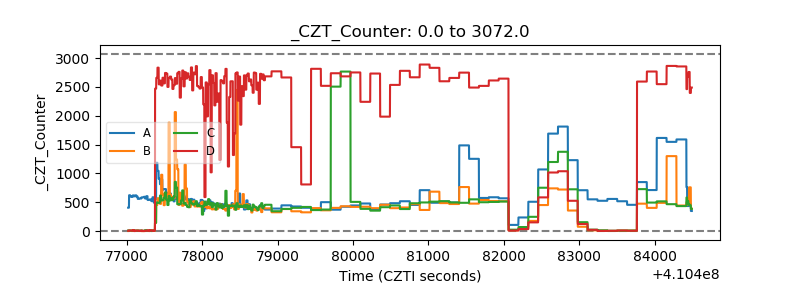 |
| +2.5 Volts monitor | 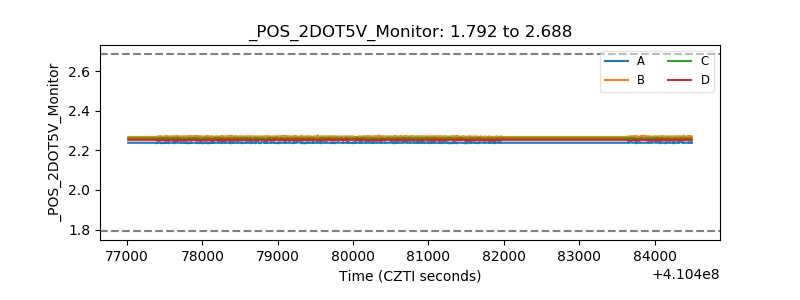 |
| +5 Volts monitor | 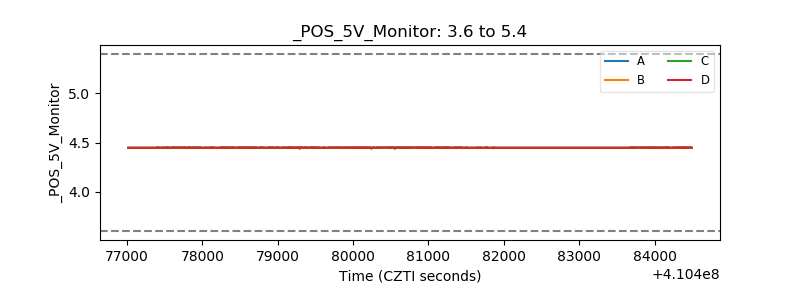 |
| _ROLL_ROT | 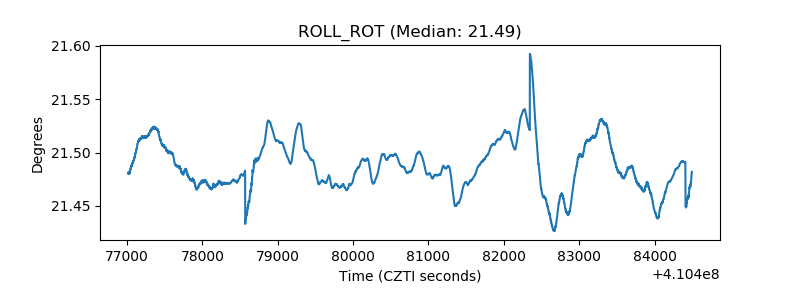 |
| _Roll_DEC | 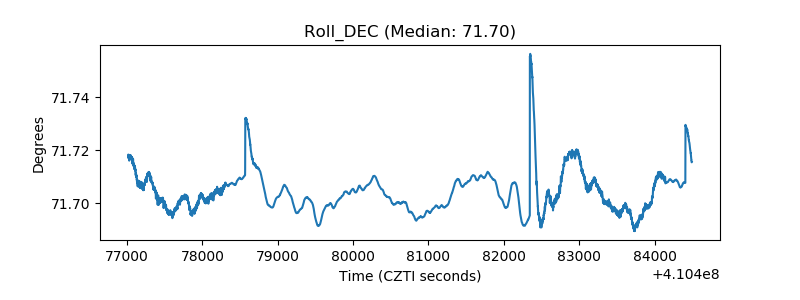 |
| _Roll_RA | 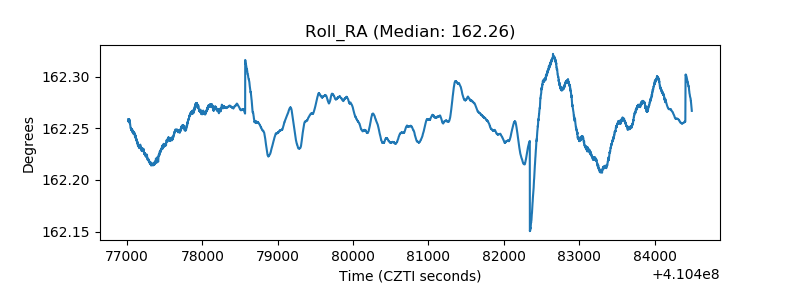 |
| Veto Counter | 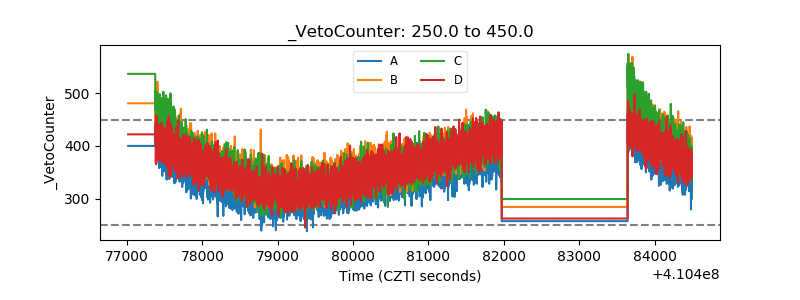 |