| Param | Original file | Final file |
|---|---|---|
| Filename | modeM0/AS1A12_042T01_9000005462_39299cztM0_level2.fits | modeM0/AS1A12_042T01_9000005462_39299cztM0_level2_quad_clean.evt |
| Size (bytes) | 648,120,960 | 80,593,920 |
| Size | 618.1 MB | 76.9 MB |
| Events in quadrant A | 3,956,663 | 629,296 |
| Events in quadrant B | 3,028,890 | 647,171 |
| Events in quadrant C | 3,231,165 | 625,832 |
| Events in quadrant D | 13,341,676 | 148,486 |
| Mode SS | |||
|---|---|---|---|
| Quadrant | BADHDUFLAG | Total packets | Discarded packets |
| A | 0 | 112 | 0 |
| B | 0 | 112 | 0 |
| C | 0 | 112 | 0 |
| D | 0 | 112 | 0 |
| Mode M0 | |||
|---|---|---|---|
| Quadrant | BADHDUFLAG | Total packets | Discarded packets |
| A | 0 | 15310 | 2 |
| B | 0 | 12918 | 1 |
| C | 0 | 13208 | 1 |
| D | 0 | 43495 | 1 |
| Mode M9 | |||
|---|---|---|---|
| Quadrant | BADHDUFLAG | Total packets | Discarded packets |
| A | 0 | 33 | 0 |
| B | 0 | 33 | 0 |
| C | 0 | 33 | 0 |
| D | 0 | 34 | 0 |
| Quadrant | Total seconds | Saturated seconds | Saturation percentage |
|---|---|---|---|
| A | 5572 | 286 | 5.132807% |
| B | 5572 | 207 | 3.715004% |
| C | 5572 | 58 | 1.040919% |
| D | 5572 | 4393 | 78.840632% |
Noise dominated data is calculated using 1-second bins in cleaned event files. If a bin has >2000 counts, and if more than 50% of those come from <1% of pixels, then it is considered to be noise-dominated and hence unusable.
| Quadrant | # 1 sec bins | Bins with >0 counts | Bins with >2000 counts | High rate bins dominated by noise | Noise dominated (total time) | Noise dominated (detector-on time) | Marked lightcurve |
|---|---|---|---|---|---|---|---|
| A | 7364 | 5573 | 246 | 246 | 3.34% | 4.41% | 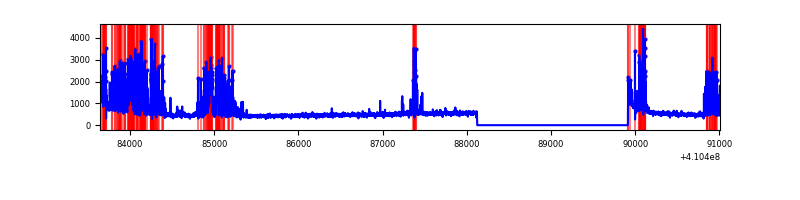 |
| B | 7364 | 5573 | 118 | 118 | 1.60% | 2.12% | 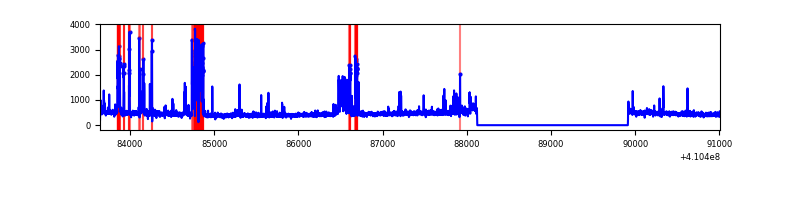 |
| C | 7364 | 5573 | 63 | 63 | 0.86% | 1.13% | 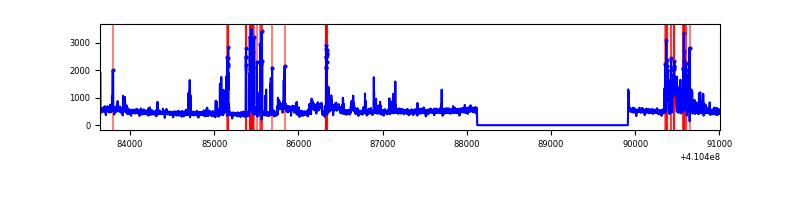 |
| D | 7364 | 5572 | 4111 | 4111 | 55.83% | 73.78% | 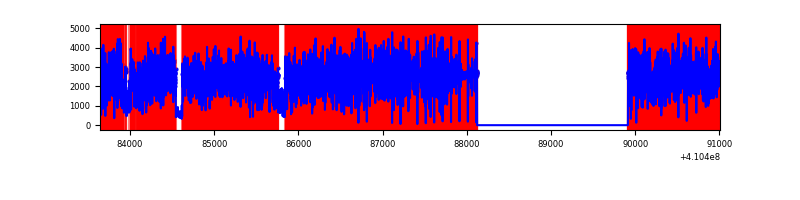 |
Top three noisy pixels from each quadrant. If the there are fewer than three noisy pixels in the level2.evt file, extra rows are filled as -1
| Pixel properties | Quadrant properties | ||||||
|---|---|---|---|---|---|---|---|
| Quadrant | DetID | PixID | Counts | Sigma | Mean | Median | Sigma |
| A | 13 | 248 | 1204459 | 9850.04 | 600 | 588 | 122.2 |
| A | 10 | 83 | 431433 | 3525.16 | 600 | 588 | 122.2 |
| A | 3 | 137 | 6416 | 47.68 | 600 | 588 | 122.2 |
| B | 5 | 172 | 504006 | 4397.44 | 600 | 583 | 114.5 |
| B | 5 | 255 | 88382 | 766.93 | 600 | 583 | 114.5 |
| B | 5 | 184 | 53370 | 461.1 | 600 | 583 | 114.5 |
| C | 14 | 254 | 534883 | 3923.43 | 590 | 592 | 136.2 |
| C | 15 | 214 | 232589 | 1703.61 | 590 | 592 | 136.2 |
| C | 3 | 233 | 140528 | 1027.58 | 590 | 592 | 136.2 |
| D | 12 | 235 | 11499499 | 136192.85 | 344 | 335 | 84.4 |
| D | 5 | 222 | 189408 | 2239.33 | 344 | 335 | 84.4 |
| D | 12 | 227 | 111620 | 1318.03 | 344 | 335 | 84.4 |
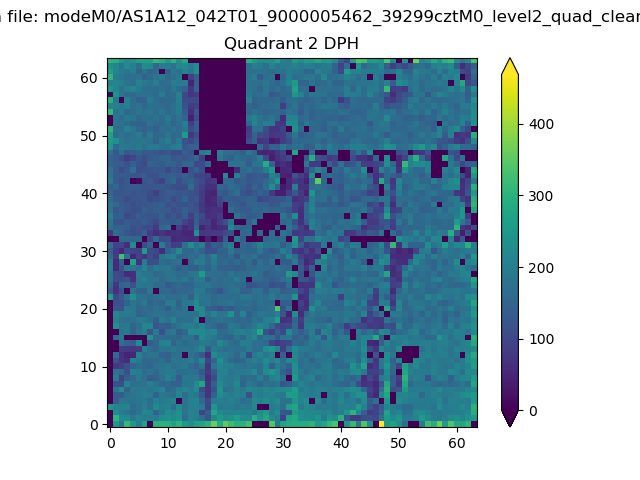
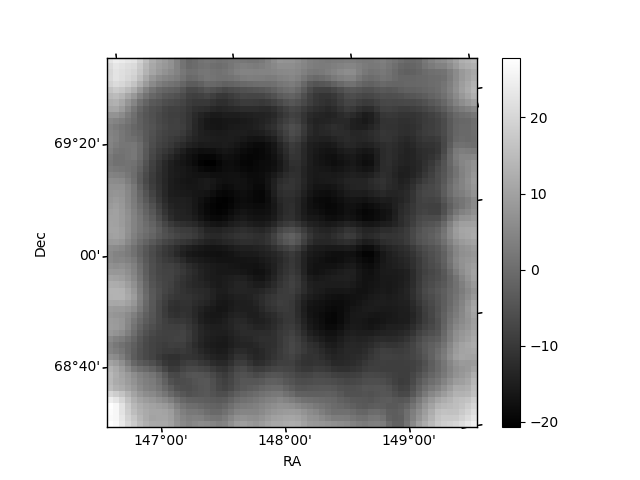
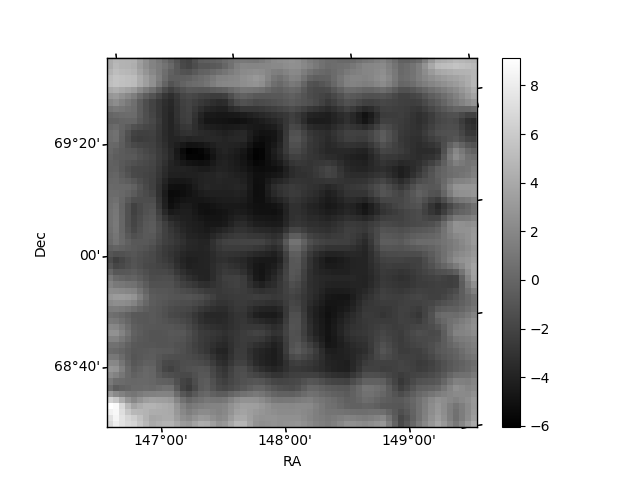
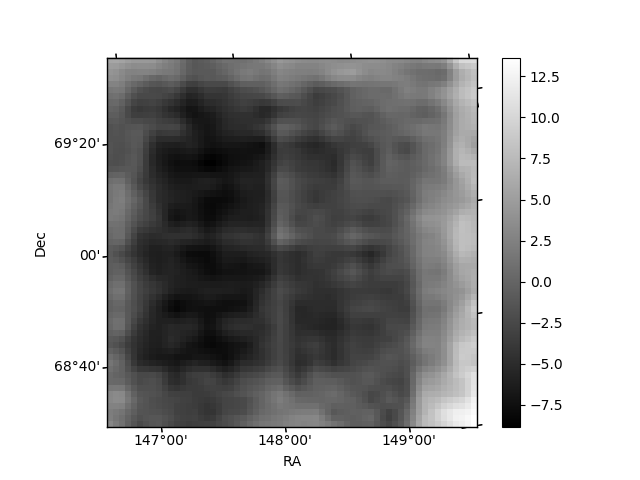
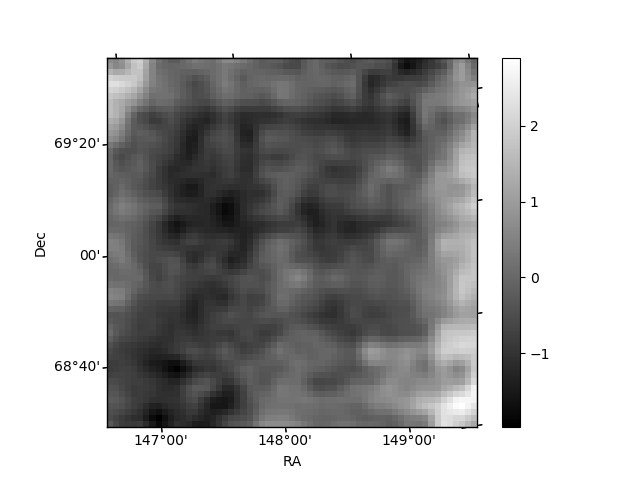
Histogram calculated using DETX and DETY for each event in the final _common_clean file
| Quadrant A | 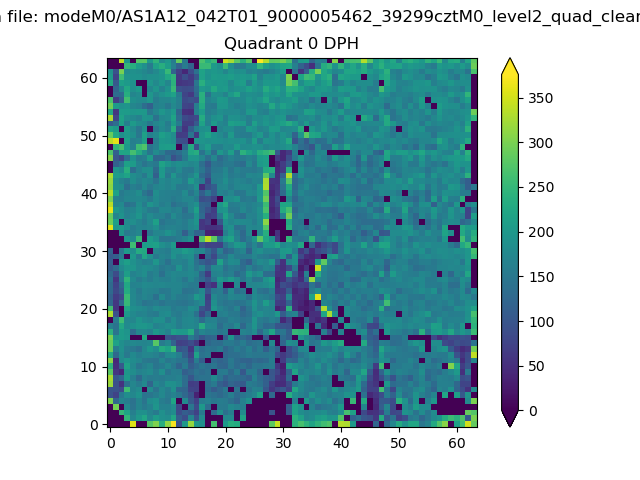 |
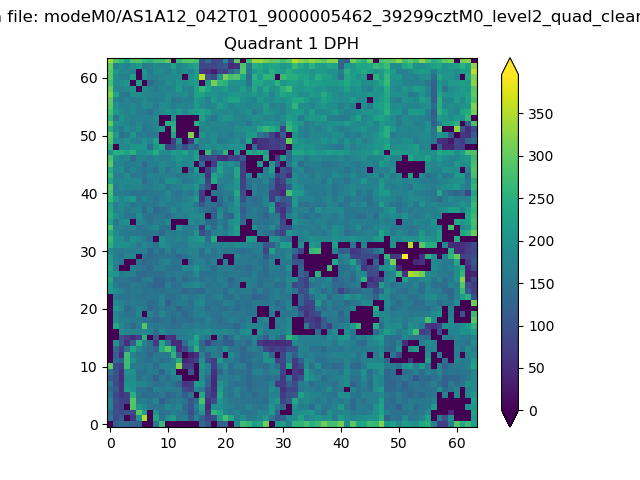 |
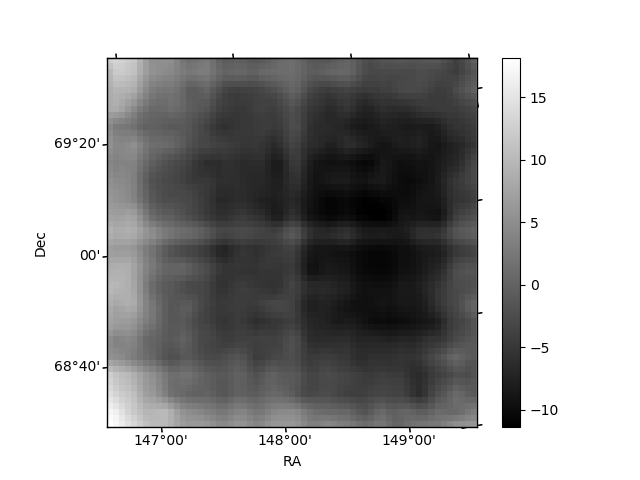
Quadrant B |
|---|---|---|---|
| Quadrant D | 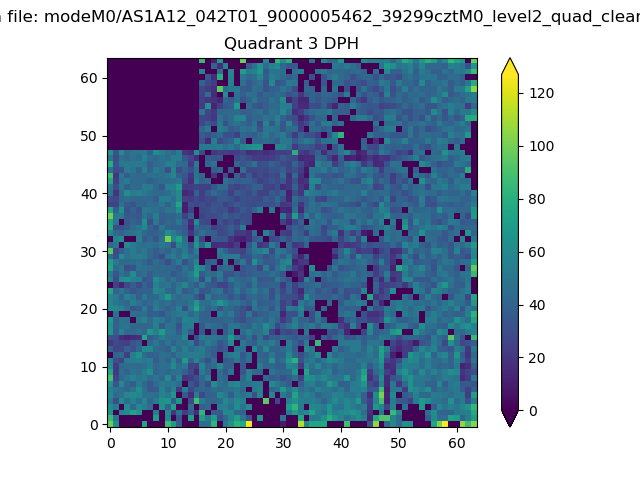 |
 |
Quadrant C |
| Plot type | Count rate plots | Images |
|---|---|---|
| Comparison with Poisson distribution Blue bars denote a histogram of data divided into 1 sec bins. Red curve is a Poisson curve with rate = median count rate of data. |
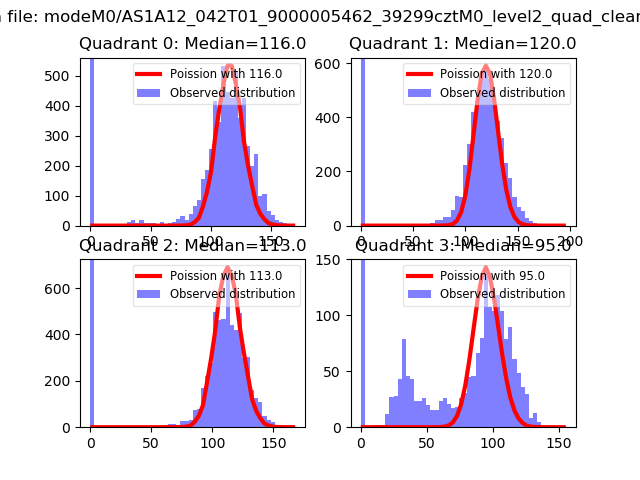 |
 |
| Quadrant-wise count rates Data is divided into 100 sec bins |
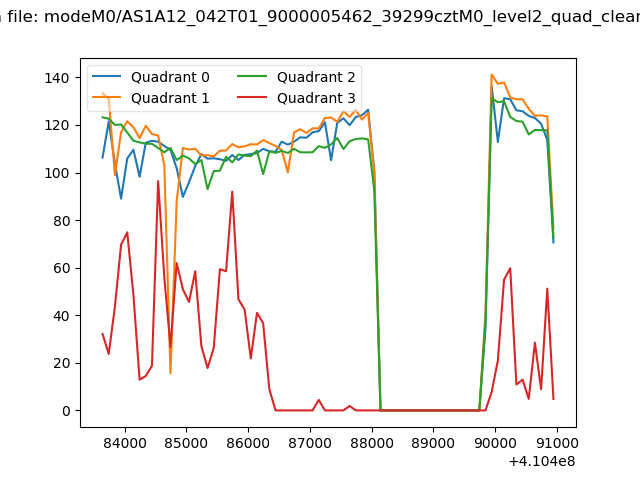 |
|
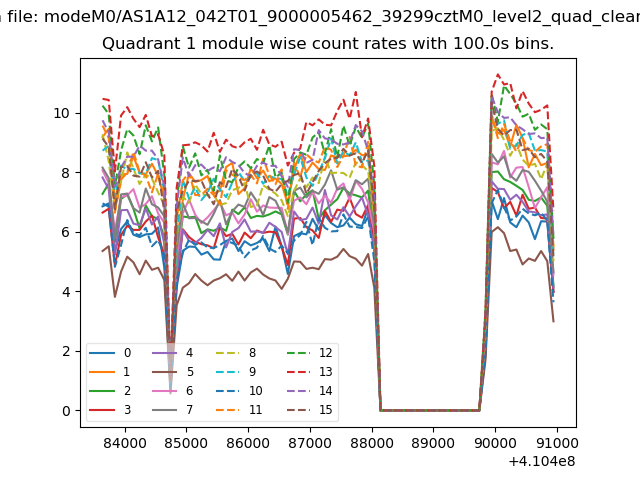
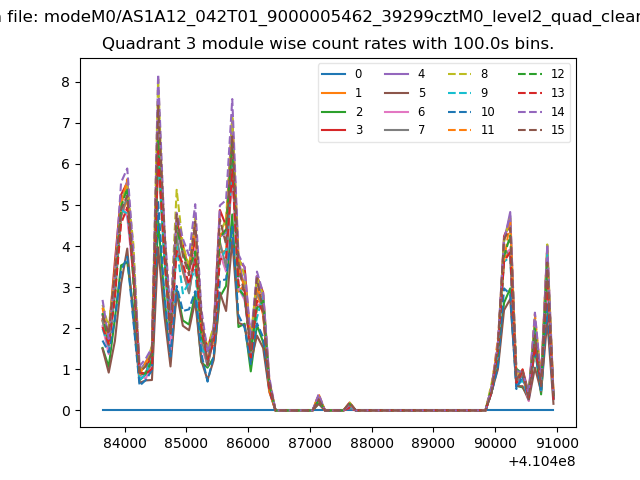
| Module-wise count rates for Quadrant A Data is divided into 100 sec bins |
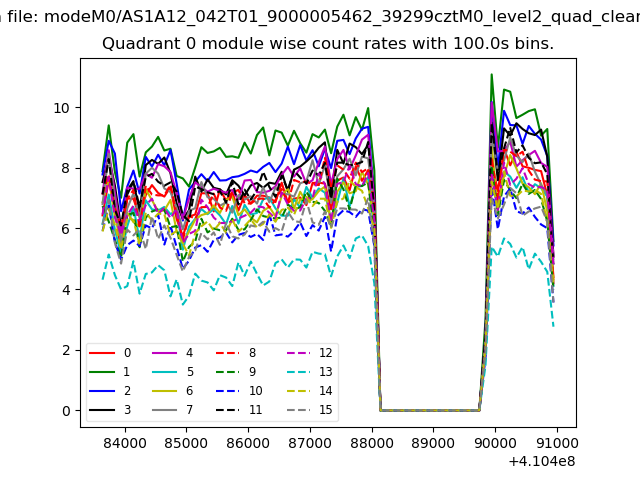 |
 |
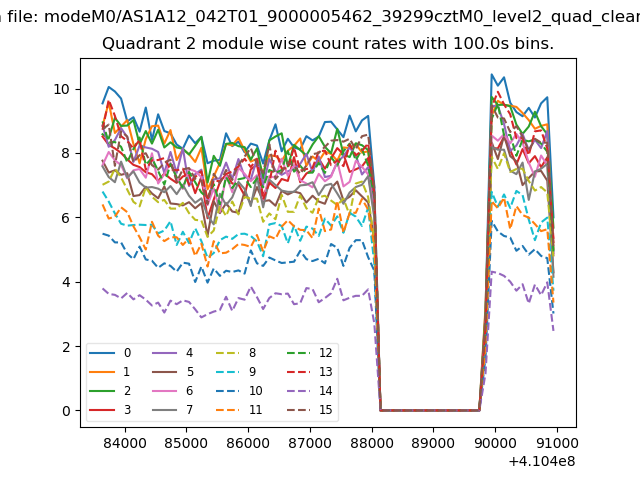
| Module-wise count rates for Quadrant B Data is divided into 100 sec bins |
 |
 |
| Module-wise count rates for Quadrant C Data is divided into 100 sec bins |
 |
 |
| Module-wise count rates for Quadrant D Data is divided into 100 sec bins |
 |
 |
| Parameter | Plot |
|---|---|
| CZT HV Monitor | 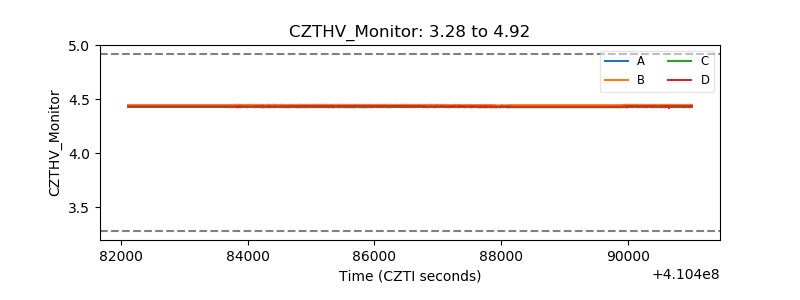 |
| D_VDD | 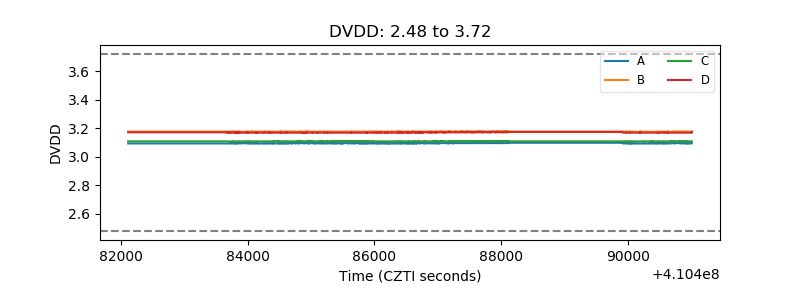 |
| Temperature 1 | 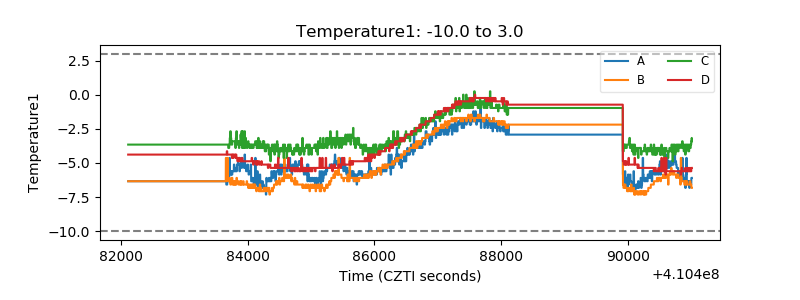 |
| Veto HV Monitor | 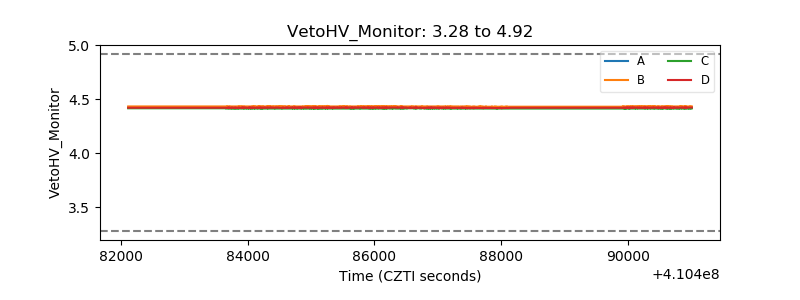 |
| Veto LLD | 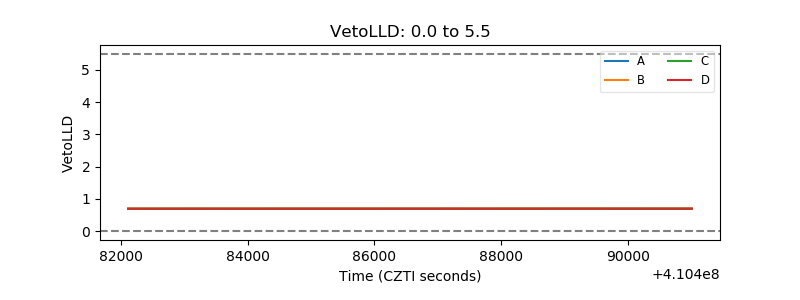 |
| Alpha Counter | 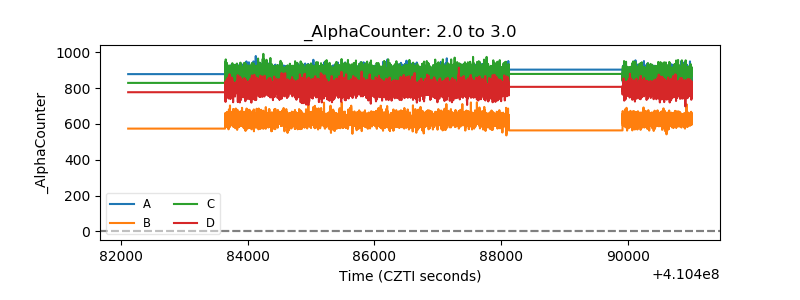 |
| _CPM_Rate | 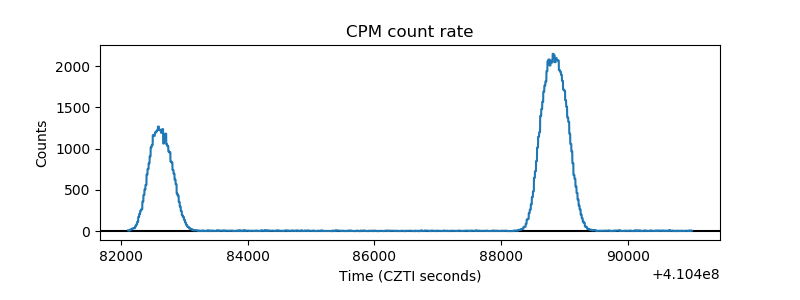 |
| CZT Counter | 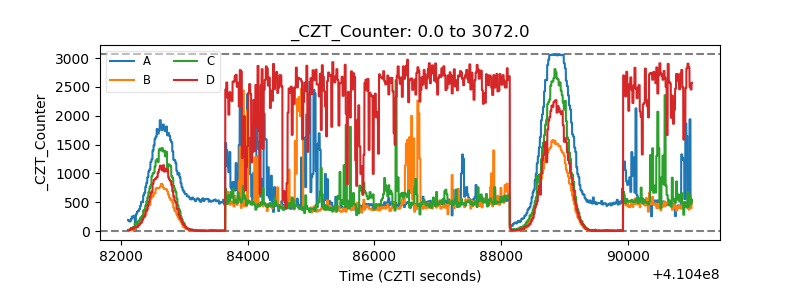 |
| +2.5 Volts monitor | 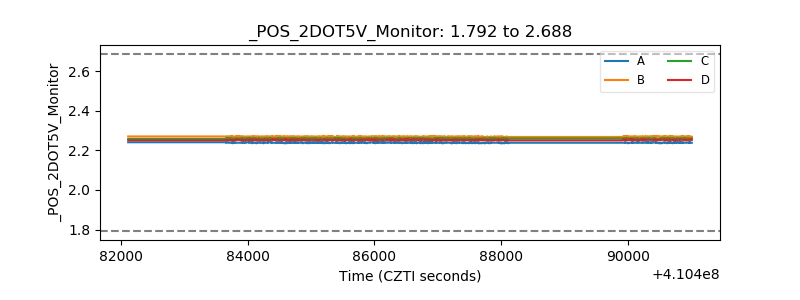 |
| +5 Volts monitor | 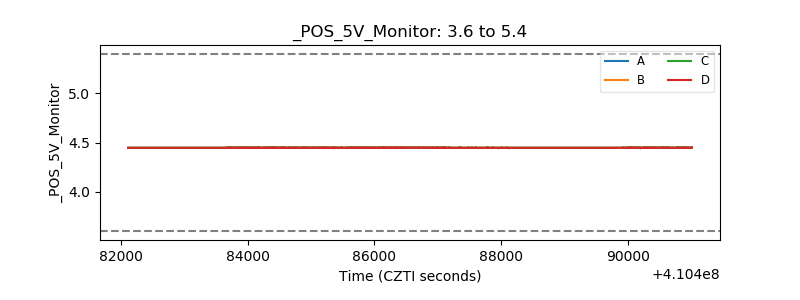 |
| _ROLL_ROT | 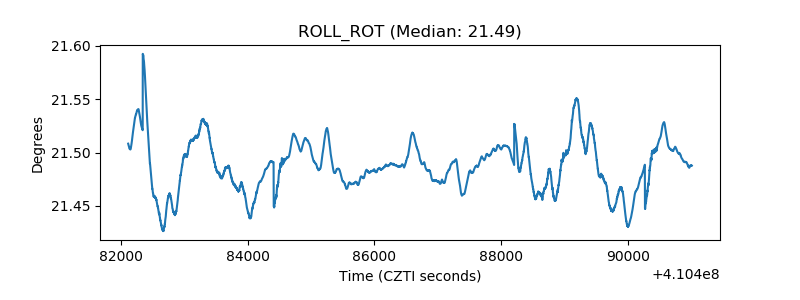 |
| _Roll_DEC | 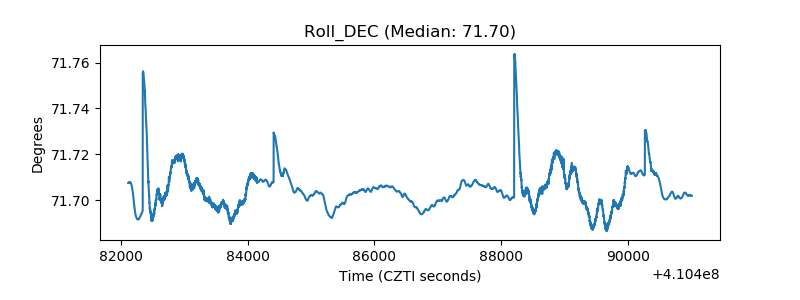 |
| _Roll_RA | 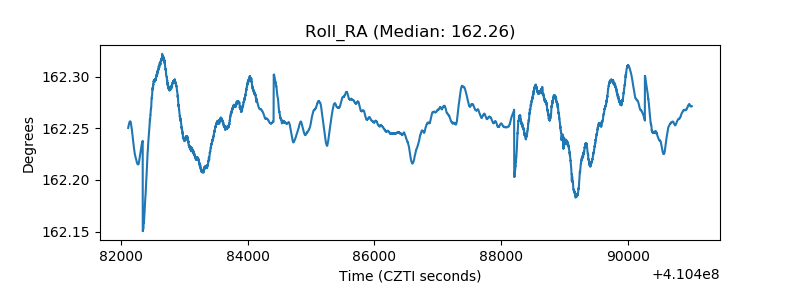 |
| Veto Counter | 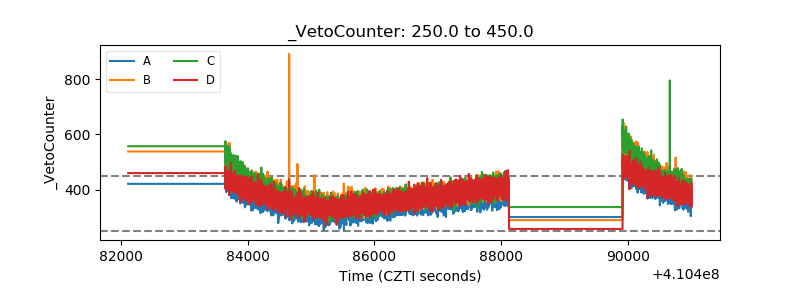 |