| Param | Original file | Final file |
|---|---|---|
| Filename | modeM0/AS1A12_042T01_9000005462_39301cztM0_level2.fits | modeM0/AS1A12_042T01_9000005462_39301cztM0_level2_quad_clean.evt |
| Size (bytes) | 472,109,760 | 68,656,320 |
| Size | 450.2 MB | 65.5 MB |
| Events in quadrant A | 2,703,566 | 532,190 |
| Events in quadrant B | 2,051,979 | 554,171 |
| Events in quadrant C | 2,588,737 | 514,834 |
| Events in quadrant D | 9,783,888 | 163,492 |
| Mode SS | |||
|---|---|---|---|
| Quadrant | BADHDUFLAG | Total packets | Discarded packets |
| A | 0 | 92 | 0 |
| B | 0 | 92 | 0 |
| C | 0 | 92 | 0 |
| D | 0 | 92 | 0 |
| Mode M0 | |||
|---|---|---|---|
| Quadrant | BADHDUFLAG | Total packets | Discarded packets |
| A | 0 | 10778 | 1 |
| B | 0 | 9187 | 1 |
| C | 0 | 10429 | 1 |
| D | 0 | 32143 | 1 |
| Mode M9 | |||
|---|---|---|---|
| Quadrant | BADHDUFLAG | Total packets | Discarded packets |
| A | 0 | 19 | 0 |
| B | 0 | 19 | 0 |
| C | 0 | 19 | 0 |
| D | 0 | 19 | 0 |
| Quadrant | Total seconds | Saturated seconds | Saturation percentage |
|---|---|---|---|
| A | 4463 | 72 | 1.613265% |
| B | 4463 | 12 | 0.268877% |
| C | 4463 | 47 | 1.053103% |
| D | 4463 | 3113 | 69.751288% |
Noise dominated data is calculated using 1-second bins in cleaned event files. If a bin has >2000 counts, and if more than 50% of those come from <1% of pixels, then it is considered to be noise-dominated and hence unusable.
| Quadrant | # 1 sec bins | Bins with >0 counts | Bins with >2000 counts | High rate bins dominated by noise | Noise dominated (total time) | Noise dominated (detector-on time) | Marked lightcurve |
|---|---|---|---|---|---|---|---|
| A | 6404 | 4464 | 64 | 64 | 1.00% | 1.43% | 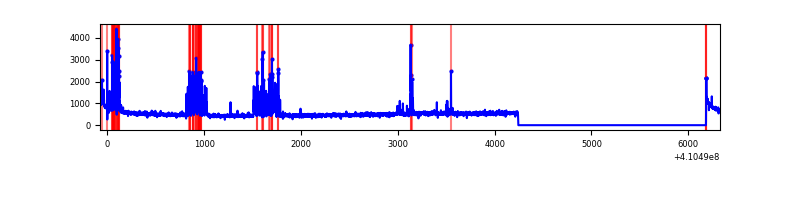 |
| B | 6404 | 4464 | 0 | 0 | 0.00% | 0.00% | 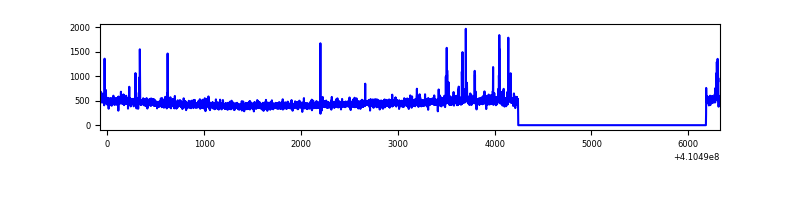 |
| C | 6404 | 4464 | 53 | 53 | 0.83% | 1.19% | 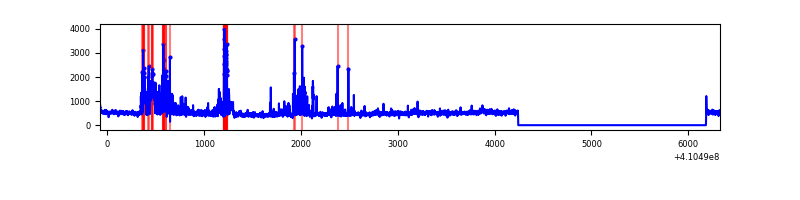 |
| D | 6404 | 4464 | 2802 | 2802 | 43.75% | 62.77% | 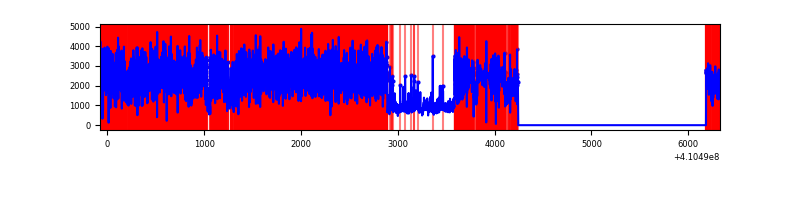 |
Top three noisy pixels from each quadrant. If the there are fewer than three noisy pixels in the level2.evt file, extra rows are filled as -1
| Pixel properties | Quadrant properties | ||||||
|---|---|---|---|---|---|---|---|
| Quadrant | DetID | PixID | Counts | Sigma | Mean | Median | Sigma |
| A | 13 | 248 | 442305 | 4363.67 | 496 | 487 | 101.2 |
| A | 10 | 83 | 342926 | 3382.14 | 496 | 487 | 101.2 |
| A | 3 | 137 | 5168 | 46.23 | 496 | 487 | 101.2 |
| B | 5 | 255 | 43570 | 450.31 | 498 | 484 | 95.7 |
| B | 5 | 172 | 17273 | 175.47 | 498 | 484 | 95.7 |
| B | 0 | 213 | 16029 | 162.47 | 498 | 484 | 95.7 |
| C | 14 | 254 | 521980 | 4743.03 | 478 | 482 | 110.0 |
| C | 15 | 214 | 185456 | 1682.34 | 478 | 482 | 110.0 |
| C | 3 | 233 | 11477 | 100.0 | 478 | 482 | 110.0 |
| D | 12 | 235 | 8155816 | 102193.07 | 327 | 317 | 79.8 |
| D | 13 | 249 | 159826 | 1998.74 | 327 | 317 | 79.8 |
| D | 5 | 222 | 65919 | 822.03 | 327 | 317 | 79.8 |
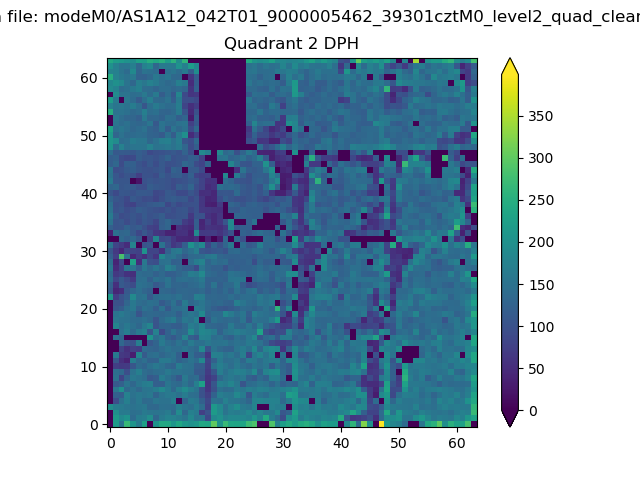
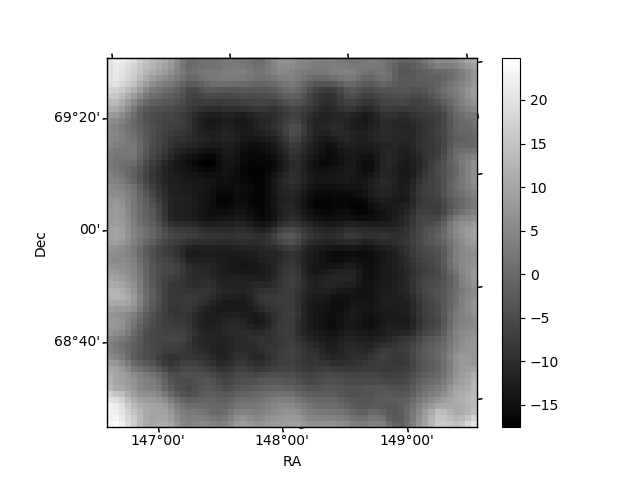
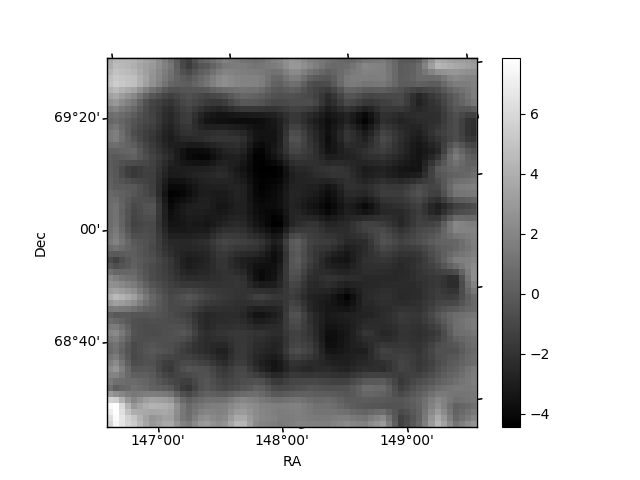
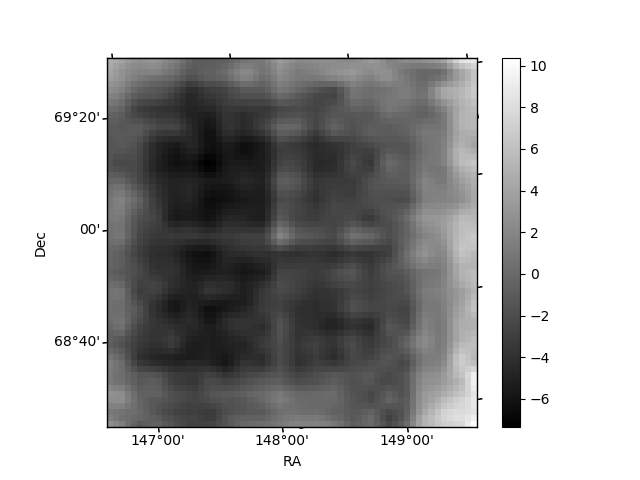
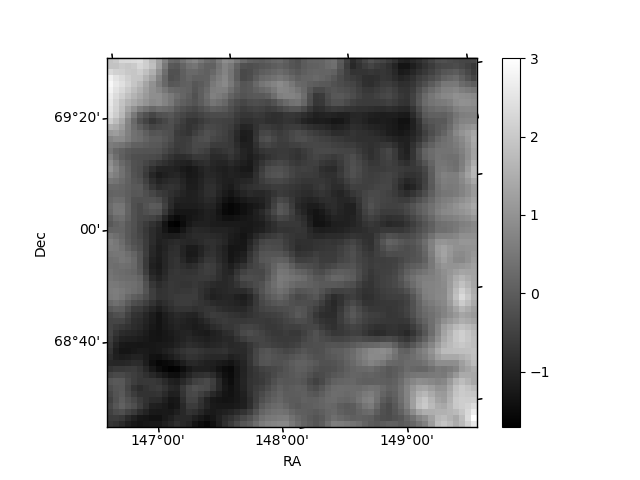
Histogram calculated using DETX and DETY for each event in the final _common_clean file
| Quadrant A | 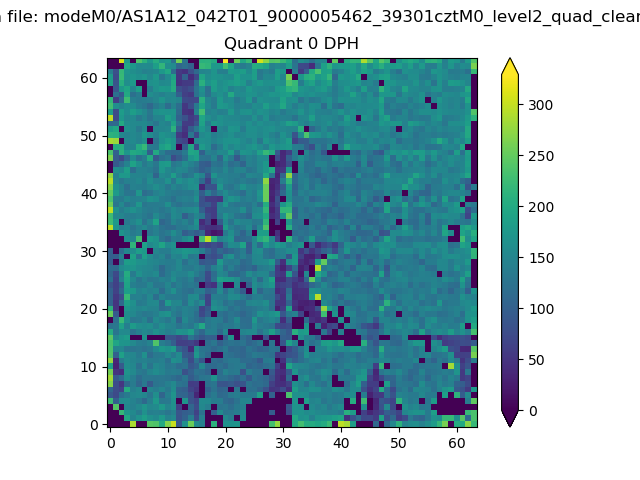 |
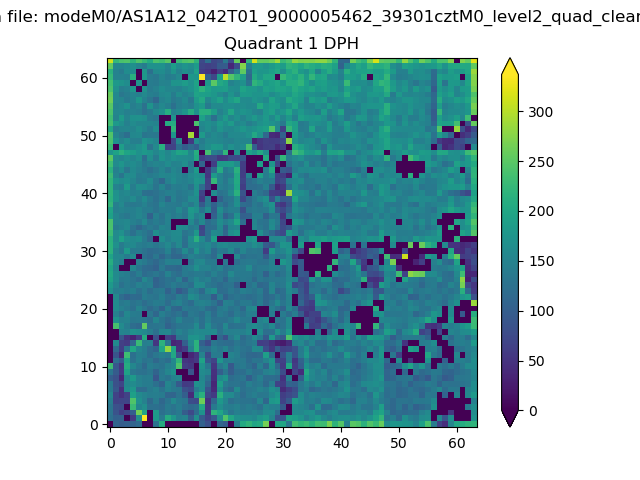 |
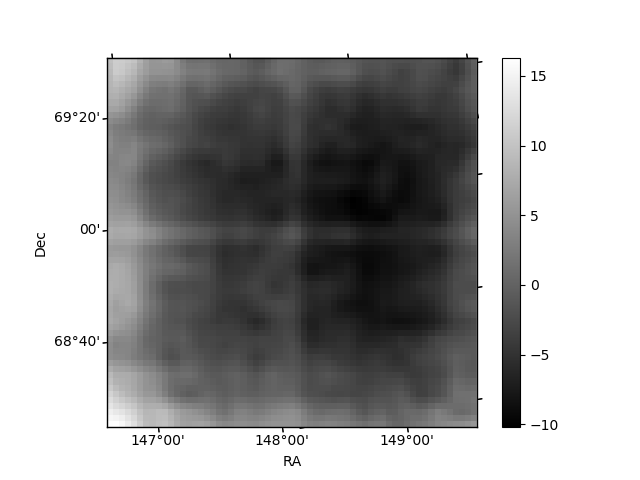
Quadrant B |
|---|---|---|---|
| Quadrant D | 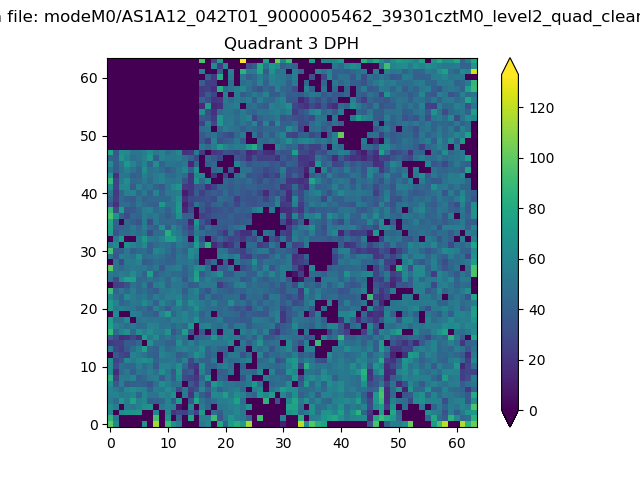 |
 |
Quadrant C |
| Plot type | Count rate plots | Images |
|---|---|---|
| Comparison with Poisson distribution Blue bars denote a histogram of data divided into 1 sec bins. Red curve is a Poisson curve with rate = median count rate of data. |
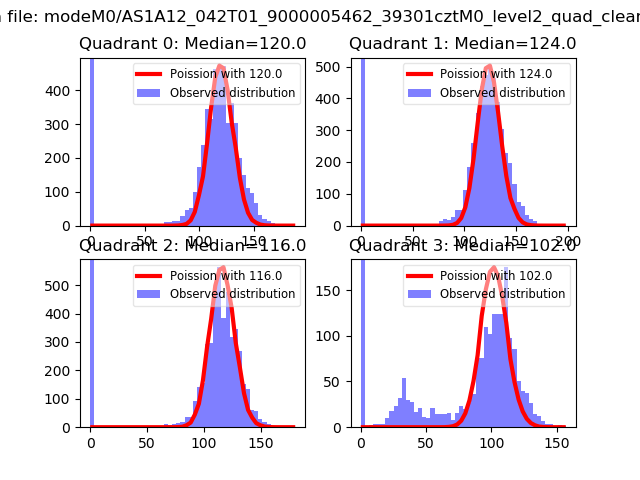 |
 |
| Quadrant-wise count rates Data is divided into 100 sec bins |
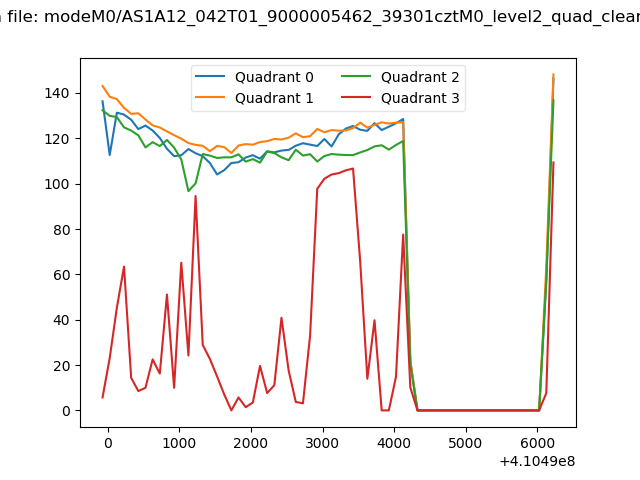 |
|
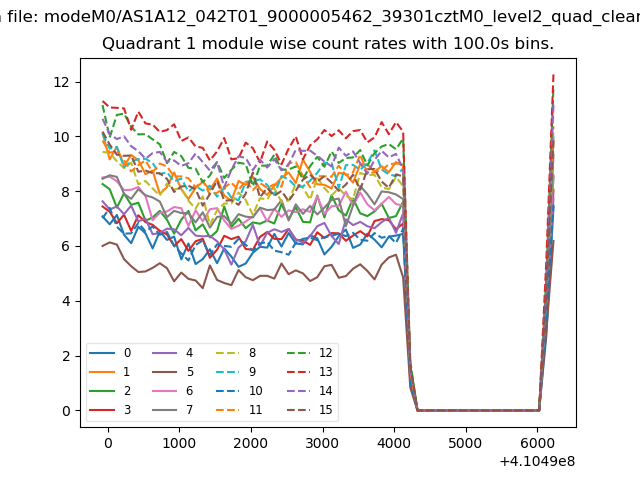
| Module-wise count rates for Quadrant A Data is divided into 100 sec bins |
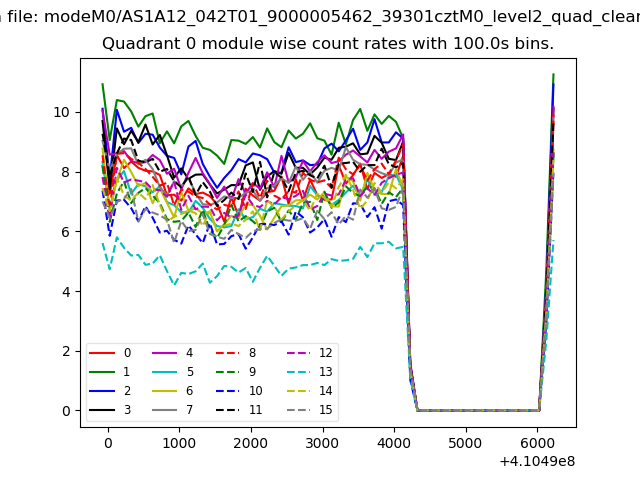 |
 |
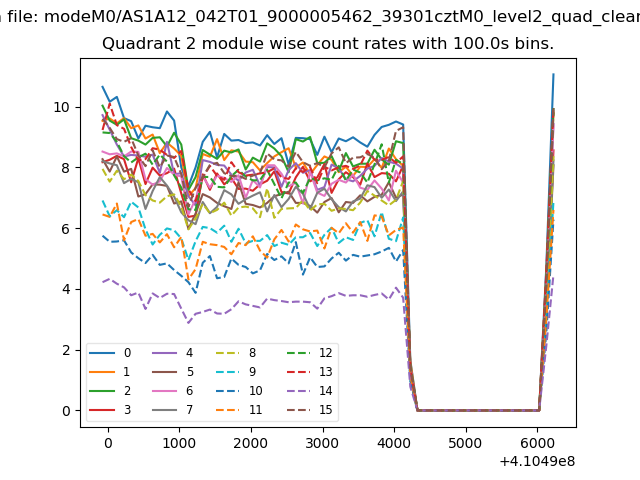
| Module-wise count rates for Quadrant B Data is divided into 100 sec bins |
 |
 |
| Module-wise count rates for Quadrant C Data is divided into 100 sec bins |
 |
 |
| Module-wise count rates for Quadrant D Data is divided into 100 sec bins |
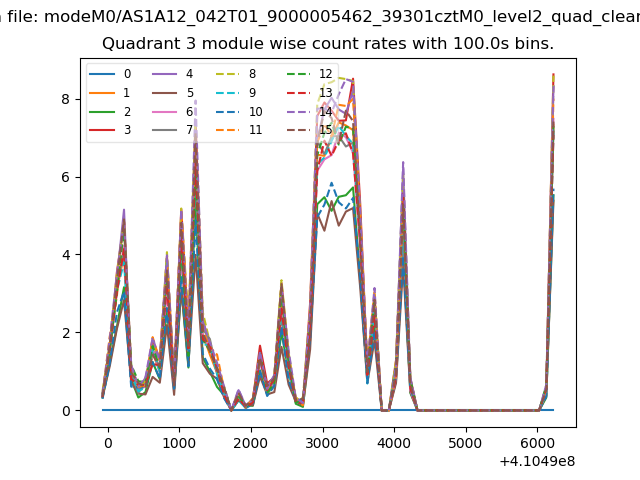 |
 |
| Parameter | Plot |
|---|---|
| CZT HV Monitor | 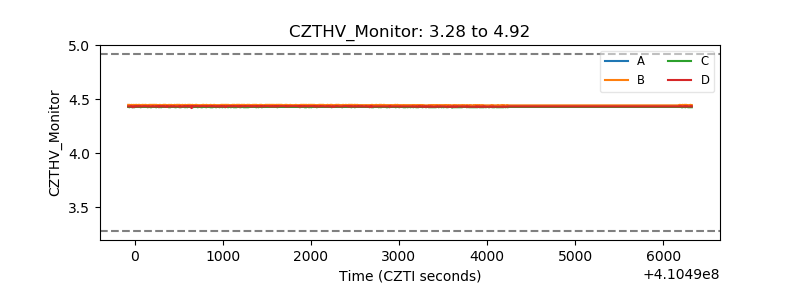 |
| D_VDD | 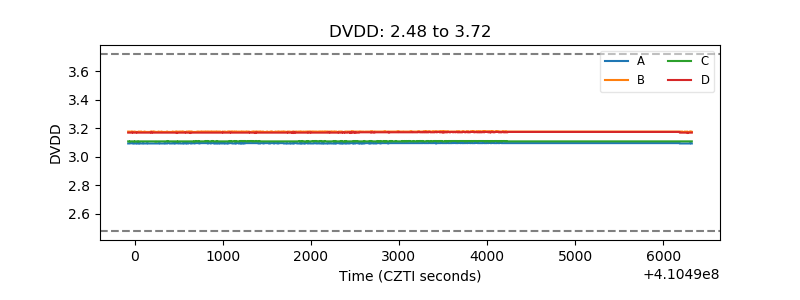 |
| Temperature 1 | 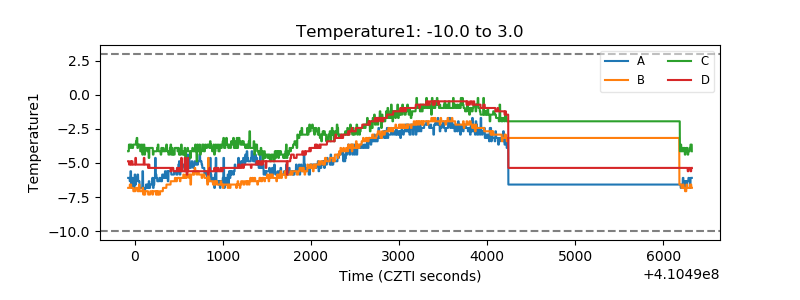 |
| Veto HV Monitor |  |
| Veto LLD | 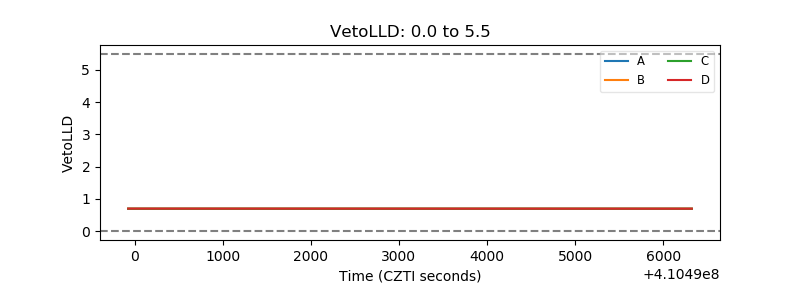 |
| Alpha Counter | 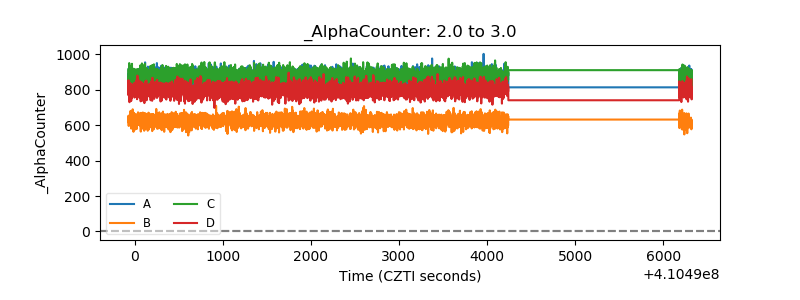 |
| _CPM_Rate | 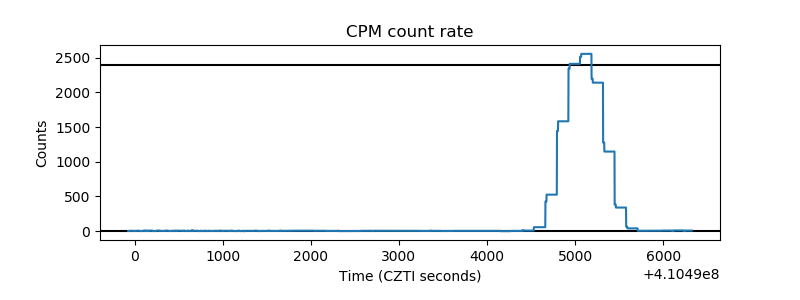 |
| CZT Counter | 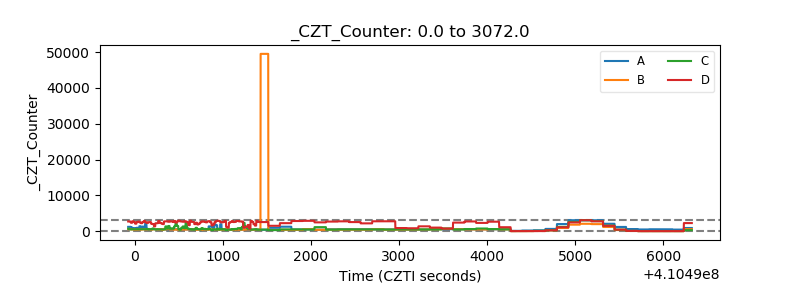 |
| +2.5 Volts monitor | 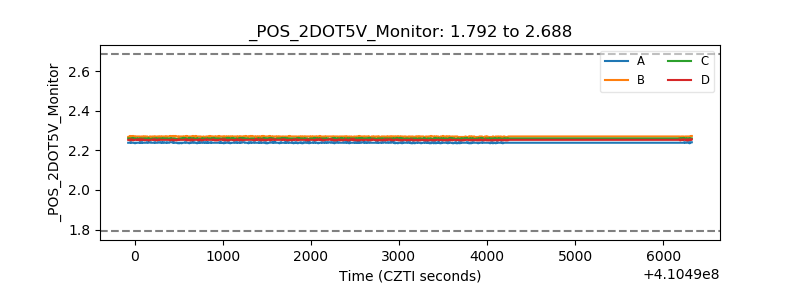 |
| +5 Volts monitor | 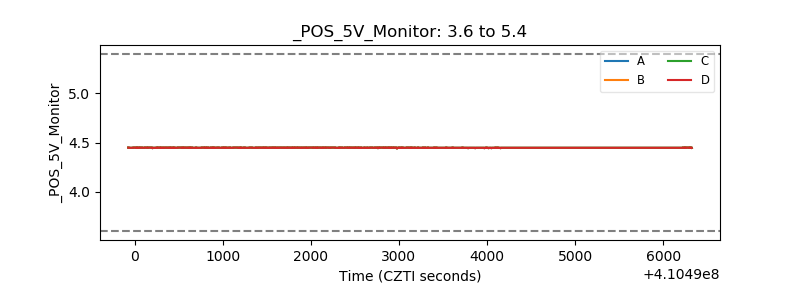 |
| _ROLL_ROT | 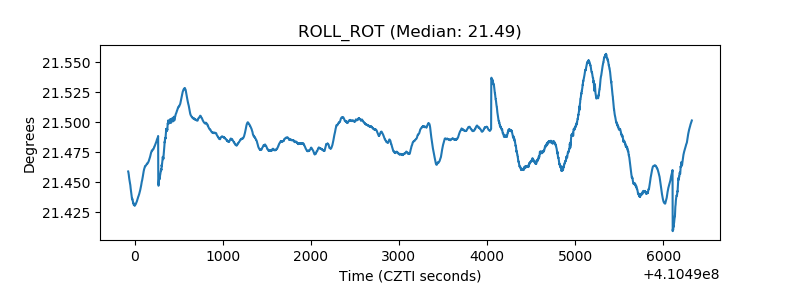 |
| _Roll_DEC | 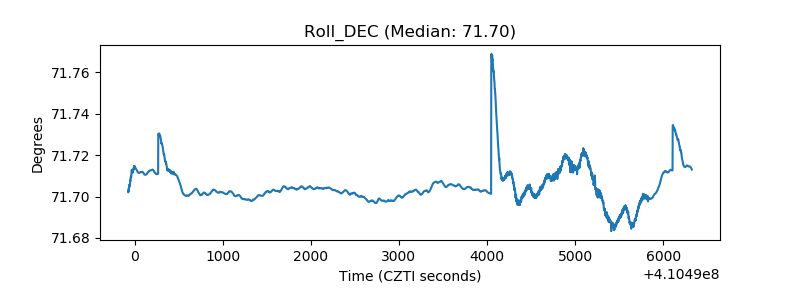 |
| _Roll_RA | 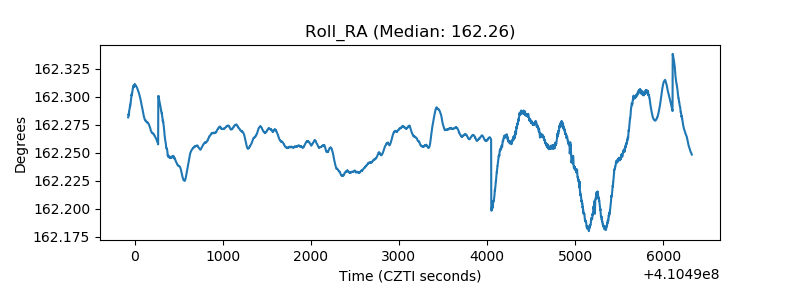 |
| Veto Counter | 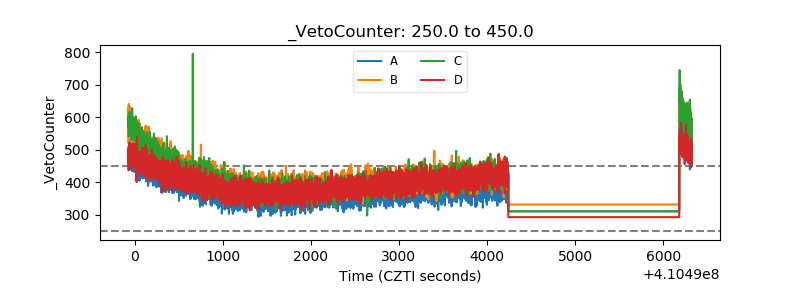 |