| Param | Original file | Final file |
|---|---|---|
| Filename | modeM0/AS1A12_044T04_9000005464_39301cztM0_level2.fits | modeM0/AS1A12_044T04_9000005464_39301cztM0_level2_quad_clean.evt |
| Size (bytes) | 374,345,280 | 52,369,920 |
| Size | 357.0 MB | 49.9 MB |
| Events in quadrant A | 2,118,868 | 419,617 |
| Events in quadrant B | 1,785,056 | 438,342 |
| Events in quadrant C | 1,736,032 | 415,385 |
| Events in quadrant D | 7,954,263 | 74,257 |
| Mode M0 | |||
|---|---|---|---|
| Quadrant | BADHDUFLAG | Total packets | Discarded packets |
| A | 0 | 8294 | 2 |
| B | 0 | 7404 | 1 |
| C | 0 | 7131 | 1 |
| D | 0 | 25975 | 1 |
| Mode SS | |||
|---|---|---|---|
| Quadrant | BADHDUFLAG | Total packets | Discarded packets |
| A | 0 | 70 | 0 |
| B | 0 | 70 | 0 |
| C | 0 | 70 | 0 |
| D | 0 | 70 | 0 |
| Mode M9 | |||
|---|---|---|---|
| Quadrant | BADHDUFLAG | Total packets | Discarded packets |
| A | 0 | 20 | 0 |
| B | 0 | 20 | 0 |
| C | 0 | 20 | 0 |
| D | 0 | 20 | 0 |
| Quadrant | Total seconds | Saturated seconds | Saturation percentage |
|---|---|---|---|
| A | 3358 | 82 | 2.441930% |
| B | 3358 | 28 | 0.833830% |
| C | 3358 | 8 | 0.238237% |
| D | 3358 | 2827 | 84.187016% |
Noise dominated data is calculated using 1-second bins in cleaned event files. If a bin has >2000 counts, and if more than 50% of those come from <1% of pixels, then it is considered to be noise-dominated and hence unusable.
| Quadrant | # 1 sec bins | Bins with >0 counts | Bins with >2000 counts | High rate bins dominated by noise | Noise dominated (total time) | Noise dominated (detector-on time) | Marked lightcurve |
|---|---|---|---|---|---|---|---|
| A | 5390 | 3359 | 57 | 57 | 1.06% | 1.70% | 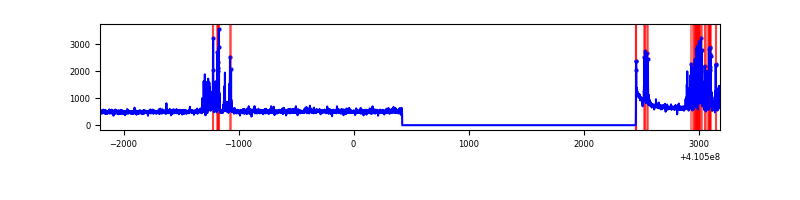 |
| B | 5390 | 3359 | 16 | 16 | 0.30% | 0.48% | 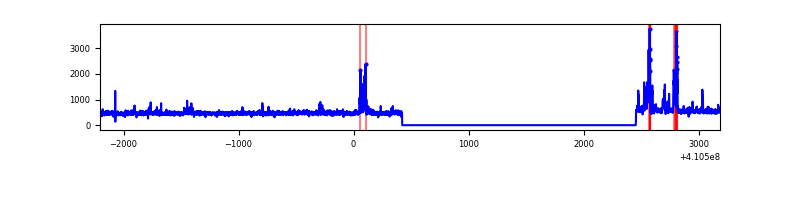 |
| C | 5390 | 3359 | 5 | 5 | 0.09% | 0.15% | 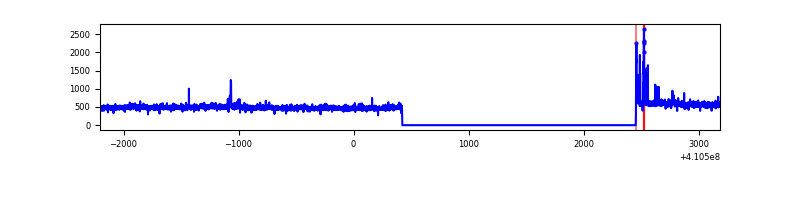 |
| D | 5390 | 3359 | 2468 | 2468 | 45.79% | 73.47% | 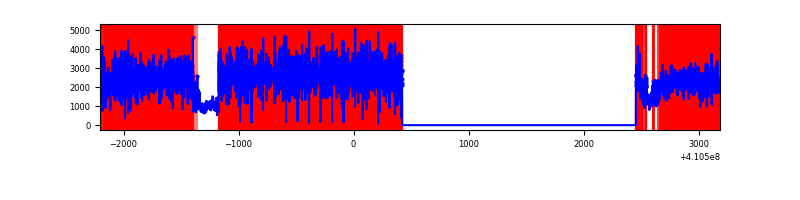 |
Top three noisy pixels from each quadrant. If the there are fewer than three noisy pixels in the level2.evt file, extra rows are filled as -1
| Pixel properties | Quadrant properties | ||||||
|---|---|---|---|---|---|---|---|
| Quadrant | DetID | PixID | Counts | Sigma | Mean | Median | Sigma |
| A | 13 | 248 | 309949 | 3780.82 | 403 | 396 | 81.9 |
| A | 10 | 83 | 250137 | 3050.29 | 403 | 396 | 81.9 |
| A | 13 | 254 | 4473 | 49.8 | 403 | 396 | 81.9 |
| B | 5 | 172 | 135754 | 1742.48 | 401 | 391 | 77.7 |
| B | 15 | 85 | 36367 | 463.11 | 401 | 391 | 77.7 |
| B | 5 | 255 | 13323 | 166.47 | 401 | 391 | 77.7 |
| C | 15 | 214 | 141937 | 1577.74 | 390 | 392 | 89.7 |
| C | 14 | 254 | 44266 | 489.04 | 390 | 392 | 89.7 |
| C | 3 | 233 | 21900 | 239.74 | 390 | 392 | 89.7 |
| D | 12 | 235 | 6943329 | 127441.54 | 220 | 214 | 54.5 |
| D | 13 | 249 | 74708 | 1367.34 | 220 | 214 | 54.5 |
| D | 5 | 222 | 38785 | 707.97 | 220 | 214 | 54.5 |
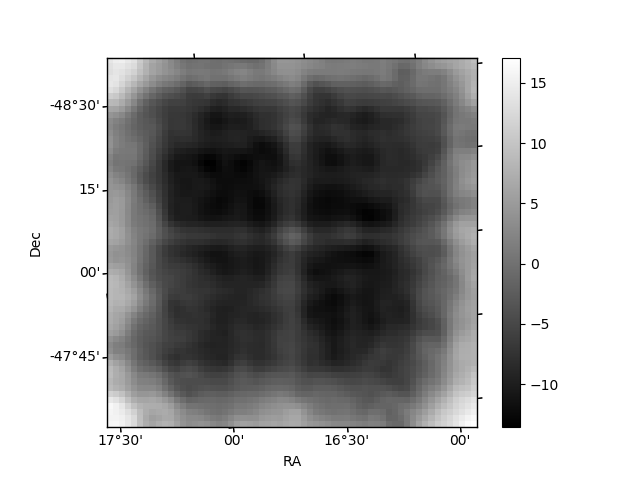
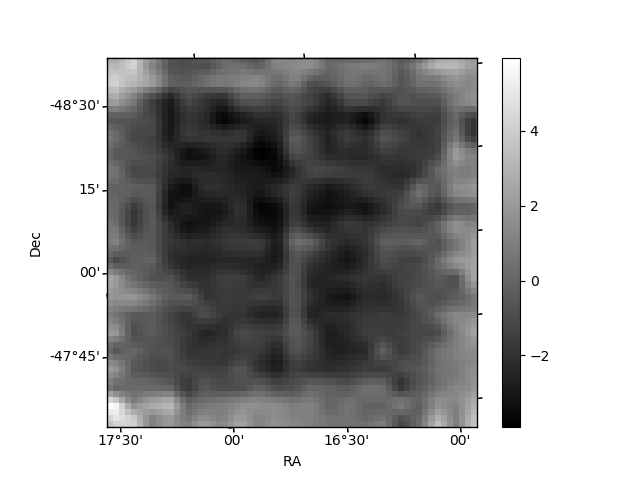
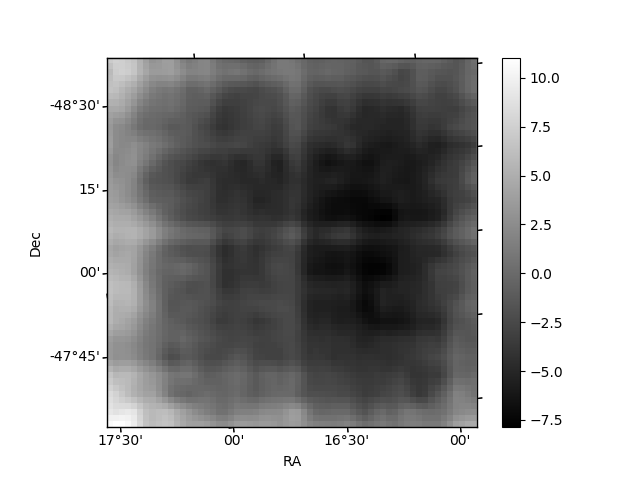
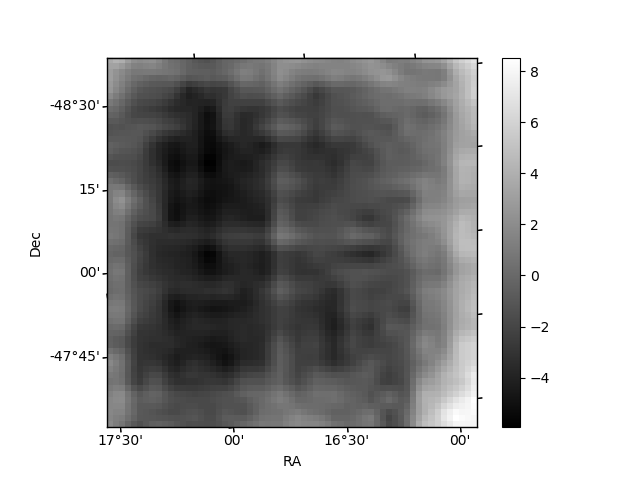
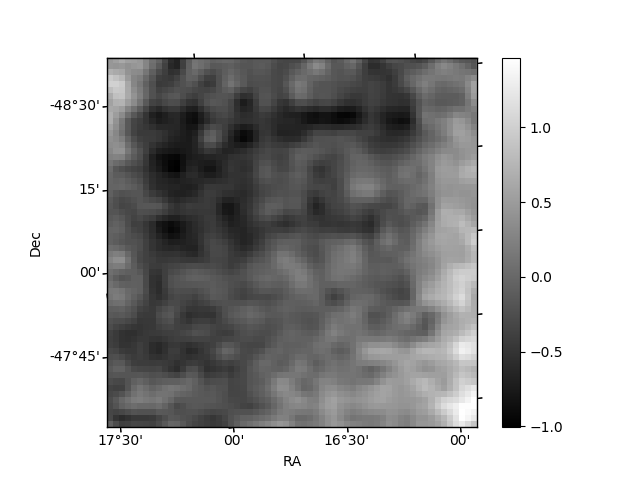
Histogram calculated using DETX and DETY for each event in the final _common_clean file
| Quadrant A | 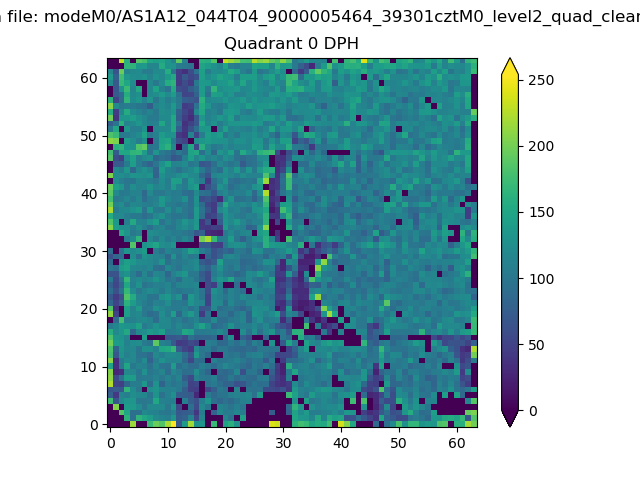 |
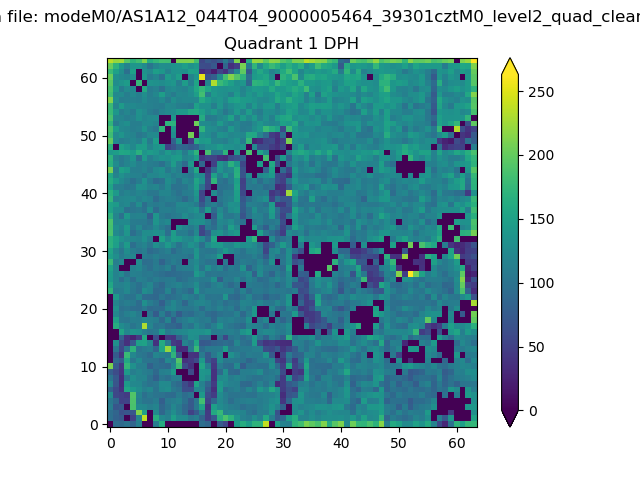 |
Quadrant B |
|---|---|---|---|
| Quadrant D | 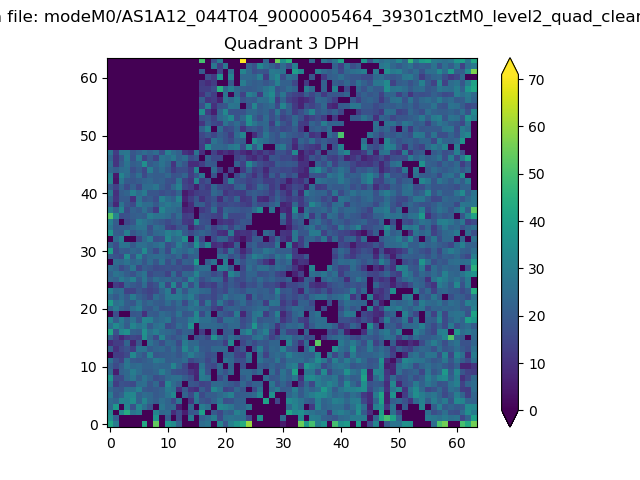 |
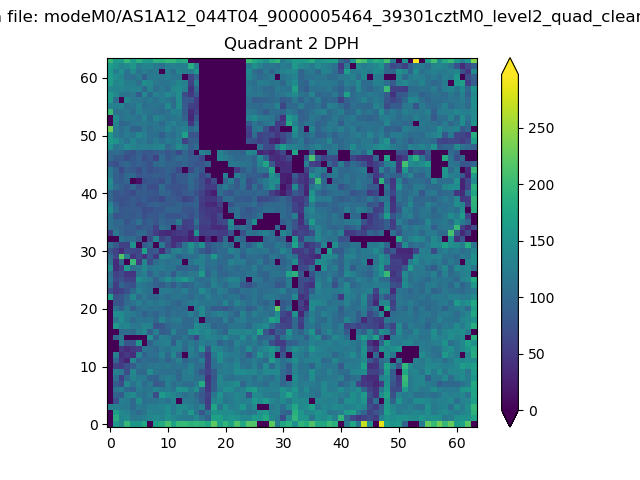 |
Quadrant C |
| Plot type | Count rate plots | Images |
|---|---|---|
| Comparison with Poisson distribution Blue bars denote a histogram of data divided into 1 sec bins. Red curve is a Poisson curve with rate = median count rate of data. |
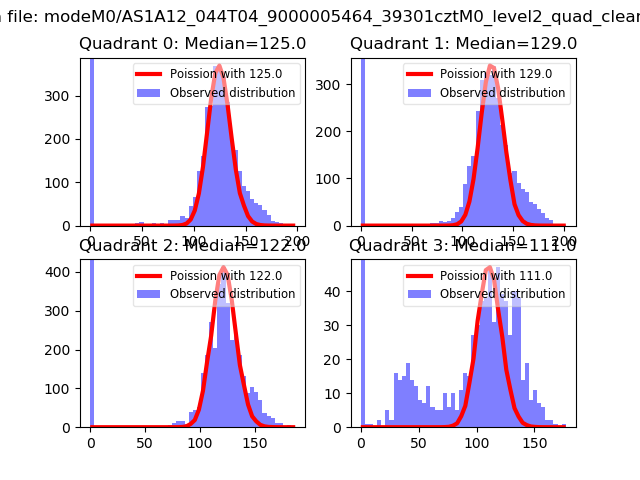 |
 |
| Quadrant-wise count rates Data is divided into 100 sec bins |
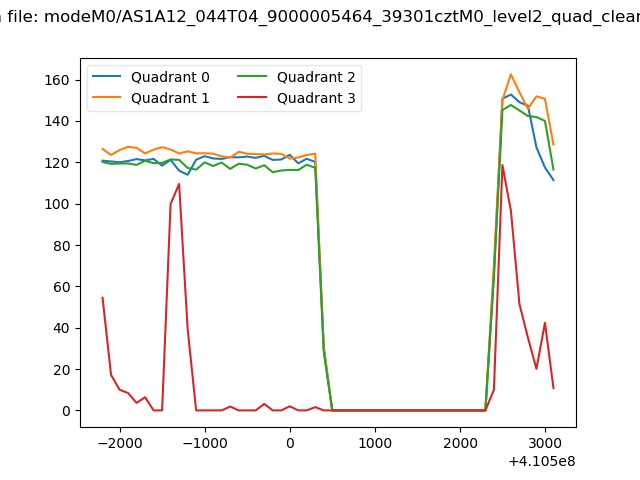 |
|
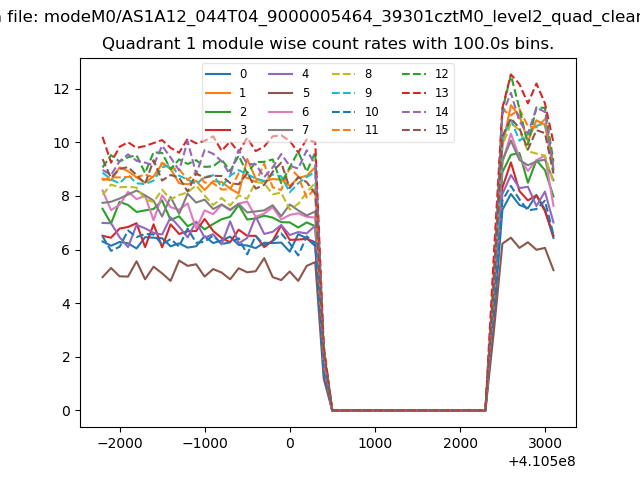
| Module-wise count rates for Quadrant A Data is divided into 100 sec bins |
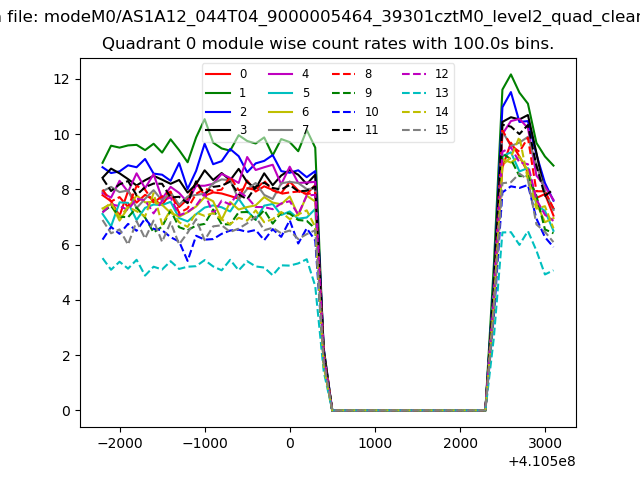 |
 |
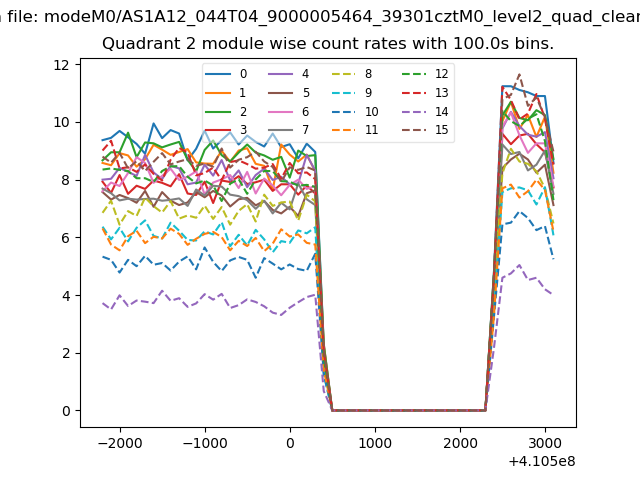
| Module-wise count rates for Quadrant B Data is divided into 100 sec bins |
 |
 |
| Module-wise count rates for Quadrant C Data is divided into 100 sec bins |
 |
 |
| Module-wise count rates for Quadrant D Data is divided into 100 sec bins |
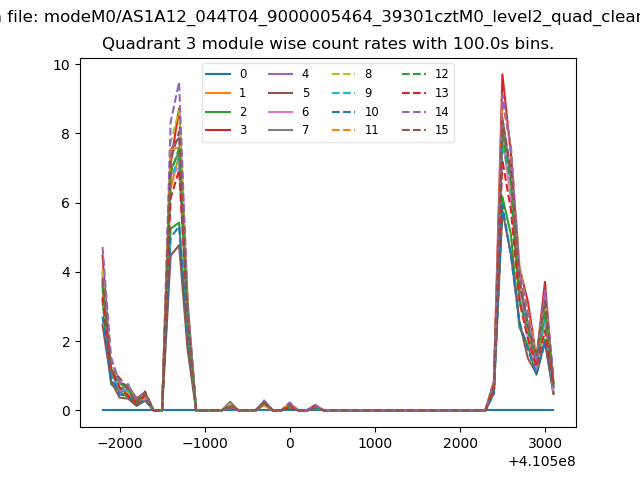 |
 |
| Parameter | Plot |
|---|---|
| CZT HV Monitor | 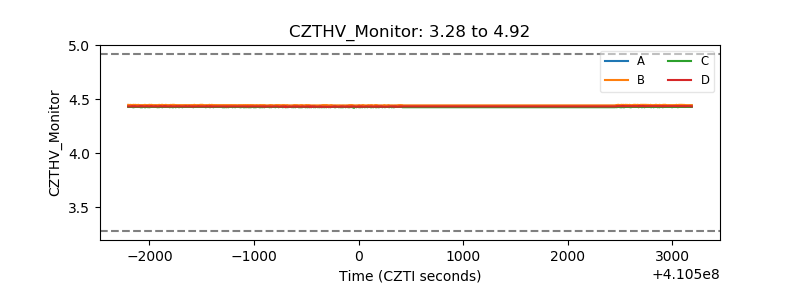 |
| D_VDD | 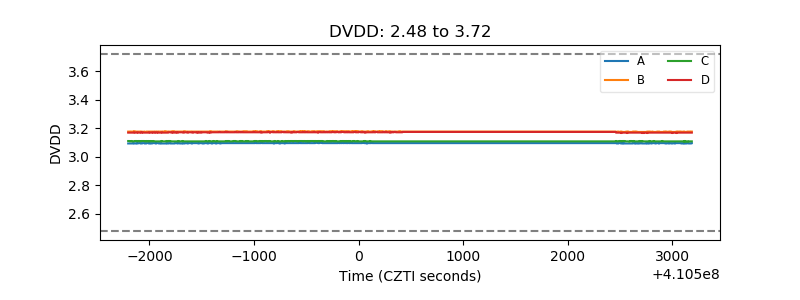 |
| Temperature 1 | 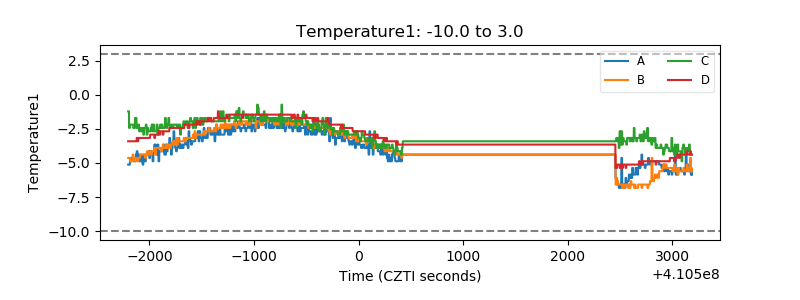 |
| Veto HV Monitor | 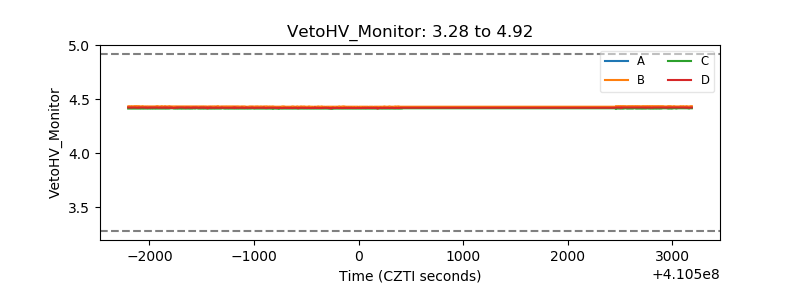 |
| Veto LLD | 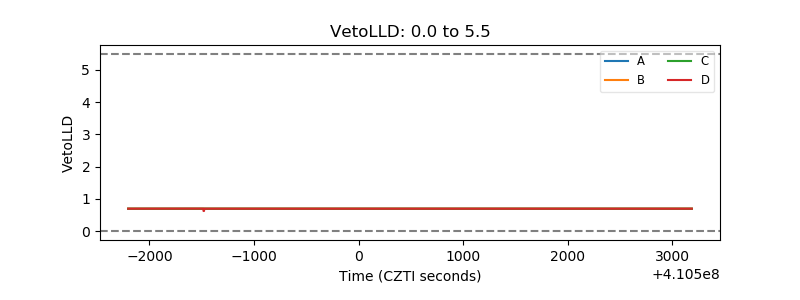 |
| Alpha Counter | 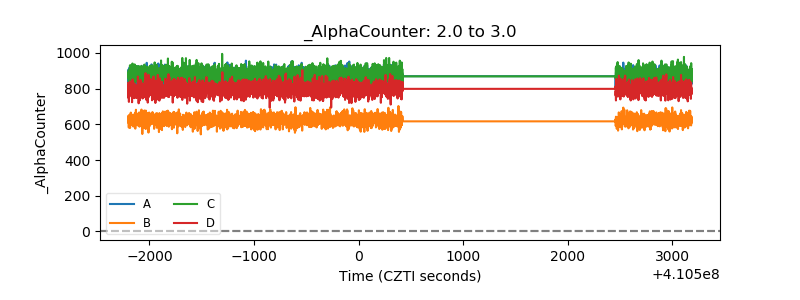 |
| _CPM_Rate | 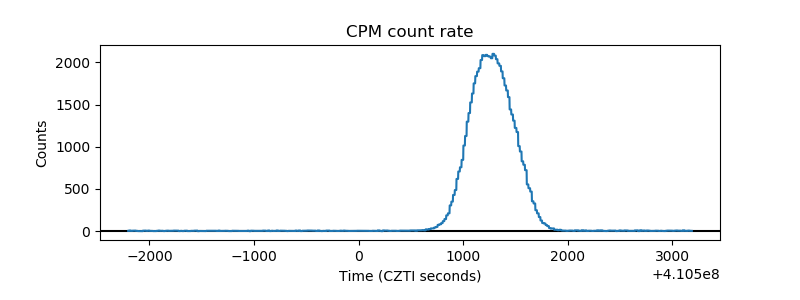 |
| CZT Counter | 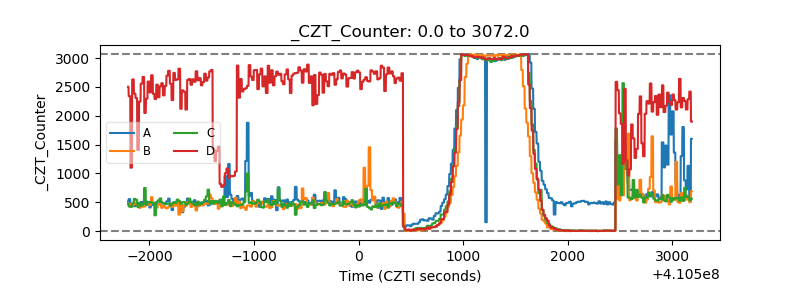 |
| +2.5 Volts monitor | 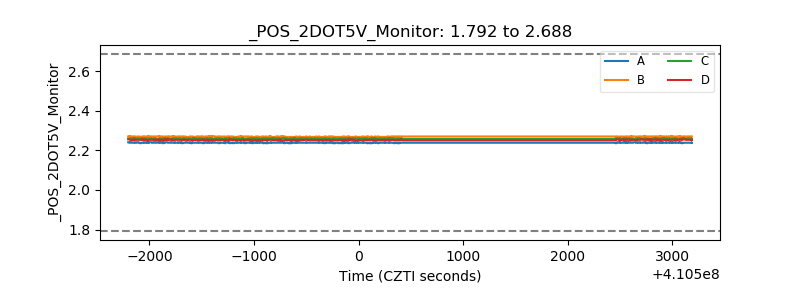 |
| +5 Volts monitor | 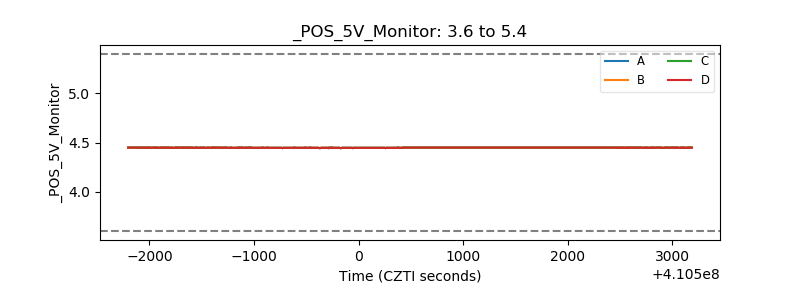 |
| _ROLL_ROT | 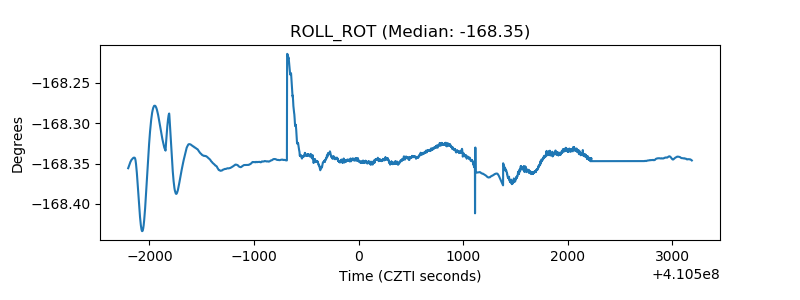 |
| _Roll_DEC | 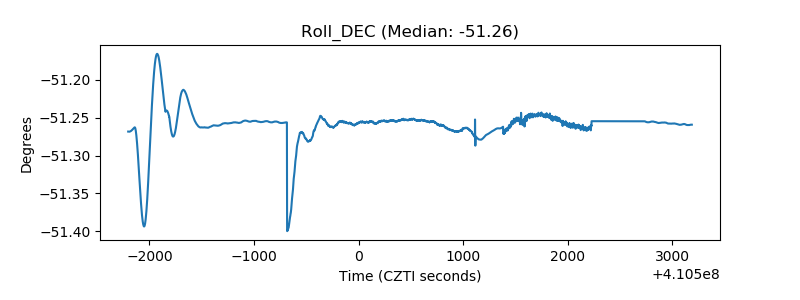 |
| _Roll_RA | 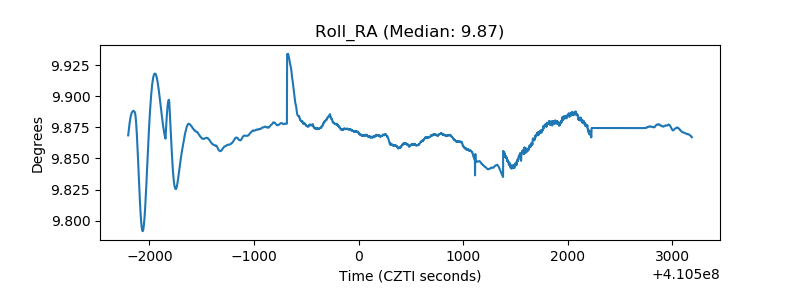 |
| Veto Counter | 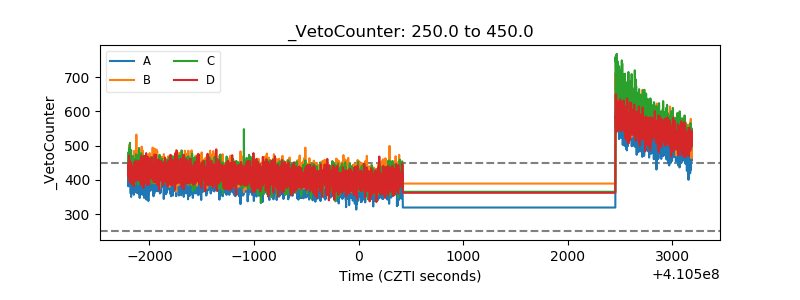 |