| Param | Original file | Final file |
|---|---|---|
| Filename | modeM0/AS1A12_044T04_9000005464_39302cztM0_level2.fits | modeM0/AS1A12_044T04_9000005464_39302cztM0_level2_quad_clean.evt |
| Size (bytes) | 521,832,960 | 83,597,760 |
| Size | 497.7 MB | 79.7 MB |
| Events in quadrant A | 3,108,087 | 656,092 |
| Events in quadrant B | 2,700,433 | 679,013 |
| Events in quadrant C | 2,683,252 | 647,076 |
| Events in quadrant D | 10,437,680 | 201,067 |
| Mode M0 | |||
|---|---|---|---|
| Quadrant | BADHDUFLAG | Total packets | Discarded packets |
| A | 0 | 12171 | 3 |
| B | 0 | 10952 | 2 |
| C | 0 | 10783 | 2 |
| D | 0 | 34378 | 2 |
| Mode SS | |||
|---|---|---|---|
| Quadrant | BADHDUFLAG | Total packets | Discarded packets |
| A | 0 | 100 | 0 |
| B | 0 | 100 | 0 |
| C | 0 | 100 | 0 |
| D | 0 | 100 | 0 |
| Mode M9 | |||
|---|---|---|---|
| Quadrant | BADHDUFLAG | Total packets | Discarded packets |
| A | 0 | 30 | 0 |
| B | 0 | 30 | 0 |
| C | 0 | 30 | 0 |
| D | 0 | 31 | 0 |
| Quadrant | Total seconds | Saturated seconds | Saturation percentage |
|---|---|---|---|
| A | 4971 | 74 | 1.488634% |
| B | 4971 | 51 | 1.025951% |
| C | 4971 | 10 | 0.201167% |
| D | 4971 | 3504 | 70.488835% |
Noise dominated data is calculated using 1-second bins in cleaned event files. If a bin has >2000 counts, and if more than 50% of those come from <1% of pixels, then it is considered to be noise-dominated and hence unusable.
| Quadrant | # 1 sec bins | Bins with >0 counts | Bins with >2000 counts | High rate bins dominated by noise | Noise dominated (total time) | Noise dominated (detector-on time) | Marked lightcurve |
|---|---|---|---|---|---|---|---|
| A | 7095 | 4972 | 51 | 51 | 0.72% | 1.03% | 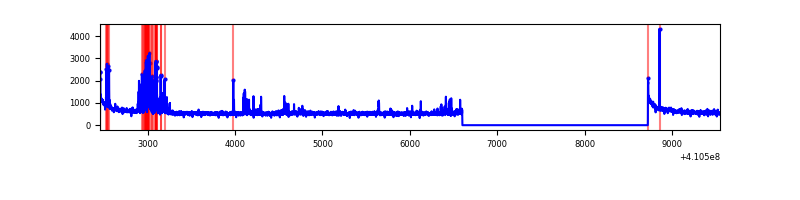 |
| B | 7095 | 4972 | 28 | 28 | 0.39% | 0.56% | 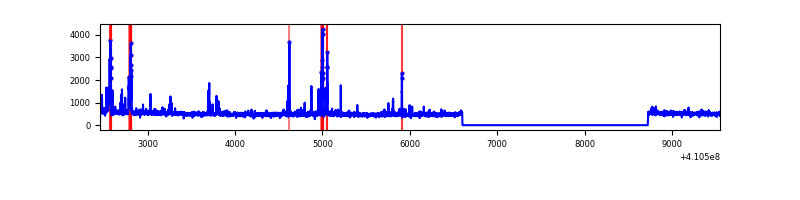 |
| C | 7095 | 4972 | 5 | 5 | 0.07% | 0.10% | 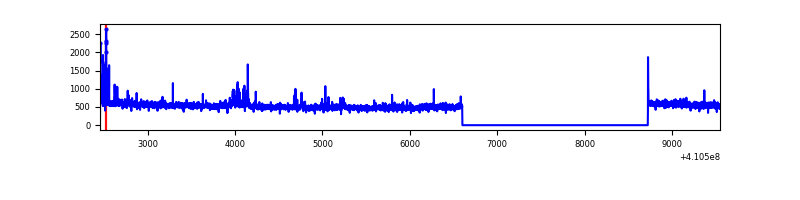 |
| D | 7095 | 4972 | 3099 | 3099 | 43.68% | 62.33% | 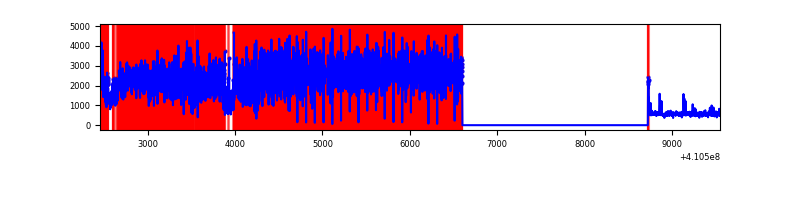 |
Top three noisy pixels from each quadrant. If the there are fewer than three noisy pixels in the level2.evt file, extra rows are filled as -1
| Pixel properties | Quadrant properties | ||||||
|---|---|---|---|---|---|---|---|
| Quadrant | DetID | PixID | Counts | Sigma | Mean | Median | Sigma |
| A | 10 | 83 | 429031 | 3482.18 | 614 | 603 | 123.0 |
| A | 13 | 248 | 299415 | 2428.69 | 614 | 603 | 123.0 |
| A | 13 | 254 | 8336 | 62.85 | 614 | 603 | 123.0 |
| B | 5 | 172 | 159663 | 1395.36 | 608 | 594 | 114.0 |
| B | 5 | 255 | 95806 | 835.2 | 608 | 594 | 114.0 |
| B | 12 | 111 | 13436 | 112.65 | 608 | 594 | 114.0 |
| C | 15 | 214 | 216446 | 1571.97 | 600 | 605 | 137.3 |
| C | 14 | 254 | 56012 | 403.53 | 600 | 605 | 137.3 |
| C | 3 | 233 | 50897 | 366.28 | 600 | 605 | 137.3 |
| D | 12 | 235 | 8732972 | 95158.85 | 383 | 371 | 91.8 |
| D | 5 | 222 | 68108 | 738.12 | 383 | 371 | 91.8 |
| D | 5 | 32 | 46400 | 501.57 | 383 | 371 | 91.8 |
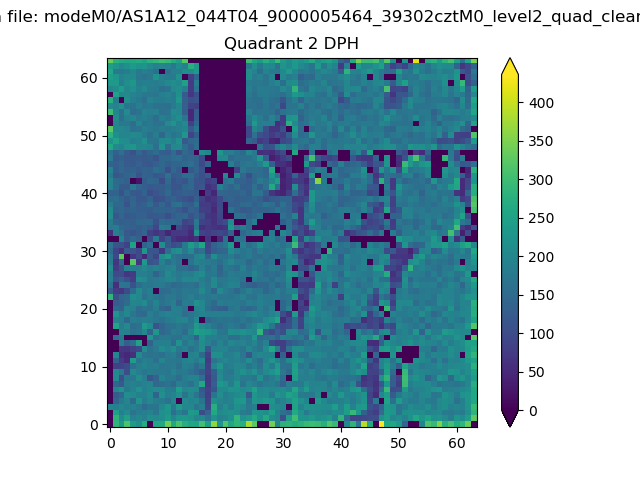
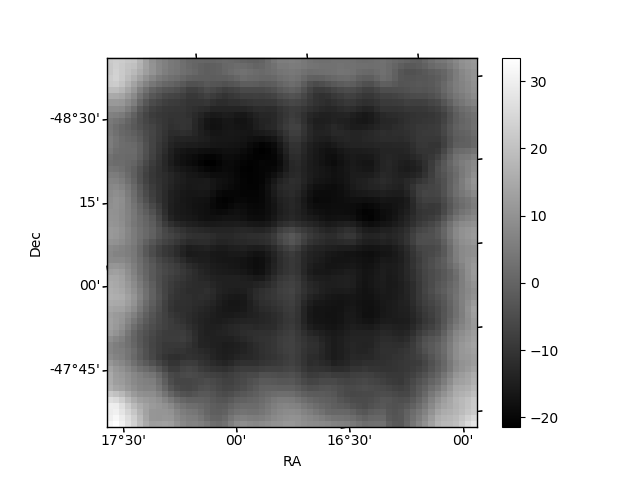
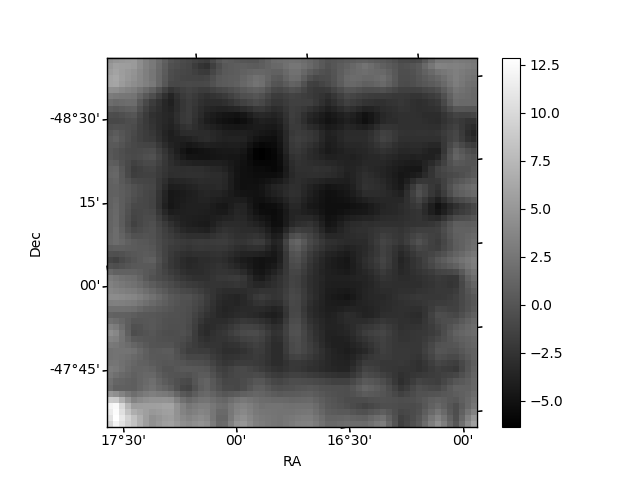
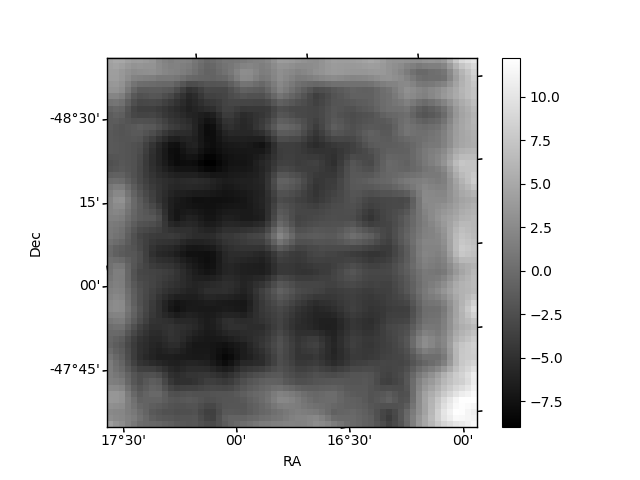
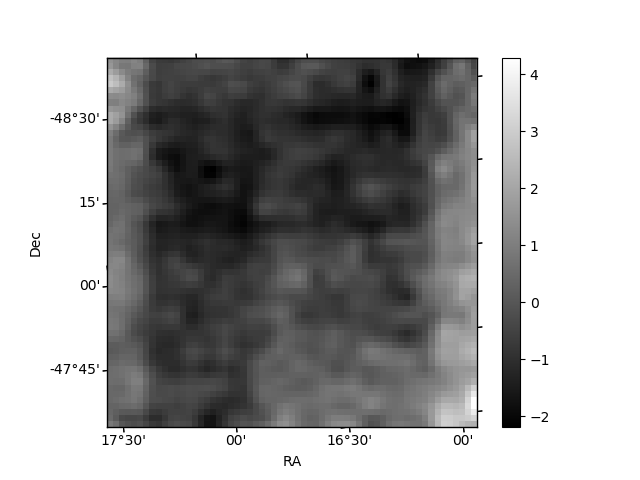
Histogram calculated using DETX and DETY for each event in the final _common_clean file
| Quadrant A | 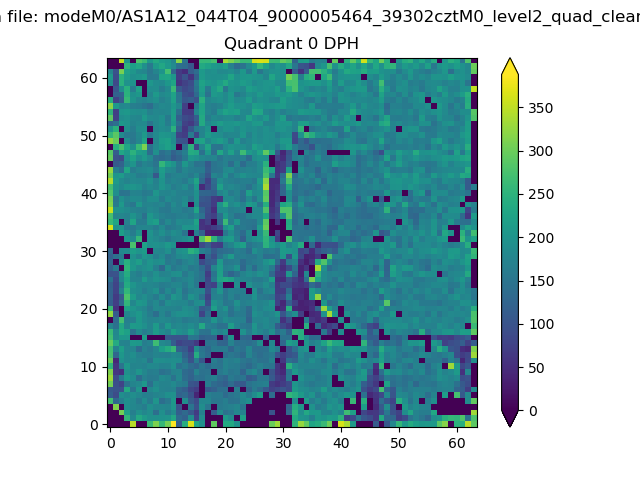 |
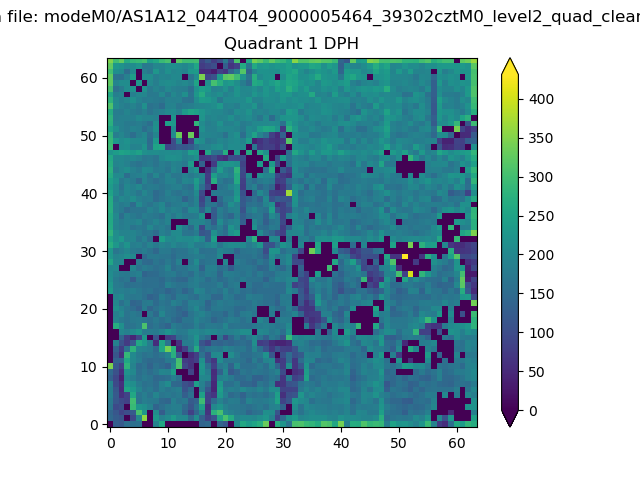 |
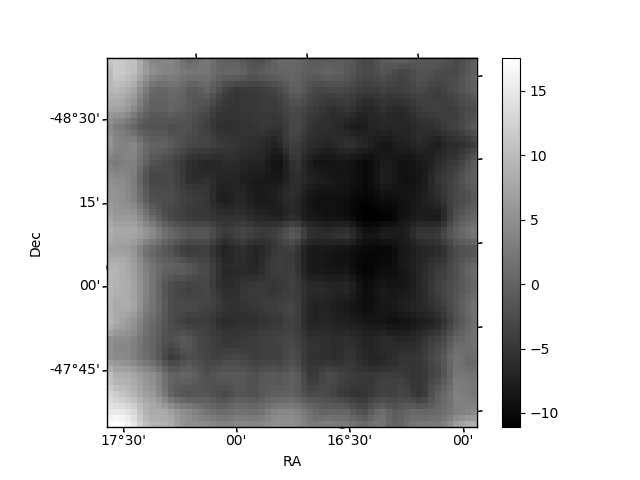
Quadrant B |
|---|---|---|---|
| Quadrant D | 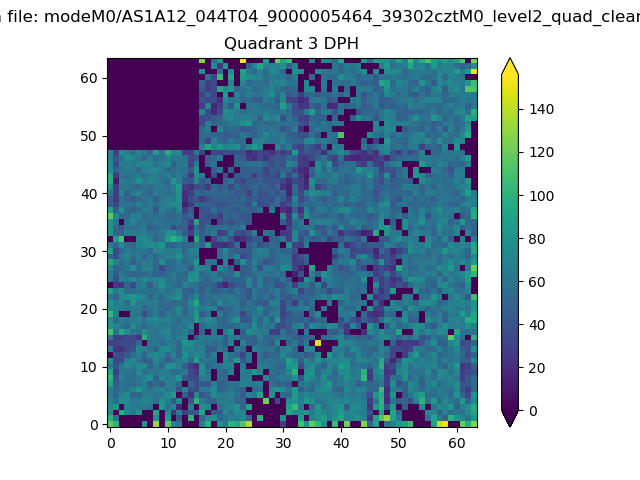 |
 |
Quadrant C |
| Plot type | Count rate plots | Images |
|---|---|---|
| Comparison with Poisson distribution Blue bars denote a histogram of data divided into 1 sec bins. Red curve is a Poisson curve with rate = median count rate of data. |
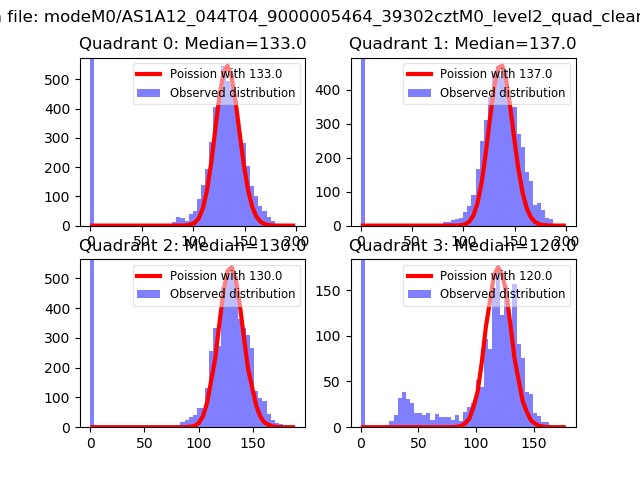 |
 |
| Quadrant-wise count rates Data is divided into 100 sec bins |
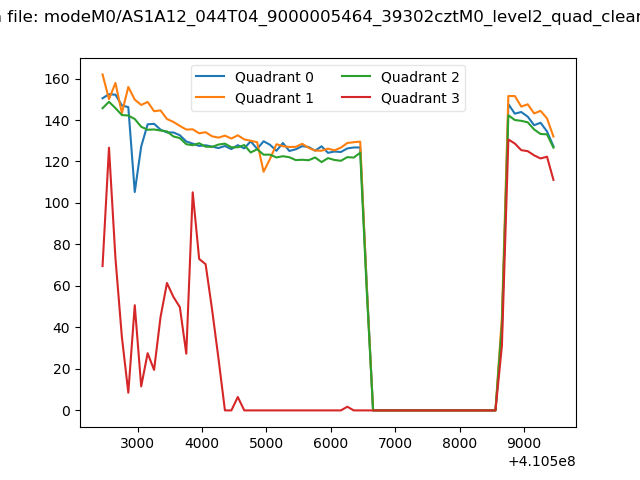 |
|
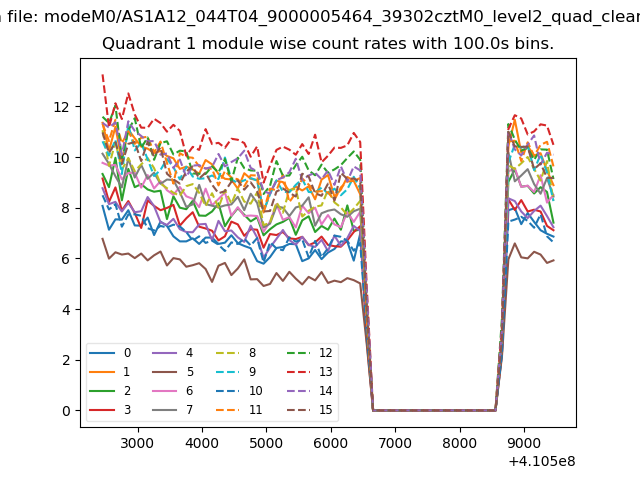
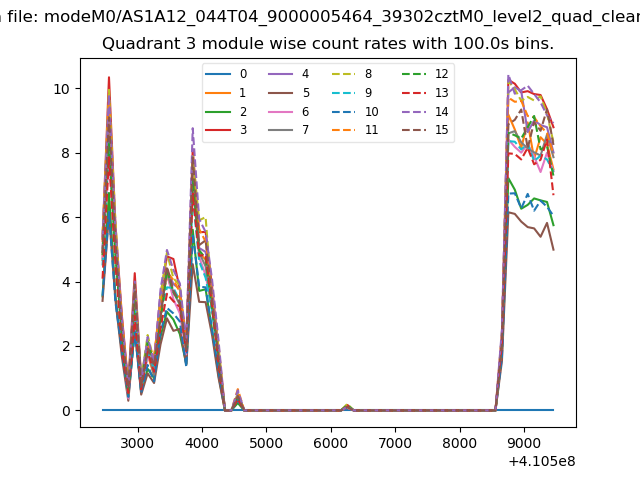
| Module-wise count rates for Quadrant A Data is divided into 100 sec bins |
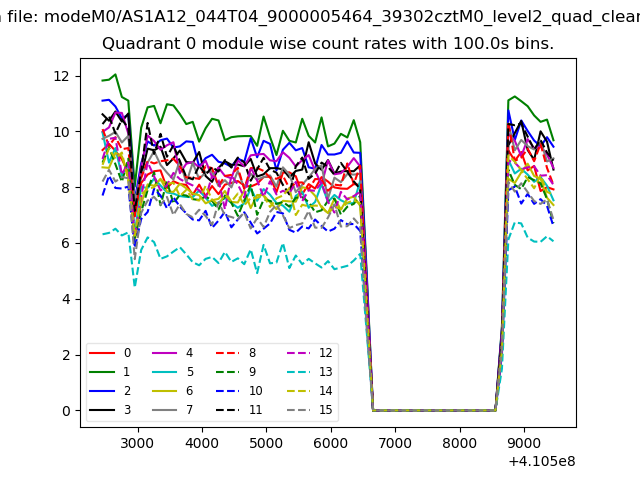 |
 |
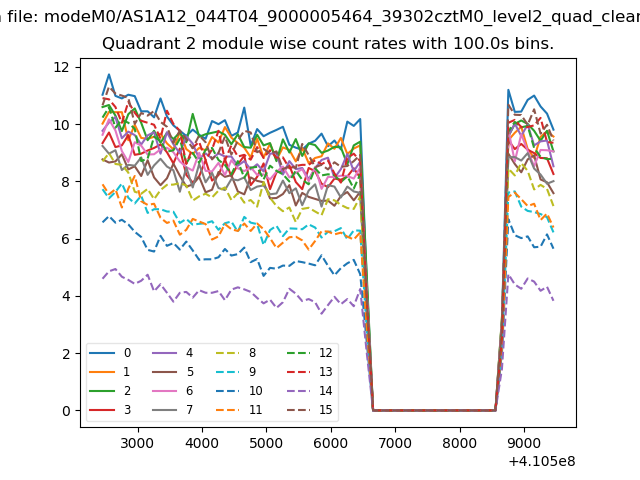
| Module-wise count rates for Quadrant B Data is divided into 100 sec bins |
 |
 |
| Module-wise count rates for Quadrant C Data is divided into 100 sec bins |
 |
 |
| Module-wise count rates for Quadrant D Data is divided into 100 sec bins |
 |
 |
| Parameter | Plot |
|---|---|
| CZT HV Monitor | 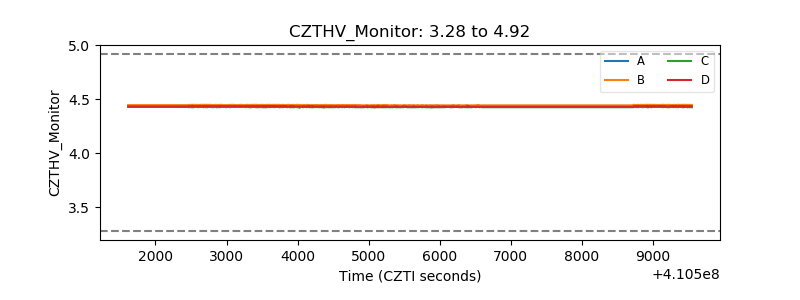 |
| D_VDD | 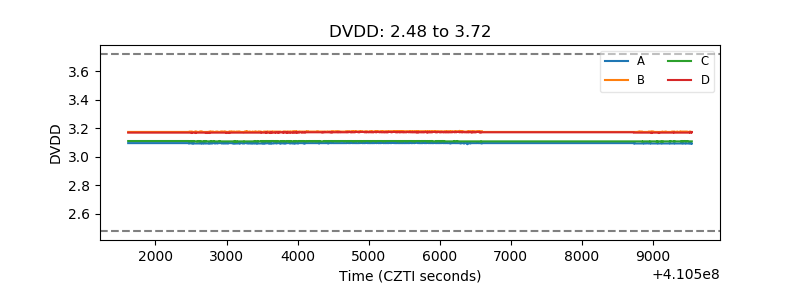 |
| Temperature 1 | 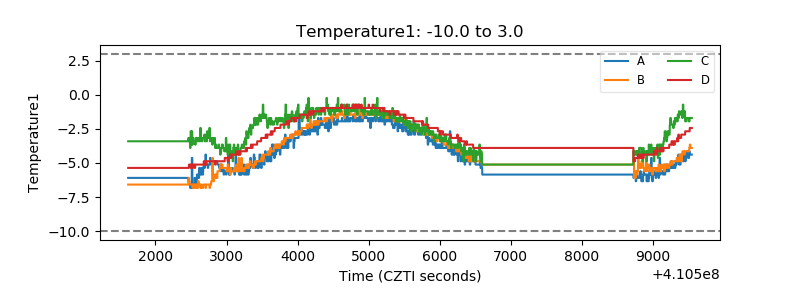 |
| Veto HV Monitor |  |
| Veto LLD |  |
| Alpha Counter | 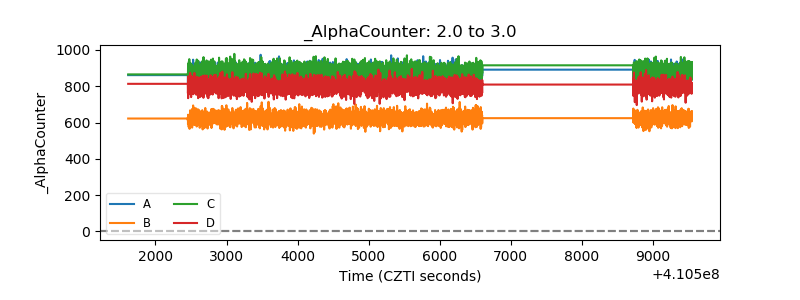 |
| _CPM_Rate | 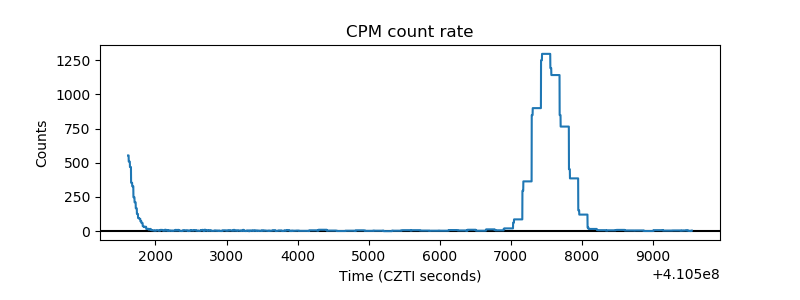 |
| CZT Counter | 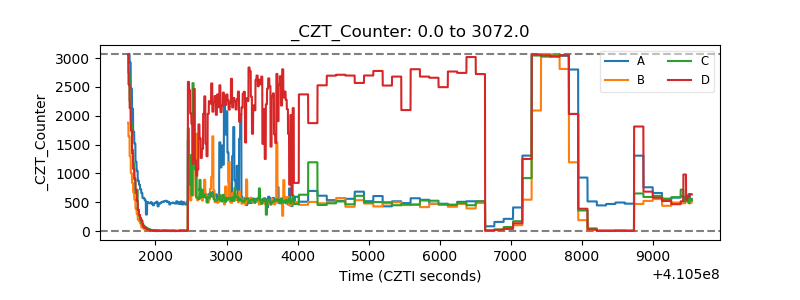 |
| +2.5 Volts monitor | 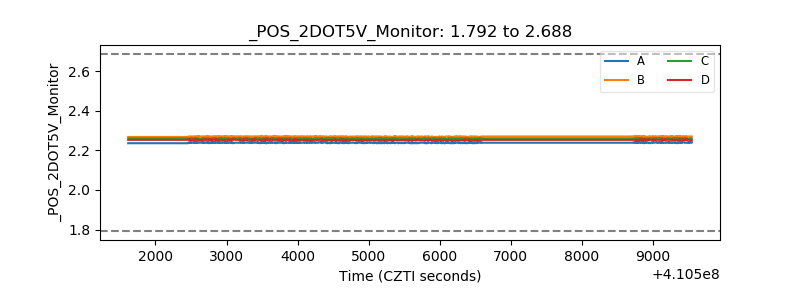 |
| +5 Volts monitor | 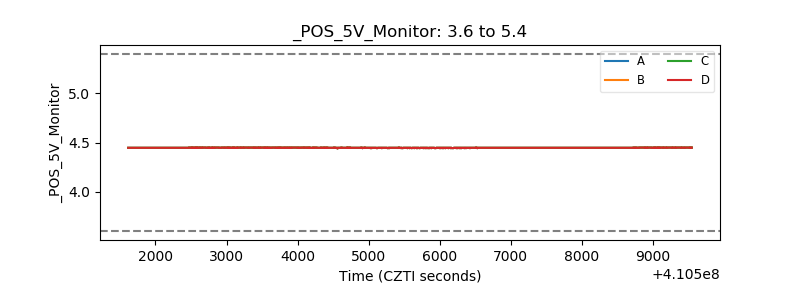 |
| _ROLL_ROT | 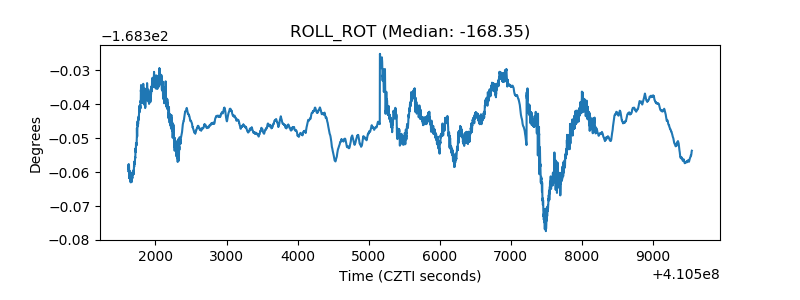 |
| _Roll_DEC | 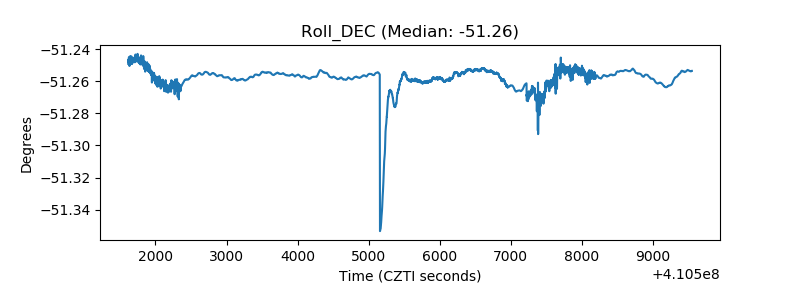 |
| _Roll_RA | 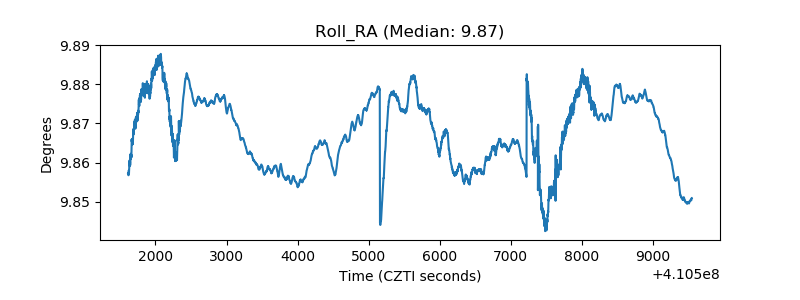 |
| Veto Counter | 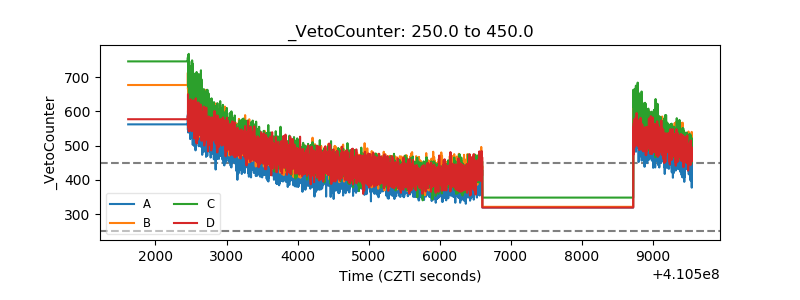 |